

Key Insights
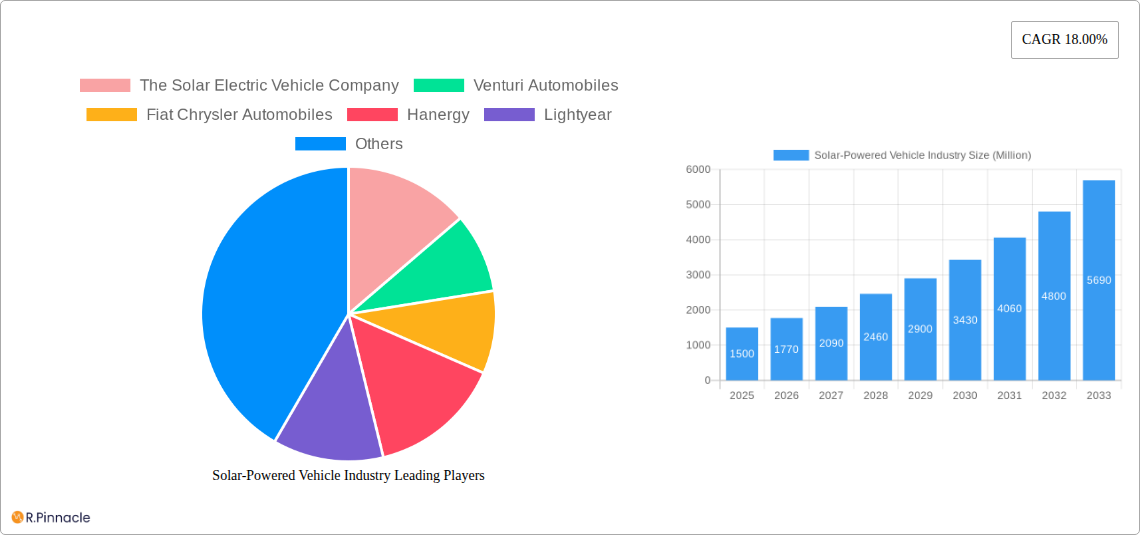
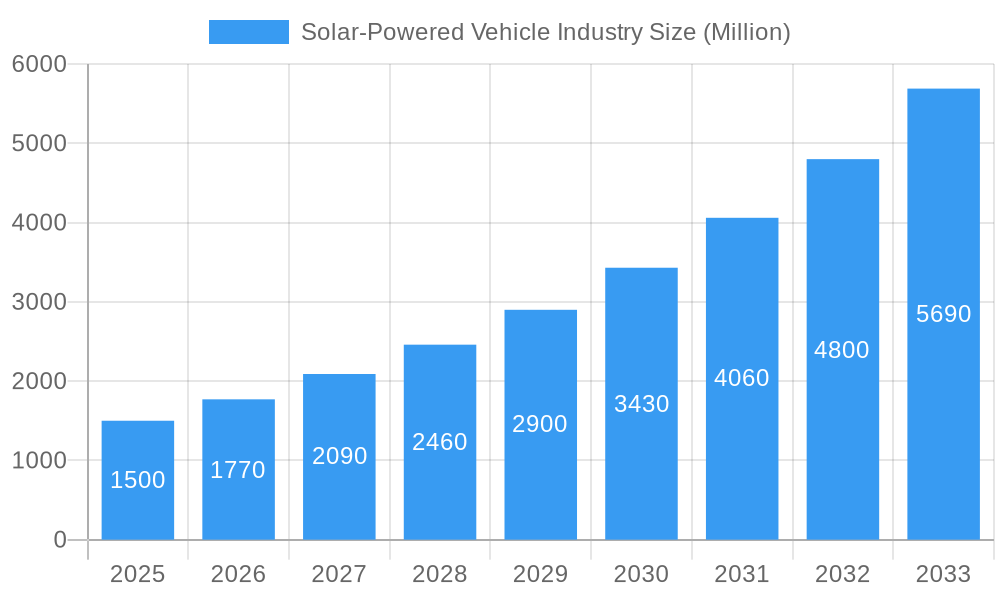
The solar-powered vehicle market is experiencing robust growth, driven by increasing concerns about environmental sustainability and the rising cost of fossil fuels. The market's Compound Annual Growth Rate (CAGR) of 18% from 2019-2033 indicates significant expansion, with the market size expected to reach substantial figures by 2033. This growth is fueled by several key factors, including technological advancements leading to improved solar panel efficiency and battery storage capacity, supportive government policies promoting renewable energy adoption, and increasing consumer demand for eco-friendly transportation solutions. The passenger car segment currently dominates the market, but the commercial vehicle segment is poised for substantial growth driven by the potential for cost savings through reduced fuel expenses and lower emissions. Different battery types (Lithium-ion, Lead-acid, and others) and solar panel types (Mono-crystalline and Poly-crystalline) contribute to market segmentation, each with its own growth trajectory based on cost, efficiency, and technological advancements. Key players, including established automakers like Toyota and Ford, alongside emerging companies like Lightyear and Sono Motors, are actively developing and commercializing solar-powered vehicles, fostering innovation and competition within the sector. Geographical distribution shows a strong presence in North America, Europe, and Asia Pacific, with China and the United States likely to be major contributors to market growth due to their size and investment in renewable energy infrastructure. While challenges remain, such as the initial high cost of these vehicles and limited range compared to conventional vehicles, the long-term outlook for the solar-powered vehicle market remains exceptionally positive.
Solar-Powered Vehicle Industry Market Size (In Billion)
Technological limitations, particularly regarding energy storage and charging times, currently pose a restraint on broader market penetration. However, ongoing research and development in high-efficiency solar cells and advanced battery technologies are continuously addressing these limitations. Furthermore, variations in government regulations and incentives across different regions influence the speed of adoption. Despite these challenges, the long-term potential of solar-powered vehicles is undeniable. The decreasing cost of solar technology, coupled with increasing environmental awareness and stringent emissions regulations, is expected to drive accelerated growth in the coming years. The market will likely see increased diversification of vehicle types, battery technologies, and solar panel designs, further enhancing market dynamism and potentially leading to the creation of entirely new market segments.
Solar-Powered Vehicle Industry Company Market Share
Solar-Powered Vehicle Industry Report: 2019-2033
This comprehensive report provides an in-depth analysis of the solar-powered vehicle industry, projecting a market valued at $XX Million by 2033. Targeting industry professionals, investors, and researchers, this report offers actionable insights into market trends, technological advancements, and key players shaping the future of sustainable transportation. The study period covers 2019-2033, with 2025 as the base and estimated year.
Solar-Powered Vehicle Industry Market Structure & Innovation Trends
This section provides a comprehensive analysis of the competitive landscape within the burgeoning solar-powered vehicle industry. We dissect market concentration by identifying dominant players and their respective market shares, featuring key companies such as The Solar Electric Vehicle Company, Venturi Automobiles, Fiat Chrysler Automobiles, Hanergy, Lightyear, Toyota Motor Corporation, Mahindra Electric Mobility Limited, Sono Motors, America Cruise Car, and Ford Motor Company. The report delves into the primary drivers of innovation, highlighting crucial advancements in battery technology (including next-generation Lithium-ion, solid-state, and other novel chemistries), cutting-edge solar panel technology (such as highly efficient Mono-crystalline and advanced Poly-crystalline silicon, as well as emerging perovskite solar cells), and innovative vehicle designs across Passenger Cars and Commercial Vehicles. We also examine the strategic impact of regulatory frameworks, which are increasingly shaping the pace and direction of technological development and market entry. Furthermore, the analysis scrutinizes the role and impact of mergers and acquisitions (M&A), quantifying deal values (in Millions) and their influence on market consolidation and the acceleration of innovation. The influence of substitute products, such as advanced battery electric vehicles (BEVs) and highly efficient hybrid electric vehicles (HEVs), and the evolving end-user demographics, characterized by a growing demand for sustainability and advanced mobility solutions, are considered in detail to understand their effect on market structure and overall growth trajectory.
Solar-Powered Vehicle Industry Market Dynamics & Trends
This section offers an in-depth exploration of the dynamic forces actively shaping the solar-powered vehicle market. We meticulously analyze the key market growth drivers, propelled by escalating global environmental concerns, supportive government incentives and subsidies, and continuous technological advancements that are significantly improving vehicle efficiency and driving down costs. The report keenly examines disruptive technological innovations, with a particular focus on the rapid development of more efficient photovoltaic cells and next-generation battery technologies that offer increased energy density and faster charging capabilities. Consumer preferences are shifting towards sustainable transportation solutions, and we assess the competitive dynamics between established automotive giants and agile, forward-thinking solar vehicle startups. Key performance indicators, including the Compound Annual Growth Rate (CAGR) and market penetration rates across diverse vehicle segments and nascent technologies, are presented with actionable insights. The influence of critical external factors such as fluctuating raw material prices for batteries and solar panels, and the strategic development and availability of robust charging infrastructure, are thoroughly assessed to provide a holistic view of market momentum.
Dominant Regions & Segments in Solar-Powered Vehicle Industry
This section identifies the leading regions and segments within the solar-powered vehicle industry. Dominance is analyzed across various categories, including:
- Vehicle Type: Passenger Cars vs. Commercial Vehicles
- Electric Vehicle Type: Battery Electric Vehicles (BEVs) vs. Hybrid Electric Vehicles (HEVs)
- Battery Type: Lithium-ion, Lead-acid, and Other Battery Types
- Solar Panel Type: Mono-crystalline and Poly-crystalline
Key drivers for the dominance of specific regions and segments are detailed using bullet points, emphasizing economic policies, infrastructure development, and consumer behavior. A comprehensive analysis of market size and growth potential for each segment is included.
Solar-Powered Vehicle Industry Product Innovations
This section summarizes recent innovations in solar-powered vehicle technology, highlighting advancements in solar panel efficiency, battery technology, and vehicle design. The analysis focuses on how these innovations translate into improved vehicle range, performance, and affordability, enhancing their market competitiveness and appeal to a wider range of consumers. Technological trends and market fit for emerging innovations are discussed.
Report Scope & Segmentation Analysis
This report provides a granular segmentation of the solar-powered vehicle market, offering detailed analysis across several pivotal parameters:
- Vehicle Type: A dedicated focus on Passenger Cars, including comprehensive growth projections, current market sizes, and the intricate competitive dynamics within this crucial segment.
- Commercial Vehicles: An in-depth analysis encompassing market size, projected growth trajectories, and the competitive landscape for solar-powered commercial vehicles, such as delivery vans and buses.
- Electric Vehicle Type: Detailed segmentation for Battery Electric Vehicle (BEV) and Hybrid Electric Vehicle (HEV) applications of solar technology, including specific growth projections, market sizes, and competitive dynamics for each sub-segment.
- Battery Type: An extensive review of Lithium-ion, Lead-acid, and other emerging battery types integrated into solar vehicles, presenting growth projections, market sizes, and competitive dynamics for each battery chemistry.
- Solar Panel Type: An analysis of Mono-crystalline, Poly-crystalline, and other advanced solar panel technologies used in vehicles, examining their respective growth projections, market sizes, and competitive dynamics.
For each defined segment, the report delivers detailed growth projections, precise market size estimations, and a thorough assessment of competitive dynamics, providing strategic insights for stakeholders.
Key Drivers of Solar-Powered Vehicle Industry Growth
The accelerated growth of the solar-powered vehicle industry is propelled by a confluence of interconnected and reinforcing factors:
- Technological Advancements: Continuous breakthroughs in solar cell efficiency, leading to higher energy conversion rates, coupled with significant improvements in battery technology (e.g., energy density, lifespan, charging speed) and refined vehicle aerodynamics, are collectively contributing to reduced manufacturing costs and enhanced vehicle range, making solar vehicles more practical and appealing.
- Government Regulations and Incentives: Proactive government policies worldwide, including substantial tax credits, direct subsidies, and favorable regulations promoting the adoption of electric and sustainable vehicles, are acting as powerful catalysts, accelerating market penetration and encouraging investment in research and development.
- Environmental Concerns: A growing global awareness and heightened concern regarding climate change, air pollution, and the finite nature of fossil fuels are fundamentally reshaping consumer attitudes and preferences, driving a strong and increasing demand for eco-friendly and sustainable transportation alternatives like solar-powered vehicles.
These critical drivers are analyzed in considerable detail, supported by concrete examples and case studies that illustrate their tangible impact on the overall market growth trajectory and the increasing viability of solar mobility.
Challenges in the Solar-Powered Vehicle Industry Sector
The solar-powered vehicle industry faces several challenges:
- High Initial Costs: The relatively high price of solar-powered vehicles compared to conventional vehicles remains a barrier to wider adoption.
- Limited Range and Charging Infrastructure: Concerns about limited driving range and the availability of charging infrastructure persist.
- Supply Chain Constraints: The supply chain for critical components like batteries and solar cells can be vulnerable to disruptions.
Emerging Opportunities in Solar-Powered Vehicle Industry
The solar-powered vehicle industry is a fertile ground for significant future opportunities, driven by evolving market needs and technological progress:
- New Markets: The expansion into emerging markets, characterized by rapidly growing economies, increasing disposable incomes, and a heightened environmental consciousness among populations, presents substantial untapped potential for the widespread adoption of solar-powered vehicles.
- Technological Innovations: Ongoing and future advancements in battery technology (e.g., solid-state, improved cycle life), solar panel efficiency (e.g., higher power output per unit area, flexibility), and innovative vehicle design (e.g., lightweight materials, integrated solar surfaces) will unlock new performance benchmarks and cost efficiencies, creating novel product categories and applications.
- Integration with Smart Grids: The inherent capability of solar-powered vehicles to generate and store energy opens up exciting possibilities for their integration with smart grids. This integration can enable vehicles to act as distributed energy resources, providing valuable energy storage, demand response services, and contributing to grid stabilization, thus creating new revenue streams and enhancing the overall value proposition of solar mobility.
Leading Players in the Solar-Powered Vehicle Industry Market
- The Solar Electric Vehicle Company
- Venturi Automobiles
- Fiat Chrysler Automobiles
- Hanergy
- Lightyear
- Toyota Motor Corporation
- Mahindra Electric Mobility Limited
- Sono Motors
- America Cruise Car
- Ford Motor Company
Key Developments in Solar-Powered Vehicle Industry
- November 2021: Aptera expands alpha testing of its commercial solar vehicle, introducing new exterior (Black, White, Silver) and interior (Vida, Coast, Codex) options and begins work on Beta vehicles for optimized aerodynamics and cabin size.
- September 2021: Sono Motors aims for a Nasdaq listing to fund solar electric vehicle development and production.
- July 2021: Lightyear tests its solar car, achieving a 710 km range, planning commercial production by H1 2022 and mass market entry by 2024.
- May 2021: MAN Trucks and Sono Motors partner to assess integrating Sono Solar technology into MAN's eTGE electric transporter.
- April 2021: Bridgestone partners with Lightyear to provide Turanza Eco EV tires for Lightyear One, boosting efficiency and reducing the vehicle's environmental footprint.
Future Outlook for Solar-Powered Vehicle Industry Market
The future of the solar-powered vehicle industry is bright, driven by continuous technological advancements, supportive government policies, and growing environmental consciousness. The market is poised for significant growth, offering substantial opportunities for innovation and investment in the coming years. Strategic partnerships and collaborations among automakers, technology companies, and energy providers will be crucial in accelerating the adoption of this sustainable transportation solution.
Solar-Powered Vehicle Industry Segmentation
-
1. Vehicle Type
- 1.1. Passenger Cars
- 1.2. Commercial Vehicles
-
2. Electric Vehicle Type
- 2.1. Battery Electric Vehicle
- 2.2. Hybrid Electric Vehicle
-
3. Battery Type
- 3.1. Lithium Ion
- 3.2. Lead Acid
- 3.3. Other Battery Types
-
4. Solar Panel Type
- 4.1. Mono-crystalline
- 4.2. Poly-crystalline
Solar-Powered Vehicle Industry Segmentation By Geography
-
1. North America
- 1.1. United States
- 1.2. Canada
- 1.3. Rest of North America
-
2. Europe
- 2.1. Germany
- 2.2. United Kingdom
- 2.3. France
- 2.4. Spain
- 2.5. Rest of Europe
-
3. Asia Pacific
- 3.1. China
- 3.2. Japan
- 3.3. India
- 3.4. Rest of Asia Pacific
-
4. Rest of the World
- 4.1. Brazil
- 4.2. United Arab Emirates
- 4.3. Other Countries
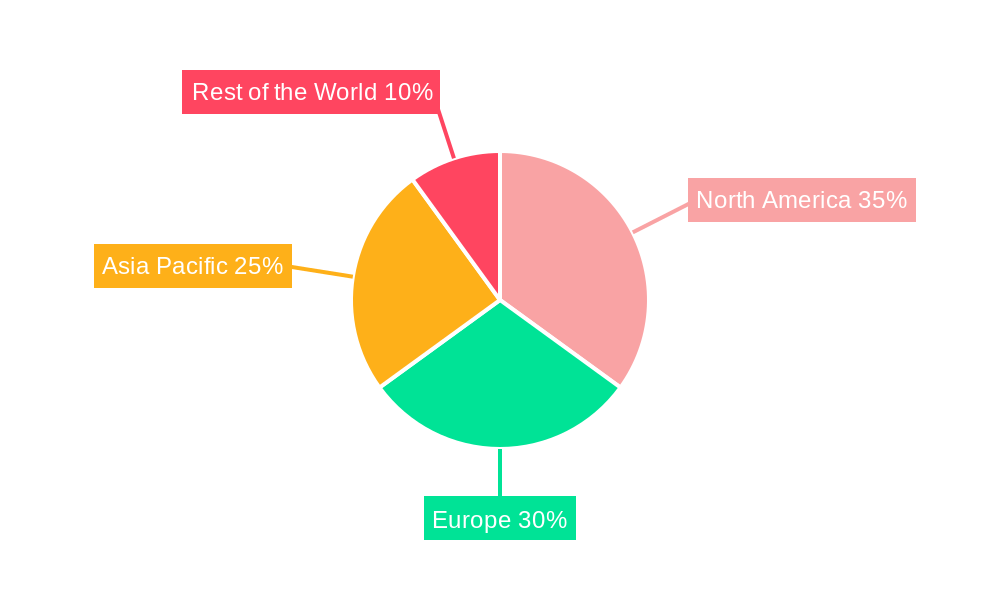
Solar-Powered Vehicle Industry Regional Market Share
Geographic Coverage of Solar-Powered Vehicle Industry
Solar-Powered Vehicle Industry REPORT HIGHLIGHTS
| Aspects | Details |
|---|---|
| Study Period | 2020-2034 |
| Base Year | 2025 |
| Estimated Year | 2026 |
| Forecast Period | 2026-2034 |
| Historical Period | 2020-2025 |
| Growth Rate | CAGR of 18.00% from 2020-2034 |
| Segmentation |
|
Table of Contents
- 1. Introduction
- 1.1. Research Scope
- 1.2. Market Segmentation
- 1.3. Research Methodology
- 1.4. Definitions and Assumptions
- 2. Executive Summary
- 2.1. Introduction
- 3. Market Dynamics
- 3.1. Introduction
- 3.2. Market Drivers
- 3.2.1. Increasing disposable income and Low-interest rates from lenders increase the market demand
- 3.3. Market Restrains
- 3.3.1. High initial costs may obstruct the growth
- 3.4. Market Trends
- 3.4.1. Stringent Vehicle Emission Norms and Regulations are Driving the Demand for Hybrid Vehicles
- 4. Market Factor Analysis
- 4.1. Porters Five Forces
- 4.2. Supply/Value Chain
- 4.3. PESTEL analysis
- 4.4. Market Entropy
- 4.5. Patent/Trademark Analysis
- 5. Global Solar-Powered Vehicle Industry Analysis, Insights and Forecast, 2020-2032
- 5.1. Market Analysis, Insights and Forecast - by Vehicle Type
- 5.1.1. Passenger Cars
- 5.1.2. Commercial Vehicles
- 5.2. Market Analysis, Insights and Forecast - by Electric Vehicle Type
- 5.2.1. Battery Electric Vehicle
- 5.2.2. Hybrid Electric Vehicle
- 5.3. Market Analysis, Insights and Forecast - by Battery Type
- 5.3.1. Lithium Ion
- 5.3.2. Lead Acid
- 5.3.3. Other Battery Types
- 5.4. Market Analysis, Insights and Forecast - by Solar Panel Type
- 5.4.1. Mono-crystalline
- 5.4.2. Poly-crystalline
- 5.5. Market Analysis, Insights and Forecast - by Region
- 5.5.1. North America
- 5.5.2. Europe
- 5.5.3. Asia Pacific
- 5.5.4. Rest of the World
- 5.1. Market Analysis, Insights and Forecast - by Vehicle Type
- 6. North America Solar-Powered Vehicle Industry Analysis, Insights and Forecast, 2020-2032
- 6.1. Market Analysis, Insights and Forecast - by Vehicle Type
- 6.1.1. Passenger Cars
- 6.1.2. Commercial Vehicles
- 6.2. Market Analysis, Insights and Forecast - by Electric Vehicle Type
- 6.2.1. Battery Electric Vehicle
- 6.2.2. Hybrid Electric Vehicle
- 6.3. Market Analysis, Insights and Forecast - by Battery Type
- 6.3.1. Lithium Ion
- 6.3.2. Lead Acid
- 6.3.3. Other Battery Types
- 6.4. Market Analysis, Insights and Forecast - by Solar Panel Type
- 6.4.1. Mono-crystalline
- 6.4.2. Poly-crystalline
- 6.1. Market Analysis, Insights and Forecast - by Vehicle Type
- 7. Europe Solar-Powered Vehicle Industry Analysis, Insights and Forecast, 2020-2032
- 7.1. Market Analysis, Insights and Forecast - by Vehicle Type
- 7.1.1. Passenger Cars
- 7.1.2. Commercial Vehicles
- 7.2. Market Analysis, Insights and Forecast - by Electric Vehicle Type
- 7.2.1. Battery Electric Vehicle
- 7.2.2. Hybrid Electric Vehicle
- 7.3. Market Analysis, Insights and Forecast - by Battery Type
- 7.3.1. Lithium Ion
- 7.3.2. Lead Acid
- 7.3.3. Other Battery Types
- 7.4. Market Analysis, Insights and Forecast - by Solar Panel Type
- 7.4.1. Mono-crystalline
- 7.4.2. Poly-crystalline
- 7.1. Market Analysis, Insights and Forecast - by Vehicle Type
- 8. Asia Pacific Solar-Powered Vehicle Industry Analysis, Insights and Forecast, 2020-2032
- 8.1. Market Analysis, Insights and Forecast - by Vehicle Type
- 8.1.1. Passenger Cars
- 8.1.2. Commercial Vehicles
- 8.2. Market Analysis, Insights and Forecast - by Electric Vehicle Type
- 8.2.1. Battery Electric Vehicle
- 8.2.2. Hybrid Electric Vehicle
- 8.3. Market Analysis, Insights and Forecast - by Battery Type
- 8.3.1. Lithium Ion
- 8.3.2. Lead Acid
- 8.3.3. Other Battery Types
- 8.4. Market Analysis, Insights and Forecast - by Solar Panel Type
- 8.4.1. Mono-crystalline
- 8.4.2. Poly-crystalline
- 8.1. Market Analysis, Insights and Forecast - by Vehicle Type
- 9. Rest of the World Solar-Powered Vehicle Industry Analysis, Insights and Forecast, 2020-2032
- 9.1. Market Analysis, Insights and Forecast - by Vehicle Type
- 9.1.1. Passenger Cars
- 9.1.2. Commercial Vehicles
- 9.2. Market Analysis, Insights and Forecast - by Electric Vehicle Type
- 9.2.1. Battery Electric Vehicle
- 9.2.2. Hybrid Electric Vehicle
- 9.3. Market Analysis, Insights and Forecast - by Battery Type
- 9.3.1. Lithium Ion
- 9.3.2. Lead Acid
- 9.3.3. Other Battery Types
- 9.4. Market Analysis, Insights and Forecast - by Solar Panel Type
- 9.4.1. Mono-crystalline
- 9.4.2. Poly-crystalline
- 9.1. Market Analysis, Insights and Forecast - by Vehicle Type
- 10. Competitive Analysis
- 10.1. Global Market Share Analysis 2025
- 10.2. Company Profiles
- 10.2.1 The Solar Electric Vehicle Company
- 10.2.1.1. Overview
- 10.2.1.2. Products
- 10.2.1.3. SWOT Analysis
- 10.2.1.4. Recent Developments
- 10.2.1.5. Financials (Based on Availability)
- 10.2.2 Venturi Automobiles
- 10.2.2.1. Overview
- 10.2.2.2. Products
- 10.2.2.3. SWOT Analysis
- 10.2.2.4. Recent Developments
- 10.2.2.5. Financials (Based on Availability)
- 10.2.3 Fiat Chrysler Automobiles
- 10.2.3.1. Overview
- 10.2.3.2. Products
- 10.2.3.3. SWOT Analysis
- 10.2.3.4. Recent Developments
- 10.2.3.5. Financials (Based on Availability)
- 10.2.4 Hanergy
- 10.2.4.1. Overview
- 10.2.4.2. Products
- 10.2.4.3. SWOT Analysis
- 10.2.4.4. Recent Developments
- 10.2.4.5. Financials (Based on Availability)
- 10.2.5 Lightyear
- 10.2.5.1. Overview
- 10.2.5.2. Products
- 10.2.5.3. SWOT Analysis
- 10.2.5.4. Recent Developments
- 10.2.5.5. Financials (Based on Availability)
- 10.2.6 Toyota Motor Corporation
- 10.2.6.1. Overview
- 10.2.6.2. Products
- 10.2.6.3. SWOT Analysis
- 10.2.6.4. Recent Developments
- 10.2.6.5. Financials (Based on Availability)
- 10.2.7 Mahindra Electric Mobility Limite
- 10.2.7.1. Overview
- 10.2.7.2. Products
- 10.2.7.3. SWOT Analysis
- 10.2.7.4. Recent Developments
- 10.2.7.5. Financials (Based on Availability)
- 10.2.8 Sono Motors
- 10.2.8.1. Overview
- 10.2.8.2. Products
- 10.2.8.3. SWOT Analysis
- 10.2.8.4. Recent Developments
- 10.2.8.5. Financials (Based on Availability)
- 10.2.9 America Cruise Car
- 10.2.9.1. Overview
- 10.2.9.2. Products
- 10.2.9.3. SWOT Analysis
- 10.2.9.4. Recent Developments
- 10.2.9.5. Financials (Based on Availability)
- 10.2.10 Ford Motor Company
- 10.2.10.1. Overview
- 10.2.10.2. Products
- 10.2.10.3. SWOT Analysis
- 10.2.10.4. Recent Developments
- 10.2.10.5. Financials (Based on Availability)
- 10.2.1 The Solar Electric Vehicle Company
List of Figures
- Figure 1: Global Solar-Powered Vehicle Industry Revenue Breakdown (Million, %) by Region 2025 & 2033
- Figure 2: North America Solar-Powered Vehicle Industry Revenue (Million), by Vehicle Type 2025 & 2033
- Figure 3: North America Solar-Powered Vehicle Industry Revenue Share (%), by Vehicle Type 2025 & 2033
- Figure 4: North America Solar-Powered Vehicle Industry Revenue (Million), by Electric Vehicle Type 2025 & 2033
- Figure 5: North America Solar-Powered Vehicle Industry Revenue Share (%), by Electric Vehicle Type 2025 & 2033
- Figure 6: North America Solar-Powered Vehicle Industry Revenue (Million), by Battery Type 2025 & 2033
- Figure 7: North America Solar-Powered Vehicle Industry Revenue Share (%), by Battery Type 2025 & 2033
- Figure 8: North America Solar-Powered Vehicle Industry Revenue (Million), by Solar Panel Type 2025 & 2033
- Figure 9: North America Solar-Powered Vehicle Industry Revenue Share (%), by Solar Panel Type 2025 & 2033
- Figure 10: North America Solar-Powered Vehicle Industry Revenue (Million), by Country 2025 & 2033
- Figure 11: North America Solar-Powered Vehicle Industry Revenue Share (%), by Country 2025 & 2033
- Figure 12: Europe Solar-Powered Vehicle Industry Revenue (Million), by Vehicle Type 2025 & 2033
- Figure 13: Europe Solar-Powered Vehicle Industry Revenue Share (%), by Vehicle Type 2025 & 2033
- Figure 14: Europe Solar-Powered Vehicle Industry Revenue (Million), by Electric Vehicle Type 2025 & 2033
- Figure 15: Europe Solar-Powered Vehicle Industry Revenue Share (%), by Electric Vehicle Type 2025 & 2033
- Figure 16: Europe Solar-Powered Vehicle Industry Revenue (Million), by Battery Type 2025 & 2033
- Figure 17: Europe Solar-Powered Vehicle Industry Revenue Share (%), by Battery Type 2025 & 2033
- Figure 18: Europe Solar-Powered Vehicle Industry Revenue (Million), by Solar Panel Type 2025 & 2033
- Figure 19: Europe Solar-Powered Vehicle Industry Revenue Share (%), by Solar Panel Type 2025 & 2033
- Figure 20: Europe Solar-Powered Vehicle Industry Revenue (Million), by Country 2025 & 2033
- Figure 21: Europe Solar-Powered Vehicle Industry Revenue Share (%), by Country 2025 & 2033
- Figure 22: Asia Pacific Solar-Powered Vehicle Industry Revenue (Million), by Vehicle Type 2025 & 2033
- Figure 23: Asia Pacific Solar-Powered Vehicle Industry Revenue Share (%), by Vehicle Type 2025 & 2033
- Figure 24: Asia Pacific Solar-Powered Vehicle Industry Revenue (Million), by Electric Vehicle Type 2025 & 2033
- Figure 25: Asia Pacific Solar-Powered Vehicle Industry Revenue Share (%), by Electric Vehicle Type 2025 & 2033
- Figure 26: Asia Pacific Solar-Powered Vehicle Industry Revenue (Million), by Battery Type 2025 & 2033
- Figure 27: Asia Pacific Solar-Powered Vehicle Industry Revenue Share (%), by Battery Type 2025 & 2033
- Figure 28: Asia Pacific Solar-Powered Vehicle Industry Revenue (Million), by Solar Panel Type 2025 & 2033
- Figure 29: Asia Pacific Solar-Powered Vehicle Industry Revenue Share (%), by Solar Panel Type 2025 & 2033
- Figure 30: Asia Pacific Solar-Powered Vehicle Industry Revenue (Million), by Country 2025 & 2033
- Figure 31: Asia Pacific Solar-Powered Vehicle Industry Revenue Share (%), by Country 2025 & 2033
- Figure 32: Rest of the World Solar-Powered Vehicle Industry Revenue (Million), by Vehicle Type 2025 & 2033
- Figure 33: Rest of the World Solar-Powered Vehicle Industry Revenue Share (%), by Vehicle Type 2025 & 2033
- Figure 34: Rest of the World Solar-Powered Vehicle Industry Revenue (Million), by Electric Vehicle Type 2025 & 2033
- Figure 35: Rest of the World Solar-Powered Vehicle Industry Revenue Share (%), by Electric Vehicle Type 2025 & 2033
- Figure 36: Rest of the World Solar-Powered Vehicle Industry Revenue (Million), by Battery Type 2025 & 2033
- Figure 37: Rest of the World Solar-Powered Vehicle Industry Revenue Share (%), by Battery Type 2025 & 2033
- Figure 38: Rest of the World Solar-Powered Vehicle Industry Revenue (Million), by Solar Panel Type 2025 & 2033
- Figure 39: Rest of the World Solar-Powered Vehicle Industry Revenue Share (%), by Solar Panel Type 2025 & 2033
- Figure 40: Rest of the World Solar-Powered Vehicle Industry Revenue (Million), by Country 2025 & 2033
- Figure 41: Rest of the World Solar-Powered Vehicle Industry Revenue Share (%), by Country 2025 & 2033
List of Tables
- Table 1: Global Solar-Powered Vehicle Industry Revenue Million Forecast, by Vehicle Type 2020 & 2033
- Table 2: Global Solar-Powered Vehicle Industry Revenue Million Forecast, by Electric Vehicle Type 2020 & 2033
- Table 3: Global Solar-Powered Vehicle Industry Revenue Million Forecast, by Battery Type 2020 & 2033
- Table 4: Global Solar-Powered Vehicle Industry Revenue Million Forecast, by Solar Panel Type 2020 & 2033
- Table 5: Global Solar-Powered Vehicle Industry Revenue Million Forecast, by Region 2020 & 2033
- Table 6: Global Solar-Powered Vehicle Industry Revenue Million Forecast, by Vehicle Type 2020 & 2033
- Table 7: Global Solar-Powered Vehicle Industry Revenue Million Forecast, by Electric Vehicle Type 2020 & 2033
- Table 8: Global Solar-Powered Vehicle Industry Revenue Million Forecast, by Battery Type 2020 & 2033
- Table 9: Global Solar-Powered Vehicle Industry Revenue Million Forecast, by Solar Panel Type 2020 & 2033
- Table 10: Global Solar-Powered Vehicle Industry Revenue Million Forecast, by Country 2020 & 2033
- Table 11: United States Solar-Powered Vehicle Industry Revenue (Million) Forecast, by Application 2020 & 2033
- Table 12: Canada Solar-Powered Vehicle Industry Revenue (Million) Forecast, by Application 2020 & 2033
- Table 13: Rest of North America Solar-Powered Vehicle Industry Revenue (Million) Forecast, by Application 2020 & 2033
- Table 14: Global Solar-Powered Vehicle Industry Revenue Million Forecast, by Vehicle Type 2020 & 2033
- Table 15: Global Solar-Powered Vehicle Industry Revenue Million Forecast, by Electric Vehicle Type 2020 & 2033
- Table 16: Global Solar-Powered Vehicle Industry Revenue Million Forecast, by Battery Type 2020 & 2033
- Table 17: Global Solar-Powered Vehicle Industry Revenue Million Forecast, by Solar Panel Type 2020 & 2033
- Table 18: Global Solar-Powered Vehicle Industry Revenue Million Forecast, by Country 2020 & 2033
- Table 19: Germany Solar-Powered Vehicle Industry Revenue (Million) Forecast, by Application 2020 & 2033
- Table 20: United Kingdom Solar-Powered Vehicle Industry Revenue (Million) Forecast, by Application 2020 & 2033
- Table 21: France Solar-Powered Vehicle Industry Revenue (Million) Forecast, by Application 2020 & 2033
- Table 22: Spain Solar-Powered Vehicle Industry Revenue (Million) Forecast, by Application 2020 & 2033
- Table 23: Rest of Europe Solar-Powered Vehicle Industry Revenue (Million) Forecast, by Application 2020 & 2033
- Table 24: Global Solar-Powered Vehicle Industry Revenue Million Forecast, by Vehicle Type 2020 & 2033
- Table 25: Global Solar-Powered Vehicle Industry Revenue Million Forecast, by Electric Vehicle Type 2020 & 2033
- Table 26: Global Solar-Powered Vehicle Industry Revenue Million Forecast, by Battery Type 2020 & 2033
- Table 27: Global Solar-Powered Vehicle Industry Revenue Million Forecast, by Solar Panel Type 2020 & 2033
- Table 28: Global Solar-Powered Vehicle Industry Revenue Million Forecast, by Country 2020 & 2033
- Table 29: China Solar-Powered Vehicle Industry Revenue (Million) Forecast, by Application 2020 & 2033
- Table 30: Japan Solar-Powered Vehicle Industry Revenue (Million) Forecast, by Application 2020 & 2033
- Table 31: India Solar-Powered Vehicle Industry Revenue (Million) Forecast, by Application 2020 & 2033
- Table 32: Rest of Asia Pacific Solar-Powered Vehicle Industry Revenue (Million) Forecast, by Application 2020 & 2033
- Table 33: Global Solar-Powered Vehicle Industry Revenue Million Forecast, by Vehicle Type 2020 & 2033
- Table 34: Global Solar-Powered Vehicle Industry Revenue Million Forecast, by Electric Vehicle Type 2020 & 2033
- Table 35: Global Solar-Powered Vehicle Industry Revenue Million Forecast, by Battery Type 2020 & 2033
- Table 36: Global Solar-Powered Vehicle Industry Revenue Million Forecast, by Solar Panel Type 2020 & 2033
- Table 37: Global Solar-Powered Vehicle Industry Revenue Million Forecast, by Country 2020 & 2033
- Table 38: Brazil Solar-Powered Vehicle Industry Revenue (Million) Forecast, by Application 2020 & 2033
- Table 39: United Arab Emirates Solar-Powered Vehicle Industry Revenue (Million) Forecast, by Application 2020 & 2033
- Table 40: Other Countries Solar-Powered Vehicle Industry Revenue (Million) Forecast, by Application 2020 & 2033
Frequently Asked Questions
1. What is the projected Compound Annual Growth Rate (CAGR) of the Solar-Powered Vehicle Industry?
The projected CAGR is approximately 18.00%.
2. Which companies are prominent players in the Solar-Powered Vehicle Industry?
Key companies in the market include The Solar Electric Vehicle Company, Venturi Automobiles, Fiat Chrysler Automobiles, Hanergy, Lightyear, Toyota Motor Corporation, Mahindra Electric Mobility Limite, Sono Motors, America Cruise Car, Ford Motor Company.
3. What are the main segments of the Solar-Powered Vehicle Industry?
The market segments include Vehicle Type, Electric Vehicle Type, Battery Type, Solar Panel Type.
4. Can you provide details about the market size?
The market size is estimated to be USD XX Million as of 2022.
5. What are some drivers contributing to market growth?
Increasing disposable income and Low-interest rates from lenders increase the market demand.
6. What are the notable trends driving market growth?
Stringent Vehicle Emission Norms and Regulations are Driving the Demand for Hybrid Vehicles.
7. Are there any restraints impacting market growth?
High initial costs may obstruct the growth.
8. Can you provide examples of recent developments in the market?
In November 2021, Aptera has extenede their world's first commercial solar vehicle of alpha testing has introduced three new options in exteriror (Black, White and Silver) and interior (Vida, Coast and Codex). Company has started working on Beta vehicles to optimize aerodynamcis and efficiency along with bigger cabin size.
9. What pricing options are available for accessing the report?
Pricing options include single-user, multi-user, and enterprise licenses priced at USD 4750, USD 5250, and USD 8750 respectively.
10. Is the market size provided in terms of value or volume?
The market size is provided in terms of value, measured in Million.
11. Are there any specific market keywords associated with the report?
Yes, the market keyword associated with the report is "Solar-Powered Vehicle Industry," which aids in identifying and referencing the specific market segment covered.
12. How do I determine which pricing option suits my needs best?
The pricing options vary based on user requirements and access needs. Individual users may opt for single-user licenses, while businesses requiring broader access may choose multi-user or enterprise licenses for cost-effective access to the report.
13. Are there any additional resources or data provided in the Solar-Powered Vehicle Industry report?
While the report offers comprehensive insights, it's advisable to review the specific contents or supplementary materials provided to ascertain if additional resources or data are available.
14. How can I stay updated on further developments or reports in the Solar-Powered Vehicle Industry?
To stay informed about further developments, trends, and reports in the Solar-Powered Vehicle Industry, consider subscribing to industry newsletters, following relevant companies and organizations, or regularly checking reputable industry news sources and publications.
Methodology
Step 1 - Identification of Relevant Samples Size from Population Database


Step 2 - Approaches for Defining Global Market Size (Value, Volume* & Price*)

Note*: In applicable scenarios
Step 3 - Data Sources
Primary Research
- Web Analytics
- Survey Reports
- Research Institute
- Latest Research Reports
- Opinion Leaders
Secondary Research
- Annual Reports
- White Paper
- Latest Press Release
- Industry Association
- Paid Database
- Investor Presentations

Step 4 - Data Triangulation
Involves using different sources of information in order to increase the validity of a study
These sources are likely to be stakeholders in a program - participants, other researchers, program staff, other community members, and so on.
Then we put all data in single framework & apply various statistical tools to find out the dynamic on the market.
During the analysis stage, feedback from the stakeholder groups would be compared to determine areas of agreement as well as areas of divergence