


Key Insights
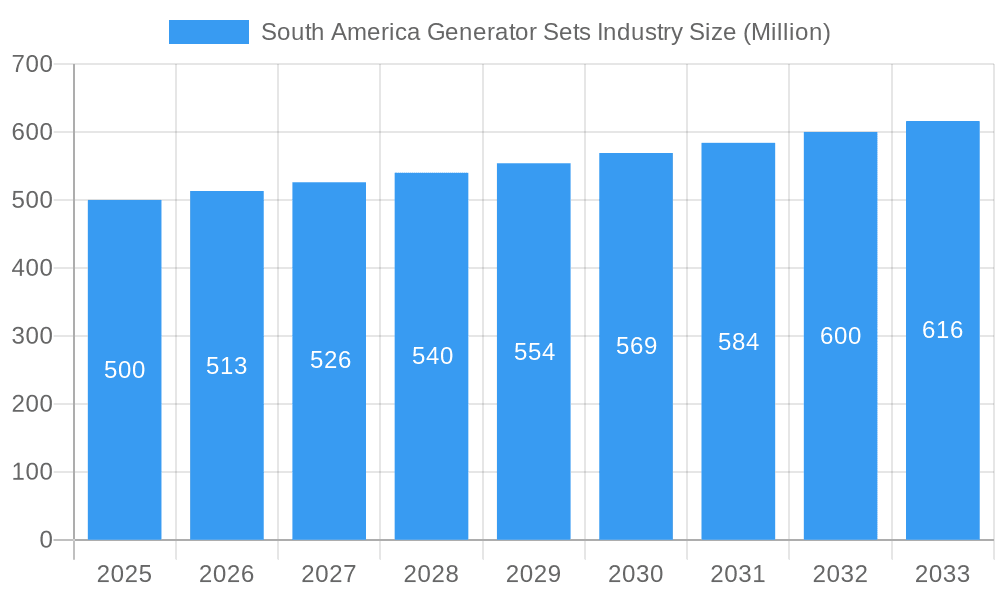
The South American generator sets market is projected for significant growth, estimated at 44.6 billion in 2024, with a Compound Annual Growth Rate (CAGR) of 7.4% from 2025 to 2033. Key drivers include industrialization and urbanization in Brazil and Argentina, increasing demand for reliable backup power. The expansion of renewable energy sources, especially in remote regions, necessitates generator sets for grid stabilization and off-grid solutions. Growth in the commercial sector and rising residential power reliability needs also contribute to market expansion. However, fluctuating fuel prices and stringent emission regulations pose potential restraints. The market is segmented by fuel type (diesel, natural gas, others) and end-user (residential, commercial, industrial). Diesel currently leads due to availability, but natural gas is gaining traction for its cost-efficiency and environmental benefits. The industrial sector holds the largest share, driven by critical power needs in manufacturing. Leading players include Deere & Company, Kohler Co, and Caterpillar Inc, focusing on technological advancements and strategic partnerships.
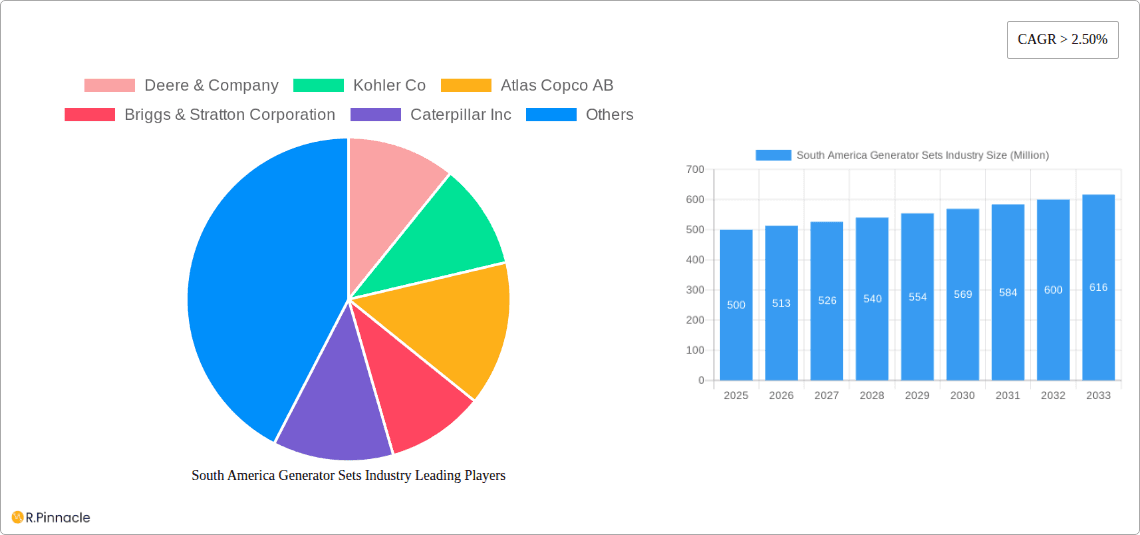
South America Generator Sets Industry Market Size (In Billion)

Lucrative opportunities exist for market participants. Continued economic growth in Brazil and Argentina, alongside government infrastructure and energy access initiatives, will catalyze growth. Companies are prioritizing fuel-efficient and environmentally friendly generator sets to meet evolving demands and regulatory compliance. Market segmentation allows for targeted strategies. Strategic partnerships and technological innovations, such as hybrid systems and smart energy management, will shape the competitive landscape and drive future expansion. The forecast period (2025-2033) anticipates increased demand, particularly in commercial and industrial segments, driven by escalating energy requirements and the imperative for reliable power supply.
South America Generator Sets Industry Company Market Share
South America Generator Sets Industry Report: Market Analysis and Forecast (2019-2033)
This comprehensive report offers in-depth analysis of the South America generator sets industry, providing essential insights for industry professionals, investors, and strategic decision-makers. Analyzing the period from 2019 to 2033, with a base year of 2024 and a forecast period of 2025-2033, this report details market dynamics, trends, and future potential. The historical analysis covers 2019-2024. The market size is projected to reach 44.6 billion by 2024.
South America Generator Sets Industry Market Structure & Innovation Trends
This section analyzes the competitive landscape of the South American generator sets market, encompassing market concentration, innovation drivers, regulatory frameworks, and M&A activities. We delve into the market share held by key players such as Deere & Company, Kohler Co, Atlas Copco AB, Briggs & Stratton Corporation, Caterpillar Inc, Cummins Inc, Himoinsa (Yanmar Co Ltd), PR INDUSTRIAL srl (PRAMAC), Generac Holdings Inc, and Aggreko plc. The report will quantify the market share of these companies and analyze the impact of mergers and acquisitions (M&A) on market dynamics, including deal values where data is available. The analysis will also examine the influence of regulatory frameworks, the presence of substitute products, end-user demographics (Residential, Commercial, and Industrial), and the innovation drivers shaping the industry's evolution. Expect detailed breakdowns of market concentration metrics and analysis of M&A activity over the historical period. The report will also explore the influence of government policies and regulations, the role of technological innovation, and the impact of substitute technologies.
South America Generator Sets Industry Market Dynamics & Trends
This section explores the key factors influencing the growth trajectory of the South American generator sets market. We will analyze market growth drivers, including infrastructure development, industrial expansion, and the rising demand for reliable power in both urban and rural areas. Technological disruptions like the adoption of advanced fuel technologies and digitalization will also be examined. The impact of changing consumer preferences on generator set features, such as efficiency, noise levels, and environmental impact will be assessed. Furthermore, this report will analyze the competitive dynamics including market share shifts, product differentiation strategies, and pricing dynamics. Specific metrics such as the Compound Annual Growth Rate (CAGR) and market penetration rates will be provided, offering a quantitative understanding of market trends.
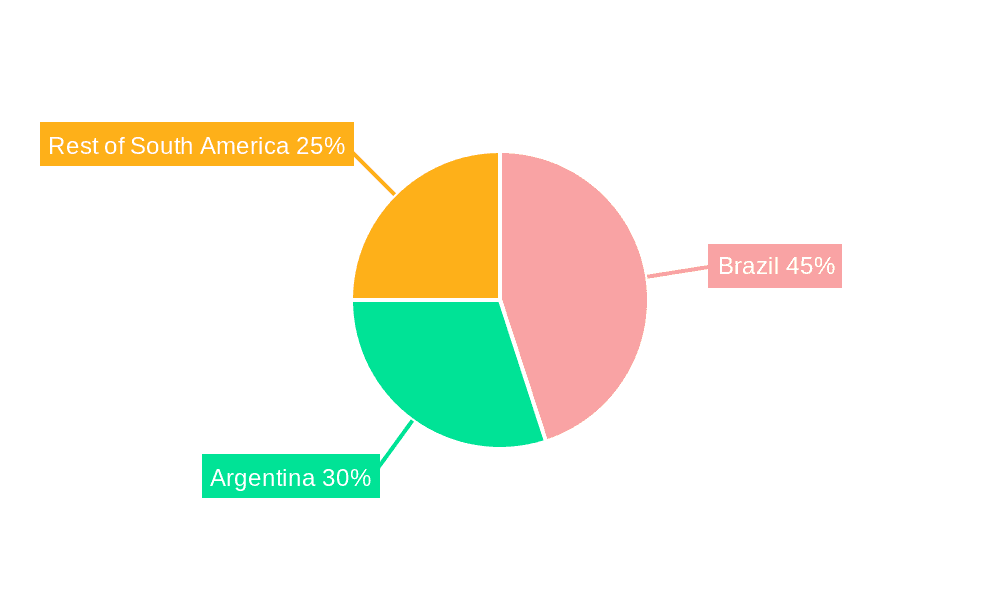
Dominant Regions & Segments in South America Generator Sets Industry
This section identifies the leading regions and segments within the South American generator sets market, categorized by fuel type (Diesel, Natural Gas, Others) and end-user (Residential, Commercial, Industrial). The analysis will pinpoint the dominant region(s) and country(ies), providing a detailed explanation of their market dominance. We will utilize bullet points to showcase key drivers like economic policies, infrastructure development, and regulatory frameworks driving segment growth and regional dominance. For instance, the strong industrial sector in a specific country may drive high demand for industrial generator sets. Similarly, favorable government policies encouraging renewable energy adoption might influence the growth of natural gas generator sets.
- Key Drivers for Dominant Regions/Segments: (Examples will be populated based on data analysis)
- Robust industrial growth.
- Favorable government policies promoting energy infrastructure development.
- High prevalence of power outages.
- Increasing adoption of renewable energy sources.
- Development of large-scale infrastructure projects.
South America Generator Sets Industry Product Innovations
This section summarizes recent product developments, highlighting key technological trends and their impact on market competitiveness. We will discuss new applications for generator sets, their competitive advantages (e.g., enhanced efficiency, reduced emissions, improved durability) and how these innovations address specific market needs. The emphasis will be on technological advancements improving performance, reliability, and environmental sustainability.
Report Scope & Segmentation Analysis
This section details the scope of the report and provides a comprehensive overview of the market segmentation by fuel type (Diesel, Natural Gas, Others) and end-user (Residential, Commercial, Industrial). We provide growth projections, market sizes for each segment, and analysis of competitive dynamics within each segment. Each segment will have a dedicated paragraph providing a detailed analysis.
- Diesel Generators: [Description of market size, growth projections, and competitive dynamics]
- Natural Gas Generators: [Description of market size, growth projections, and competitive dynamics]
- Other Generators: [Description of market size, growth projections, and competitive dynamics]
- Residential Generators: [Description of market size, growth projections, and competitive dynamics]
- Commercial Generators: [Description of market size, growth projections, and competitive dynamics]
- Industrial Generators: [Description of market size, growth projections, and competitive dynamics]
Key Drivers of South America Generator Sets Industry Growth
This section identifies and analyzes the key factors driving growth in the South American generator sets industry. Factors such as increasing energy demand, infrastructure development, government initiatives, and technological advancements will be discussed with specific examples. This analysis will focus on technological advancements, economic factors, and regulatory changes influencing market expansion.
Challenges in the South America Generator Sets Industry Sector
This section outlines the key challenges facing the South American generator sets industry. We will examine regulatory hurdles, supply chain disruptions, intense competition, and economic uncertainties, quantifying their impact on market growth and profitability.
Emerging Opportunities in South America Generator Sets Industry
This section highlights emerging trends and opportunities for growth in the South American generator sets market. This includes the potential for expansion into new markets, adoption of new technologies, and shifts in consumer preferences creating new avenues for growth.
Leading Players in the South America Generator Sets Industry Market
Key Developments in South America Generator Sets Industry Industry
- September 2022: Zeittec, a Brazilian firm, equipped its data center with generators to ensure operational consistency during power outages. This highlights the increasing reliance on backup power solutions for critical infrastructure. The project, completed in three months for Sebrae-PR (Brazilian Micro and Small Business Support Service) in Curitiba, showcases the rapid deployment capabilities required in this sector.
Future Outlook for South America Generator Sets Industry Market
This section summarizes the growth accelerators and opportunities expected in the South American generator sets market during the forecast period. The analysis emphasizes the long-term market potential and strategic opportunities for companies operating in this dynamic industry. We will examine the potential for continued growth driven by factors previously identified.
South America Generator Sets Industry Segmentation
-
1. Fuel Type
- 1.1. Diesel
- 1.2. Natural Gas
- 1.3. Others
-
2. End-User
- 2.1. Residential
- 2.2. Commercial
- 2.3. Industrial
-
3. Geography
- 3.1. Brazil
- 3.2. Argentina
- 3.3. Chile
- 3.4. Rest of the South America
South America Generator Sets Industry Segmentation By Geography
- 1. Brazil
- 2. Argentina
- 3. Chile
- 4. Rest of the South America
South America Generator Sets Industry Regional Market Share
Geographic Coverage of South America Generator Sets Industry
South America Generator Sets Industry REPORT HIGHLIGHTS
| Aspects | Details |
|---|---|
| Study Period | 2020-2034 |
| Base Year | 2025 |
| Estimated Year | 2026 |
| Forecast Period | 2026-2034 |
| Historical Period | 2020-2025 |
| Growth Rate | CAGR of 7.4% from 2020-2034 |
| Segmentation |
|
Table of Contents
- 1. Introduction
- 1.1. Research Scope
- 1.2. Market Segmentation
- 1.3. Research Methodology
- 1.4. Definitions and Assumptions
- 2. Executive Summary
- 2.1. Introduction
- 3. Market Dynamics
- 3.1. Introduction
- 3.2. Market Drivers
- 3.2.1. 4.; Reduction in Energy Bills Due to Self-Power Consumption4.; Increasing Installation of Solar PV Modules in Residential Segment
- 3.3. Market Restrains
- 3.3.1. 4.; High Installation Cost as Compared to Rooftop PV Systems
- 3.4. Market Trends
- 3.4.1. Diesel Segment Expected to Dominate the Market
- 4. Market Factor Analysis
- 4.1. Porters Five Forces
- 4.2. Supply/Value Chain
- 4.3. PESTEL analysis
- 4.4. Market Entropy
- 4.5. Patent/Trademark Analysis
- 5. South America Generator Sets Industry Analysis, Insights and Forecast, 2020-2032
- 5.1. Market Analysis, Insights and Forecast - by Fuel Type
- 5.1.1. Diesel
- 5.1.2. Natural Gas
- 5.1.3. Others
- 5.2. Market Analysis, Insights and Forecast - by End-User
- 5.2.1. Residential
- 5.2.2. Commercial
- 5.2.3. Industrial
- 5.3. Market Analysis, Insights and Forecast - by Geography
- 5.3.1. Brazil
- 5.3.2. Argentina
- 5.3.3. Chile
- 5.3.4. Rest of the South America
- 5.4. Market Analysis, Insights and Forecast - by Region
- 5.4.1. Brazil
- 5.4.2. Argentina
- 5.4.3. Chile
- 5.4.4. Rest of the South America
- 5.1. Market Analysis, Insights and Forecast - by Fuel Type
- 6. Brazil South America Generator Sets Industry Analysis, Insights and Forecast, 2020-2032
- 6.1. Market Analysis, Insights and Forecast - by Fuel Type
- 6.1.1. Diesel
- 6.1.2. Natural Gas
- 6.1.3. Others
- 6.2. Market Analysis, Insights and Forecast - by End-User
- 6.2.1. Residential
- 6.2.2. Commercial
- 6.2.3. Industrial
- 6.3. Market Analysis, Insights and Forecast - by Geography
- 6.3.1. Brazil
- 6.3.2. Argentina
- 6.3.3. Chile
- 6.3.4. Rest of the South America
- 6.1. Market Analysis, Insights and Forecast - by Fuel Type
- 7. Argentina South America Generator Sets Industry Analysis, Insights and Forecast, 2020-2032
- 7.1. Market Analysis, Insights and Forecast - by Fuel Type
- 7.1.1. Diesel
- 7.1.2. Natural Gas
- 7.1.3. Others
- 7.2. Market Analysis, Insights and Forecast - by End-User
- 7.2.1. Residential
- 7.2.2. Commercial
- 7.2.3. Industrial
- 7.3. Market Analysis, Insights and Forecast - by Geography
- 7.3.1. Brazil
- 7.3.2. Argentina
- 7.3.3. Chile
- 7.3.4. Rest of the South America
- 7.1. Market Analysis, Insights and Forecast - by Fuel Type
- 8. Chile South America Generator Sets Industry Analysis, Insights and Forecast, 2020-2032
- 8.1. Market Analysis, Insights and Forecast - by Fuel Type
- 8.1.1. Diesel
- 8.1.2. Natural Gas
- 8.1.3. Others
- 8.2. Market Analysis, Insights and Forecast - by End-User
- 8.2.1. Residential
- 8.2.2. Commercial
- 8.2.3. Industrial
- 8.3. Market Analysis, Insights and Forecast - by Geography
- 8.3.1. Brazil
- 8.3.2. Argentina
- 8.3.3. Chile
- 8.3.4. Rest of the South America
- 8.1. Market Analysis, Insights and Forecast - by Fuel Type
- 9. Rest of the South America South America Generator Sets Industry Analysis, Insights and Forecast, 2020-2032
- 9.1. Market Analysis, Insights and Forecast - by Fuel Type
- 9.1.1. Diesel
- 9.1.2. Natural Gas
- 9.1.3. Others
- 9.2. Market Analysis, Insights and Forecast - by End-User
- 9.2.1. Residential
- 9.2.2. Commercial
- 9.2.3. Industrial
- 9.3. Market Analysis, Insights and Forecast - by Geography
- 9.3.1. Brazil
- 9.3.2. Argentina
- 9.3.3. Chile
- 9.3.4. Rest of the South America
- 9.1. Market Analysis, Insights and Forecast - by Fuel Type
- 10. Competitive Analysis
- 10.1. Market Share Analysis 2025
- 10.2. Company Profiles
- 10.2.1 Deere & Company
- 10.2.1.1. Overview
- 10.2.1.2. Products
- 10.2.1.3. SWOT Analysis
- 10.2.1.4. Recent Developments
- 10.2.1.5. Financials (Based on Availability)
- 10.2.2 Kohler Co
- 10.2.2.1. Overview
- 10.2.2.2. Products
- 10.2.2.3. SWOT Analysis
- 10.2.2.4. Recent Developments
- 10.2.2.5. Financials (Based on Availability)
- 10.2.3 Atlas Copco AB
- 10.2.3.1. Overview
- 10.2.3.2. Products
- 10.2.3.3. SWOT Analysis
- 10.2.3.4. Recent Developments
- 10.2.3.5. Financials (Based on Availability)
- 10.2.4 Briggs & Stratton Corporation
- 10.2.4.1. Overview
- 10.2.4.2. Products
- 10.2.4.3. SWOT Analysis
- 10.2.4.4. Recent Developments
- 10.2.4.5. Financials (Based on Availability)
- 10.2.5 Caterpillar Inc
- 10.2.5.1. Overview
- 10.2.5.2. Products
- 10.2.5.3. SWOT Analysis
- 10.2.5.4. Recent Developments
- 10.2.5.5. Financials (Based on Availability)
- 10.2.6 Cummins Inc
- 10.2.6.1. Overview
- 10.2.6.2. Products
- 10.2.6.3. SWOT Analysis
- 10.2.6.4. Recent Developments
- 10.2.6.5. Financials (Based on Availability)
- 10.2.7 Himoinsa (Yanmar Co Ltd )
- 10.2.7.1. Overview
- 10.2.7.2. Products
- 10.2.7.3. SWOT Analysis
- 10.2.7.4. Recent Developments
- 10.2.7.5. Financials (Based on Availability)
- 10.2.8 PR INDUSTRIAL srl (PRAMAC)
- 10.2.8.1. Overview
- 10.2.8.2. Products
- 10.2.8.3. SWOT Analysis
- 10.2.8.4. Recent Developments
- 10.2.8.5. Financials (Based on Availability)
- 10.2.9 Generac Holdings Inc
- 10.2.9.1. Overview
- 10.2.9.2. Products
- 10.2.9.3. SWOT Analysis
- 10.2.9.4. Recent Developments
- 10.2.9.5. Financials (Based on Availability)
- 10.2.10 Aggreko plc
- 10.2.10.1. Overview
- 10.2.10.2. Products
- 10.2.10.3. SWOT Analysis
- 10.2.10.4. Recent Developments
- 10.2.10.5. Financials (Based on Availability)
- 10.2.1 Deere & Company
List of Figures
- Figure 1: South America Generator Sets Industry Revenue Breakdown (billion, %) by Product 2025 & 2033
- Figure 2: South America Generator Sets Industry Share (%) by Company 2025
List of Tables
- Table 1: South America Generator Sets Industry Revenue billion Forecast, by Fuel Type 2020 & 2033
- Table 2: South America Generator Sets Industry Volume K Unit Forecast, by Fuel Type 2020 & 2033
- Table 3: South America Generator Sets Industry Revenue billion Forecast, by End-User 2020 & 2033
- Table 4: South America Generator Sets Industry Volume K Unit Forecast, by End-User 2020 & 2033
- Table 5: South America Generator Sets Industry Revenue billion Forecast, by Geography 2020 & 2033
- Table 6: South America Generator Sets Industry Volume K Unit Forecast, by Geography 2020 & 2033
- Table 7: South America Generator Sets Industry Revenue billion Forecast, by Region 2020 & 2033
- Table 8: South America Generator Sets Industry Volume K Unit Forecast, by Region 2020 & 2033
- Table 9: South America Generator Sets Industry Revenue billion Forecast, by Fuel Type 2020 & 2033
- Table 10: South America Generator Sets Industry Volume K Unit Forecast, by Fuel Type 2020 & 2033
- Table 11: South America Generator Sets Industry Revenue billion Forecast, by End-User 2020 & 2033
- Table 12: South America Generator Sets Industry Volume K Unit Forecast, by End-User 2020 & 2033
- Table 13: South America Generator Sets Industry Revenue billion Forecast, by Geography 2020 & 2033
- Table 14: South America Generator Sets Industry Volume K Unit Forecast, by Geography 2020 & 2033
- Table 15: South America Generator Sets Industry Revenue billion Forecast, by Country 2020 & 2033
- Table 16: South America Generator Sets Industry Volume K Unit Forecast, by Country 2020 & 2033
- Table 17: South America Generator Sets Industry Revenue billion Forecast, by Fuel Type 2020 & 2033
- Table 18: South America Generator Sets Industry Volume K Unit Forecast, by Fuel Type 2020 & 2033
- Table 19: South America Generator Sets Industry Revenue billion Forecast, by End-User 2020 & 2033
- Table 20: South America Generator Sets Industry Volume K Unit Forecast, by End-User 2020 & 2033
- Table 21: South America Generator Sets Industry Revenue billion Forecast, by Geography 2020 & 2033
- Table 22: South America Generator Sets Industry Volume K Unit Forecast, by Geography 2020 & 2033
- Table 23: South America Generator Sets Industry Revenue billion Forecast, by Country 2020 & 2033
- Table 24: South America Generator Sets Industry Volume K Unit Forecast, by Country 2020 & 2033
- Table 25: South America Generator Sets Industry Revenue billion Forecast, by Fuel Type 2020 & 2033
- Table 26: South America Generator Sets Industry Volume K Unit Forecast, by Fuel Type 2020 & 2033
- Table 27: South America Generator Sets Industry Revenue billion Forecast, by End-User 2020 & 2033
- Table 28: South America Generator Sets Industry Volume K Unit Forecast, by End-User 2020 & 2033
- Table 29: South America Generator Sets Industry Revenue billion Forecast, by Geography 2020 & 2033
- Table 30: South America Generator Sets Industry Volume K Unit Forecast, by Geography 2020 & 2033
- Table 31: South America Generator Sets Industry Revenue billion Forecast, by Country 2020 & 2033
- Table 32: South America Generator Sets Industry Volume K Unit Forecast, by Country 2020 & 2033
- Table 33: South America Generator Sets Industry Revenue billion Forecast, by Fuel Type 2020 & 2033
- Table 34: South America Generator Sets Industry Volume K Unit Forecast, by Fuel Type 2020 & 2033
- Table 35: South America Generator Sets Industry Revenue billion Forecast, by End-User 2020 & 2033
- Table 36: South America Generator Sets Industry Volume K Unit Forecast, by End-User 2020 & 2033
- Table 37: South America Generator Sets Industry Revenue billion Forecast, by Geography 2020 & 2033
- Table 38: South America Generator Sets Industry Volume K Unit Forecast, by Geography 2020 & 2033
- Table 39: South America Generator Sets Industry Revenue billion Forecast, by Country 2020 & 2033
- Table 40: South America Generator Sets Industry Volume K Unit Forecast, by Country 2020 & 2033
Frequently Asked Questions
1. What is the projected Compound Annual Growth Rate (CAGR) of the South America Generator Sets Industry?
The projected CAGR is approximately 7.4%.
2. Which companies are prominent players in the South America Generator Sets Industry?
Key companies in the market include Deere & Company, Kohler Co, Atlas Copco AB, Briggs & Stratton Corporation, Caterpillar Inc, Cummins Inc, Himoinsa (Yanmar Co Ltd ), PR INDUSTRIAL srl (PRAMAC), Generac Holdings Inc, Aggreko plc.
3. What are the main segments of the South America Generator Sets Industry?
The market segments include Fuel Type, End-User, Geography.
4. Can you provide details about the market size?
The market size is estimated to be USD 44.6 billion as of 2022.
5. What are some drivers contributing to market growth?
4.; Reduction in Energy Bills Due to Self-Power Consumption4.; Increasing Installation of Solar PV Modules in Residential Segment.
6. What are the notable trends driving market growth?
Diesel Segment Expected to Dominate the Market.
7. Are there any restraints impacting market growth?
4.; High Installation Cost as Compared to Rooftop PV Systems.
8. Can you provide examples of recent developments in the market?
September 2022: Zeittec, a Brazilian firm, equipped its data center with generators to avoid downtime in case of blackouts to maintain consistency in the operational process during failures. The data center was built in three months for Sebrae-PR, the Brazilian Micro and Small Business Support Service in Curitiba.
9. What pricing options are available for accessing the report?
Pricing options include single-user, multi-user, and enterprise licenses priced at USD 4750, USD 5250, and USD 8750 respectively.
10. Is the market size provided in terms of value or volume?
The market size is provided in terms of value, measured in billion and volume, measured in K Unit.
11. Are there any specific market keywords associated with the report?
Yes, the market keyword associated with the report is "South America Generator Sets Industry," which aids in identifying and referencing the specific market segment covered.
12. How do I determine which pricing option suits my needs best?
The pricing options vary based on user requirements and access needs. Individual users may opt for single-user licenses, while businesses requiring broader access may choose multi-user or enterprise licenses for cost-effective access to the report.
13. Are there any additional resources or data provided in the South America Generator Sets Industry report?
While the report offers comprehensive insights, it's advisable to review the specific contents or supplementary materials provided to ascertain if additional resources or data are available.
14. How can I stay updated on further developments or reports in the South America Generator Sets Industry?
To stay informed about further developments, trends, and reports in the South America Generator Sets Industry, consider subscribing to industry newsletters, following relevant companies and organizations, or regularly checking reputable industry news sources and publications.
Methodology
Step 1 - Identification of Relevant Samples Size from Population Database


Step 2 - Approaches for Defining Global Market Size (Value, Volume* & Price*)

Note*: In applicable scenarios
Step 3 - Data Sources
Primary Research
- Web Analytics
- Survey Reports
- Research Institute
- Latest Research Reports
- Opinion Leaders
Secondary Research
- Annual Reports
- White Paper
- Latest Press Release
- Industry Association
- Paid Database
- Investor Presentations

Step 4 - Data Triangulation
Involves using different sources of information in order to increase the validity of a study
These sources are likely to be stakeholders in a program - participants, other researchers, program staff, other community members, and so on.
Then we put all data in single framework & apply various statistical tools to find out the dynamic on the market.
During the analysis stage, feedback from the stakeholder groups would be compared to determine areas of agreement as well as areas of divergence