
Key Insights
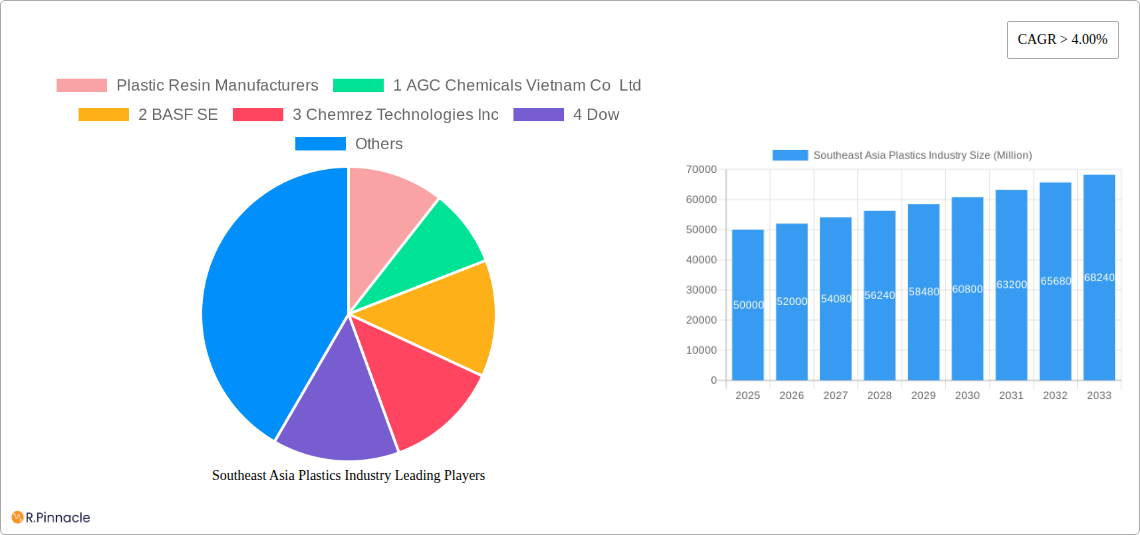
The Southeast Asia plastics industry is experiencing robust growth, driven by factors such as increasing population, rapid urbanization, rising disposable incomes, and expanding manufacturing sectors. The industry's Compound Annual Growth Rate (CAGR) exceeding 4% from 2019 to 2024 suggests a significant market expansion. This growth is fueled by the burgeoning demand for plastic products across various applications, including packaging, construction, automotive, and consumer goods. Key regional players like Vietnam, Thailand, and Indonesia are significant contributors to this expansion, leveraging their manufacturing capabilities and strategic geographical locations. However, the industry also faces challenges, including environmental concerns related to plastic waste management and fluctuating raw material prices. Sustainable initiatives, such as increased recycling rates and the adoption of bio-plastics, are gaining momentum, presenting both opportunities and challenges for industry participants. The market segmentation, comprising plastic resin manufacturers and plastic product manufacturers, showcases a complex value chain with substantial interdependencies. Major players are investing in advanced technologies and expanding their production capacities to meet the escalating demand, while simultaneously focusing on environmentally friendly solutions to address sustainability concerns. The forecast period of 2025-2033 indicates continued expansion, albeit potentially at a slightly moderated pace compared to the preceding years, as the industry matures and faces the need to balance growth with sustainability.
The competitive landscape is characterized by both large multinational corporations and regional players. Established companies like BASF, Dow, and DuPont contribute significantly to the resin manufacturing segment, while numerous local players dominate the plastic product manufacturing space. These companies are strategically adapting their business models, adopting circular economy practices, and investing in research and development to develop innovative and sustainable plastic solutions. The future success of industry participants hinges on their ability to balance profitability with environmental responsibility, addressing the growing consumer and regulatory pressure for sustainable practices. The regional distribution of market share likely reflects the varying levels of economic development, industrial infrastructure, and consumer demand across Southeast Asia. Further detailed regional analysis would provide a more nuanced understanding of market dynamics. The overall market size in 2025 is estimated to be in the billions of dollars, reflecting the significant scale of the industry.
This comprehensive report provides an in-depth analysis of the Southeast Asia plastics industry, offering invaluable insights for industry professionals, investors, and strategic decision-makers. Covering the period 2019-2033, with a base year of 2025, this report unveils the market's structure, dynamics, key players, and future outlook. Expect detailed data, including market size (in Millions), CAGR, and insightful projections to 2033.
Southeast Asia Plastics Industry Market Structure & Innovation Trends
This section analyzes the competitive landscape of the Southeast Asia plastics industry, exploring market concentration, innovation drivers, regulatory frameworks, and M&A activities. We delve into the interplay of various factors shaping the industry's structure and future trajectory.
Market Concentration: The report assesses the market share held by major players like Dow, BASF SE, and others, providing a clear picture of market dominance and competitiveness. We estimate a market concentration ratio (xx) based on the top 5 players in 2025.
Innovation Drivers: The analysis identifies key innovation drivers, such as advancements in polymer technology, sustainable materials, and circular economy initiatives. Specific examples and their market impact will be provided.
Regulatory Landscape: We examine relevant regulations and policies influencing the industry, including those related to plastic waste management, environmental protection, and product safety.
Product Substitutes: This section explores emerging substitutes for traditional plastics, such as bioplastics and other sustainable alternatives. We analyze their market penetration and potential impact on the industry.
End-User Demographics: We analyze the end-use sectors driving demand for plastics, assessing their growth potential and impact on market segmentation.
Mergers & Acquisitions (M&A): The report analyzes recent M&A activities in the Southeast Asia plastics industry, quantifying deal values (in Millions) where data is available and assessing their implications for market consolidation and competitiveness. We project xx Million in M&A activity for 2026-2028.
Southeast Asia Plastics Industry Market Dynamics & Trends
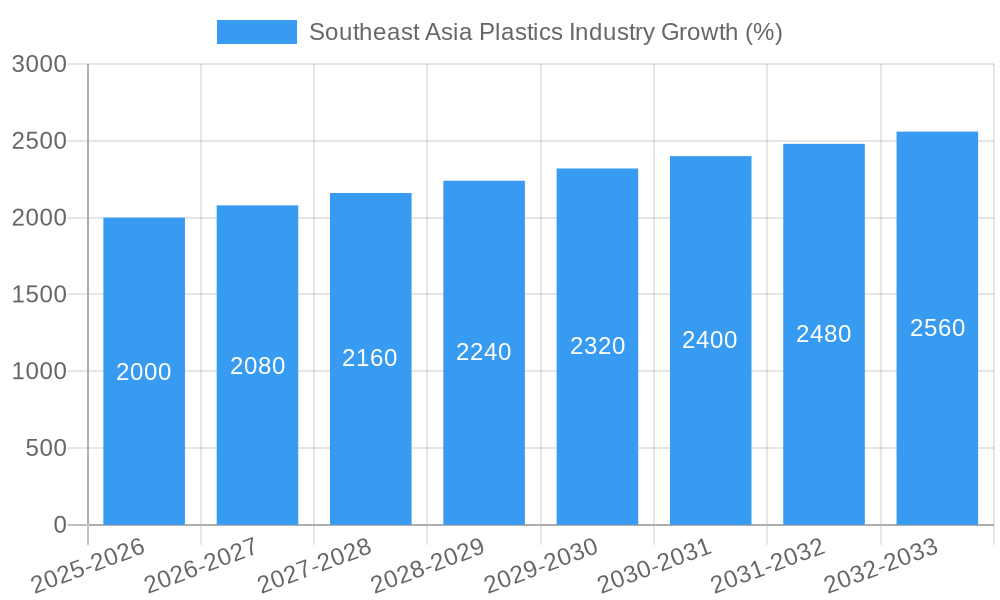
This section provides a comprehensive analysis of market dynamics, including growth drivers, technological disruptions, consumer preferences, and competitive dynamics. The detailed analysis incorporates key performance indicators (KPIs) such as CAGR and market penetration rates. We project a CAGR of xx% for the forecast period (2025-2033). Factors influencing growth will be examined, including increasing demand from packaging, construction, and automotive industries; alongside the challenges of plastic waste management and environmental concerns. The report will quantify the impact of these factors on market growth.
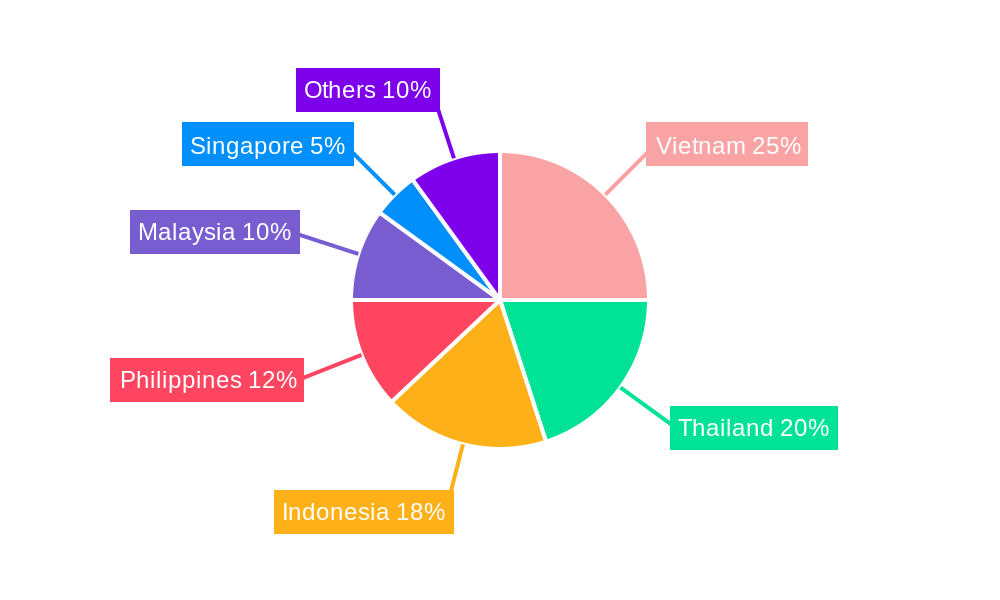
Dominant Regions & Segments in Southeast Asia Plastics Industry
This section identifies the leading regions, countries, and segments within the Southeast Asia plastics industry. A detailed analysis is provided, highlighting factors such as economic policies, infrastructure development, and consumer demand influencing dominance.
- Key Drivers of Dominance:
- Rapid economic growth in certain Southeast Asian countries.
- Increasing industrialization and manufacturing activities.
- Growth of key end-use sectors.
- Government initiatives promoting infrastructure development.
Southeast Asia Plastics Industry Product Innovations
This section summarizes recent product developments, applications, and competitive advantages in the Southeast Asia plastics industry. The analysis emphasizes technological trends, focusing on advancements in materials science, processing technologies, and sustainable plastic solutions designed for specific market needs.
Report Scope & Segmentation Analysis
This report segments the Southeast Asia plastics industry based on resin type, product type, application, and geography. Each segment's growth projections, market size (in Millions), and competitive dynamics are detailed in separate paragraphs. We provide market size estimates (in Millions) for each segment for the base year (2025) and forecast period (2025-2033).
Key Drivers of Southeast Asia Plastics Industry Growth
This section identifies and analyzes the key factors driving the growth of the Southeast Asia plastics industry. The analysis incorporates economic, technological, and regulatory factors, backed by concrete examples and data. We highlight the strong correlation between GDP growth and plastic demand, as well as the growing adoption of innovative technologies for plastic production and recycling.
Challenges in the Southeast Asia Plastics Industry Sector
This section explores the challenges confronting the Southeast Asia plastics industry, including regulatory hurdles, supply chain complexities, and intense competition. Quantifiable impacts of these challenges on market growth and profitability are provided. We examine the impact of fluctuating raw material prices and potential supply disruptions, along with the increasing pressure to adopt sustainable practices.
Emerging Opportunities in Southeast Asia Plastics Industry
This section outlines emerging trends and opportunities in the Southeast Asia plastics industry. The analysis emphasizes new markets, technological advancements, and changing consumer preferences creating new avenues for growth and innovation.
Leading Players in the Southeast Asia Plastics Industry Market
This section profiles key players in the Southeast Asia plastics industry, including both plastic resin manufacturers and plastic product manufacturers. Where available, links to company websites are provided.
Plastic Resin Manufacturers:
- AGC Chemicals Vietnam Co Ltd
- BASF SE
- Chemrez Technologies Inc
- Dow
- DuPont
- JG Summit Petrochemical Corporation
- LyondellBasell Industries Holdings B V
- Nan Ya Plastics Corporation (Formosa)
- NPC Alliance Corporation
- Petron Corporation
- Philippine Resins Industries Inc
Plastic Product Manufacturers:
- Ampac Holdings LLC
- Bavico Ltd
- Binh Minh Plastic
- Chan Thuan Thanh Plastic Mechanical & Trading Co Ltd
- Cholon Plastic Co Ltd
- City Long (Cambodia) Co Ltd
- Duy Tan Plastics Corporation
Key Developments in Southeast Asia Plastics Industry
This section details key developments in the Southeast Asia plastics industry, including product launches, mergers, and acquisitions, with their respective dates (year/month). The analysis emphasizes the impact of these developments on market dynamics.
Future Outlook for Southeast Asia Plastics Industry Market
This section summarizes the growth accelerators expected to shape the future of the Southeast Asia plastics industry. The analysis identifies key opportunities and challenges, focusing on market potential and strategic implications for industry players. We highlight the increasing focus on sustainability and the potential for growth in specialized plastics applications.
Southeast Asia Plastics Industry Segmentation
-
1. Type
- 1.1. Traditional Plastics
- 1.2. Engineering Plastics
- 1.3. Bioplastics
-
2. Technology
- 2.1. Blow Molding
- 2.2. Extrusion
- 2.3. Injection Molding
- 2.4. Other Technologies
-
3. Application
- 3.1. Packaging
- 3.2. Electrical and Electronics
- 3.3. Building and Construction
- 3.4. Automotive and Transportation
- 3.5. Housewares
- 3.6. Furniture and Bedding
- 3.7. Other Applications
-
4. Geography
- 4.1. Indonesia
- 4.2. Thailand
- 4.3. Malaysia
- 4.4. Singapore
- 4.5. Philippines
- 4.6. Vietnam
- 4.7. Rest of South-East Asia
Southeast Asia Plastics Industry Segmentation By Geography
- 1. Indonesia
- 2. Thailand
- 3. Malaysia
- 4. Singapore
- 5. Philippines
- 6. Vietnam
- 7. Rest of South East Asia
Southeast Asia Plastics Industry REPORT HIGHLIGHTS
| Aspects | Details |
|---|---|
| Study Period | 2019-2033 |
| Base Year | 2024 |
| Estimated Year | 2025 |
| Forecast Period | 2025-2033 |
| Historical Period | 2019-2024 |
| Growth Rate | CAGR of > 4.00% from 2019-2033 |
| Segmentation |
|
Table of Contents
- 1. Introduction
- 1.1. Research Scope
- 1.2. Market Segmentation
- 1.3. Research Methodology
- 1.4. Definitions and Assumptions
- 2. Executive Summary
- 2.1. Introduction
- 3. Market Dynamics
- 3.1. Introduction
- 3.2. Market Drivers
- 3.2.1. Rising Demand from Food and Beverage Packaging; Rapid Increase in the Downstream Processing Capacity Additions; Other Drivers
- 3.3. Market Restrains
- 3.3.1. Rising Demand from Food and Beverage Packaging; Rapid Increase in the Downstream Processing Capacity Additions; Other Drivers
- 3.4. Market Trends
- 3.4.1. Injection Molding Technology to Dominate the Market
- 4. Market Factor Analysis
- 4.1. Porters Five Forces
- 4.2. Supply/Value Chain
- 4.3. PESTEL analysis
- 4.4. Market Entropy
- 4.5. Patent/Trademark Analysis
- 5. Global Southeast Asia Plastics Industry Analysis, Insights and Forecast, 2019-2031
- 5.1. Market Analysis, Insights and Forecast - by Type
- 5.1.1. Traditional Plastics
- 5.1.2. Engineering Plastics
- 5.1.3. Bioplastics
- 5.2. Market Analysis, Insights and Forecast - by Technology
- 5.2.1. Blow Molding
- 5.2.2. Extrusion
- 5.2.3. Injection Molding
- 5.2.4. Other Technologies
- 5.3. Market Analysis, Insights and Forecast - by Application
- 5.3.1. Packaging
- 5.3.2. Electrical and Electronics
- 5.3.3. Building and Construction
- 5.3.4. Automotive and Transportation
- 5.3.5. Housewares
- 5.3.6. Furniture and Bedding
- 5.3.7. Other Applications
- 5.4. Market Analysis, Insights and Forecast - by Geography
- 5.4.1. Indonesia
- 5.4.2. Thailand
- 5.4.3. Malaysia
- 5.4.4. Singapore
- 5.4.5. Philippines
- 5.4.6. Vietnam
- 5.4.7. Rest of South-East Asia
- 5.5. Market Analysis, Insights and Forecast - by Region
- 5.5.1. Indonesia
- 5.5.2. Thailand
- 5.5.3. Malaysia
- 5.5.4. Singapore
- 5.5.5. Philippines
- 5.5.6. Vietnam
- 5.5.7. Rest of South East Asia
- 5.1. Market Analysis, Insights and Forecast - by Type
- 6. Indonesia Southeast Asia Plastics Industry Analysis, Insights and Forecast, 2019-2031
- 6.1. Market Analysis, Insights and Forecast - by Type
- 6.1.1. Traditional Plastics
- 6.1.2. Engineering Plastics
- 6.1.3. Bioplastics
- 6.2. Market Analysis, Insights and Forecast - by Technology
- 6.2.1. Blow Molding
- 6.2.2. Extrusion
- 6.2.3. Injection Molding
- 6.2.4. Other Technologies
- 6.3. Market Analysis, Insights and Forecast - by Application
- 6.3.1. Packaging
- 6.3.2. Electrical and Electronics
- 6.3.3. Building and Construction
- 6.3.4. Automotive and Transportation
- 6.3.5. Housewares
- 6.3.6. Furniture and Bedding
- 6.3.7. Other Applications
- 6.4. Market Analysis, Insights and Forecast - by Geography
- 6.4.1. Indonesia
- 6.4.2. Thailand
- 6.4.3. Malaysia
- 6.4.4. Singapore
- 6.4.5. Philippines
- 6.4.6. Vietnam
- 6.4.7. Rest of South-East Asia
- 6.1. Market Analysis, Insights and Forecast - by Type
- 7. Thailand Southeast Asia Plastics Industry Analysis, Insights and Forecast, 2019-2031
- 7.1. Market Analysis, Insights and Forecast - by Type
- 7.1.1. Traditional Plastics
- 7.1.2. Engineering Plastics
- 7.1.3. Bioplastics
- 7.2. Market Analysis, Insights and Forecast - by Technology
- 7.2.1. Blow Molding
- 7.2.2. Extrusion
- 7.2.3. Injection Molding
- 7.2.4. Other Technologies
- 7.3. Market Analysis, Insights and Forecast - by Application
- 7.3.1. Packaging
- 7.3.2. Electrical and Electronics
- 7.3.3. Building and Construction
- 7.3.4. Automotive and Transportation
- 7.3.5. Housewares
- 7.3.6. Furniture and Bedding
- 7.3.7. Other Applications
- 7.4. Market Analysis, Insights and Forecast - by Geography
- 7.4.1. Indonesia
- 7.4.2. Thailand
- 7.4.3. Malaysia
- 7.4.4. Singapore
- 7.4.5. Philippines
- 7.4.6. Vietnam
- 7.4.7. Rest of South-East Asia
- 7.1. Market Analysis, Insights and Forecast - by Type
- 8. Malaysia Southeast Asia Plastics Industry Analysis, Insights and Forecast, 2019-2031
- 8.1. Market Analysis, Insights and Forecast - by Type
- 8.1.1. Traditional Plastics
- 8.1.2. Engineering Plastics
- 8.1.3. Bioplastics
- 8.2. Market Analysis, Insights and Forecast - by Technology
- 8.2.1. Blow Molding
- 8.2.2. Extrusion
- 8.2.3. Injection Molding
- 8.2.4. Other Technologies
- 8.3. Market Analysis, Insights and Forecast - by Application
- 8.3.1. Packaging
- 8.3.2. Electrical and Electronics
- 8.3.3. Building and Construction
- 8.3.4. Automotive and Transportation
- 8.3.5. Housewares
- 8.3.6. Furniture and Bedding
- 8.3.7. Other Applications
- 8.4. Market Analysis, Insights and Forecast - by Geography
- 8.4.1. Indonesia
- 8.4.2. Thailand
- 8.4.3. Malaysia
- 8.4.4. Singapore
- 8.4.5. Philippines
- 8.4.6. Vietnam
- 8.4.7. Rest of South-East Asia
- 8.1. Market Analysis, Insights and Forecast - by Type
- 9. Singapore Southeast Asia Plastics Industry Analysis, Insights and Forecast, 2019-2031
- 9.1. Market Analysis, Insights and Forecast - by Type
- 9.1.1. Traditional Plastics
- 9.1.2. Engineering Plastics
- 9.1.3. Bioplastics
- 9.2. Market Analysis, Insights and Forecast - by Technology
- 9.2.1. Blow Molding
- 9.2.2. Extrusion
- 9.2.3. Injection Molding
- 9.2.4. Other Technologies
- 9.3. Market Analysis, Insights and Forecast - by Application
- 9.3.1. Packaging
- 9.3.2. Electrical and Electronics
- 9.3.3. Building and Construction
- 9.3.4. Automotive and Transportation
- 9.3.5. Housewares
- 9.3.6. Furniture and Bedding
- 9.3.7. Other Applications
- 9.4. Market Analysis, Insights and Forecast - by Geography
- 9.4.1. Indonesia
- 9.4.2. Thailand
- 9.4.3. Malaysia
- 9.4.4. Singapore
- 9.4.5. Philippines
- 9.4.6. Vietnam
- 9.4.7. Rest of South-East Asia
- 9.1. Market Analysis, Insights and Forecast - by Type
- 10. Philippines Southeast Asia Plastics Industry Analysis, Insights and Forecast, 2019-2031
- 10.1. Market Analysis, Insights and Forecast - by Type
- 10.1.1. Traditional Plastics
- 10.1.2. Engineering Plastics
- 10.1.3. Bioplastics
- 10.2. Market Analysis, Insights and Forecast - by Technology
- 10.2.1. Blow Molding
- 10.2.2. Extrusion
- 10.2.3. Injection Molding
- 10.2.4. Other Technologies
- 10.3. Market Analysis, Insights and Forecast - by Application
- 10.3.1. Packaging
- 10.3.2. Electrical and Electronics
- 10.3.3. Building and Construction
- 10.3.4. Automotive and Transportation
- 10.3.5. Housewares
- 10.3.6. Furniture and Bedding
- 10.3.7. Other Applications
- 10.4. Market Analysis, Insights and Forecast - by Geography
- 10.4.1. Indonesia
- 10.4.2. Thailand
- 10.4.3. Malaysia
- 10.4.4. Singapore
- 10.4.5. Philippines
- 10.4.6. Vietnam
- 10.4.7. Rest of South-East Asia
- 10.1. Market Analysis, Insights and Forecast - by Type
- 11. Vietnam Southeast Asia Plastics Industry Analysis, Insights and Forecast, 2019-2031
- 11.1. Market Analysis, Insights and Forecast - by Type
- 11.1.1. Traditional Plastics
- 11.1.2. Engineering Plastics
- 11.1.3. Bioplastics
- 11.2. Market Analysis, Insights and Forecast - by Technology
- 11.2.1. Blow Molding
- 11.2.2. Extrusion
- 11.2.3. Injection Molding
- 11.2.4. Other Technologies
- 11.3. Market Analysis, Insights and Forecast - by Application
- 11.3.1. Packaging
- 11.3.2. Electrical and Electronics
- 11.3.3. Building and Construction
- 11.3.4. Automotive and Transportation
- 11.3.5. Housewares
- 11.3.6. Furniture and Bedding
- 11.3.7. Other Applications
- 11.4. Market Analysis, Insights and Forecast - by Geography
- 11.4.1. Indonesia
- 11.4.2. Thailand
- 11.4.3. Malaysia
- 11.4.4. Singapore
- 11.4.5. Philippines
- 11.4.6. Vietnam
- 11.4.7. Rest of South-East Asia
- 11.1. Market Analysis, Insights and Forecast - by Type
- 12. Rest of South East Asia Southeast Asia Plastics Industry Analysis, Insights and Forecast, 2019-2031
- 12.1. Market Analysis, Insights and Forecast - by Type
- 12.1.1. Traditional Plastics
- 12.1.2. Engineering Plastics
- 12.1.3. Bioplastics
- 12.2. Market Analysis, Insights and Forecast - by Technology
- 12.2.1. Blow Molding
- 12.2.2. Extrusion
- 12.2.3. Injection Molding
- 12.2.4. Other Technologies
- 12.3. Market Analysis, Insights and Forecast - by Application
- 12.3.1. Packaging
- 12.3.2. Electrical and Electronics
- 12.3.3. Building and Construction
- 12.3.4. Automotive and Transportation
- 12.3.5. Housewares
- 12.3.6. Furniture and Bedding
- 12.3.7. Other Applications
- 12.4. Market Analysis, Insights and Forecast - by Geography
- 12.4.1. Indonesia
- 12.4.2. Thailand
- 12.4.3. Malaysia
- 12.4.4. Singapore
- 12.4.5. Philippines
- 12.4.6. Vietnam
- 12.4.7. Rest of South-East Asia
- 12.1. Market Analysis, Insights and Forecast - by Type
- 13. Competitive Analysis
- 13.1. Global Market Share Analysis 2024
- 13.2. Company Profiles
- 13.2.1 Plastic Resin Manufacturers
- 13.2.1.1. Overview
- 13.2.1.2. Products
- 13.2.1.3. SWOT Analysis
- 13.2.1.4. Recent Developments
- 13.2.1.5. Financials (Based on Availability)
- 13.2.2 1 AGC Chemicals Vietnam Co Ltd
- 13.2.2.1. Overview
- 13.2.2.2. Products
- 13.2.2.3. SWOT Analysis
- 13.2.2.4. Recent Developments
- 13.2.2.5. Financials (Based on Availability)
- 13.2.3 2 BASF SE
- 13.2.3.1. Overview
- 13.2.3.2. Products
- 13.2.3.3. SWOT Analysis
- 13.2.3.4. Recent Developments
- 13.2.3.5. Financials (Based on Availability)
- 13.2.4 3 Chemrez Technologies Inc
- 13.2.4.1. Overview
- 13.2.4.2. Products
- 13.2.4.3. SWOT Analysis
- 13.2.4.4. Recent Developments
- 13.2.4.5. Financials (Based on Availability)
- 13.2.5 4 Dow
- 13.2.5.1. Overview
- 13.2.5.2. Products
- 13.2.5.3. SWOT Analysis
- 13.2.5.4. Recent Developments
- 13.2.5.5. Financials (Based on Availability)
- 13.2.6 5 DuPont
- 13.2.6.1. Overview
- 13.2.6.2. Products
- 13.2.6.3. SWOT Analysis
- 13.2.6.4. Recent Developments
- 13.2.6.5. Financials (Based on Availability)
- 13.2.7 6 JG summit Petrochemical Corporation
- 13.2.7.1. Overview
- 13.2.7.2. Products
- 13.2.7.3. SWOT Analysis
- 13.2.7.4. Recent Developments
- 13.2.7.5. Financials (Based on Availability)
- 13.2.8 7 LyondellBasell Industries Holdings B V
- 13.2.8.1. Overview
- 13.2.8.2. Products
- 13.2.8.3. SWOT Analysis
- 13.2.8.4. Recent Developments
- 13.2.8.5. Financials (Based on Availability)
- 13.2.9 8 Nan Ya Plastics Corporation (Formosa)
- 13.2.9.1. Overview
- 13.2.9.2. Products
- 13.2.9.3. SWOT Analysis
- 13.2.9.4. Recent Developments
- 13.2.9.5. Financials (Based on Availability)
- 13.2.10 9 NPC Alliance Corporation
- 13.2.10.1. Overview
- 13.2.10.2. Products
- 13.2.10.3. SWOT Analysis
- 13.2.10.4. Recent Developments
- 13.2.10.5. Financials (Based on Availability)
- 13.2.11 10 Petron Corporation
- 13.2.11.1. Overview
- 13.2.11.2. Products
- 13.2.11.3. SWOT Analysis
- 13.2.11.4. Recent Developments
- 13.2.11.5. Financials (Based on Availability)
- 13.2.12 11 Philippine Resins Industries Inc
- 13.2.12.1. Overview
- 13.2.12.2. Products
- 13.2.12.3. SWOT Analysis
- 13.2.12.4. Recent Developments
- 13.2.12.5. Financials (Based on Availability)
- 13.2.13 Plastic Product Manufacturers
- 13.2.13.1. Overview
- 13.2.13.2. Products
- 13.2.13.3. SWOT Analysis
- 13.2.13.4. Recent Developments
- 13.2.13.5. Financials (Based on Availability)
- 13.2.14 1 Ampac Holdings LLC
- 13.2.14.1. Overview
- 13.2.14.2. Products
- 13.2.14.3. SWOT Analysis
- 13.2.14.4. Recent Developments
- 13.2.14.5. Financials (Based on Availability)
- 13.2.15 2 Bavico Ltd
- 13.2.15.1. Overview
- 13.2.15.2. Products
- 13.2.15.3. SWOT Analysis
- 13.2.15.4. Recent Developments
- 13.2.15.5. Financials (Based on Availability)
- 13.2.16 3 Binh Minh Plastic
- 13.2.16.1. Overview
- 13.2.16.2. Products
- 13.2.16.3. SWOT Analysis
- 13.2.16.4. Recent Developments
- 13.2.16.5. Financials (Based on Availability)
- 13.2.17 4 Chan Thuan Thanh Plastic Mechanical & Trading Co Ltd
- 13.2.17.1. Overview
- 13.2.17.2. Products
- 13.2.17.3. SWOT Analysis
- 13.2.17.4. Recent Developments
- 13.2.17.5. Financials (Based on Availability)
- 13.2.18 5 Cholon Plastic Co Ltd
- 13.2.18.1. Overview
- 13.2.18.2. Products
- 13.2.18.3. SWOT Analysis
- 13.2.18.4. Recent Developments
- 13.2.18.5. Financials (Based on Availability)
- 13.2.19 6 City Long (Cambodia) Co Ltd
- 13.2.19.1. Overview
- 13.2.19.2. Products
- 13.2.19.3. SWOT Analysis
- 13.2.19.4. Recent Developments
- 13.2.19.5. Financials (Based on Availability)
- 13.2.20 7 Duy Tan Plastics Corporation*List Not Exhaustive
- 13.2.20.1. Overview
- 13.2.20.2. Products
- 13.2.20.3. SWOT Analysis
- 13.2.20.4. Recent Developments
- 13.2.20.5. Financials (Based on Availability)
- 13.2.1 Plastic Resin Manufacturers
List of Figures
- Figure 1: Global Southeast Asia Plastics Industry Revenue Breakdown (Million, %) by Region 2024 & 2032
- Figure 2: Indonesia Southeast Asia Plastics Industry Revenue (Million), by Type 2024 & 2032
- Figure 3: Indonesia Southeast Asia Plastics Industry Revenue Share (%), by Type 2024 & 2032
- Figure 4: Indonesia Southeast Asia Plastics Industry Revenue (Million), by Technology 2024 & 2032
- Figure 5: Indonesia Southeast Asia Plastics Industry Revenue Share (%), by Technology 2024 & 2032
- Figure 6: Indonesia Southeast Asia Plastics Industry Revenue (Million), by Application 2024 & 2032
- Figure 7: Indonesia Southeast Asia Plastics Industry Revenue Share (%), by Application 2024 & 2032
- Figure 8: Indonesia Southeast Asia Plastics Industry Revenue (Million), by Geography 2024 & 2032
- Figure 9: Indonesia Southeast Asia Plastics Industry Revenue Share (%), by Geography 2024 & 2032
- Figure 10: Indonesia Southeast Asia Plastics Industry Revenue (Million), by Country 2024 & 2032
- Figure 11: Indonesia Southeast Asia Plastics Industry Revenue Share (%), by Country 2024 & 2032
- Figure 12: Thailand Southeast Asia Plastics Industry Revenue (Million), by Type 2024 & 2032
- Figure 13: Thailand Southeast Asia Plastics Industry Revenue Share (%), by Type 2024 & 2032
- Figure 14: Thailand Southeast Asia Plastics Industry Revenue (Million), by Technology 2024 & 2032
- Figure 15: Thailand Southeast Asia Plastics Industry Revenue Share (%), by Technology 2024 & 2032
- Figure 16: Thailand Southeast Asia Plastics Industry Revenue (Million), by Application 2024 & 2032
- Figure 17: Thailand Southeast Asia Plastics Industry Revenue Share (%), by Application 2024 & 2032
- Figure 18: Thailand Southeast Asia Plastics Industry Revenue (Million), by Geography 2024 & 2032
- Figure 19: Thailand Southeast Asia Plastics Industry Revenue Share (%), by Geography 2024 & 2032
- Figure 20: Thailand Southeast Asia Plastics Industry Revenue (Million), by Country 2024 & 2032
- Figure 21: Thailand Southeast Asia Plastics Industry Revenue Share (%), by Country 2024 & 2032
- Figure 22: Malaysia Southeast Asia Plastics Industry Revenue (Million), by Type 2024 & 2032
- Figure 23: Malaysia Southeast Asia Plastics Industry Revenue Share (%), by Type 2024 & 2032
- Figure 24: Malaysia Southeast Asia Plastics Industry Revenue (Million), by Technology 2024 & 2032
- Figure 25: Malaysia Southeast Asia Plastics Industry Revenue Share (%), by Technology 2024 & 2032
- Figure 26: Malaysia Southeast Asia Plastics Industry Revenue (Million), by Application 2024 & 2032
- Figure 27: Malaysia Southeast Asia Plastics Industry Revenue Share (%), by Application 2024 & 2032
- Figure 28: Malaysia Southeast Asia Plastics Industry Revenue (Million), by Geography 2024 & 2032
- Figure 29: Malaysia Southeast Asia Plastics Industry Revenue Share (%), by Geography 2024 & 2032
- Figure 30: Malaysia Southeast Asia Plastics Industry Revenue (Million), by Country 2024 & 2032
- Figure 31: Malaysia Southeast Asia Plastics Industry Revenue Share (%), by Country 2024 & 2032
- Figure 32: Singapore Southeast Asia Plastics Industry Revenue (Million), by Type 2024 & 2032
- Figure 33: Singapore Southeast Asia Plastics Industry Revenue Share (%), by Type 2024 & 2032
- Figure 34: Singapore Southeast Asia Plastics Industry Revenue (Million), by Technology 2024 & 2032
- Figure 35: Singapore Southeast Asia Plastics Industry Revenue Share (%), by Technology 2024 & 2032
- Figure 36: Singapore Southeast Asia Plastics Industry Revenue (Million), by Application 2024 & 2032
- Figure 37: Singapore Southeast Asia Plastics Industry Revenue Share (%), by Application 2024 & 2032
- Figure 38: Singapore Southeast Asia Plastics Industry Revenue (Million), by Geography 2024 & 2032
- Figure 39: Singapore Southeast Asia Plastics Industry Revenue Share (%), by Geography 2024 & 2032
- Figure 40: Singapore Southeast Asia Plastics Industry Revenue (Million), by Country 2024 & 2032
- Figure 41: Singapore Southeast Asia Plastics Industry Revenue Share (%), by Country 2024 & 2032
- Figure 42: Philippines Southeast Asia Plastics Industry Revenue (Million), by Type 2024 & 2032
- Figure 43: Philippines Southeast Asia Plastics Industry Revenue Share (%), by Type 2024 & 2032
- Figure 44: Philippines Southeast Asia Plastics Industry Revenue (Million), by Technology 2024 & 2032
- Figure 45: Philippines Southeast Asia Plastics Industry Revenue Share (%), by Technology 2024 & 2032
- Figure 46: Philippines Southeast Asia Plastics Industry Revenue (Million), by Application 2024 & 2032
- Figure 47: Philippines Southeast Asia Plastics Industry Revenue Share (%), by Application 2024 & 2032
- Figure 48: Philippines Southeast Asia Plastics Industry Revenue (Million), by Geography 2024 & 2032
- Figure 49: Philippines Southeast Asia Plastics Industry Revenue Share (%), by Geography 2024 & 2032
- Figure 50: Philippines Southeast Asia Plastics Industry Revenue (Million), by Country 2024 & 2032
- Figure 51: Philippines Southeast Asia Plastics Industry Revenue Share (%), by Country 2024 & 2032
- Figure 52: Vietnam Southeast Asia Plastics Industry Revenue (Million), by Type 2024 & 2032
- Figure 53: Vietnam Southeast Asia Plastics Industry Revenue Share (%), by Type 2024 & 2032
- Figure 54: Vietnam Southeast Asia Plastics Industry Revenue (Million), by Technology 2024 & 2032
- Figure 55: Vietnam Southeast Asia Plastics Industry Revenue Share (%), by Technology 2024 & 2032
- Figure 56: Vietnam Southeast Asia Plastics Industry Revenue (Million), by Application 2024 & 2032
- Figure 57: Vietnam Southeast Asia Plastics Industry Revenue Share (%), by Application 2024 & 2032
- Figure 58: Vietnam Southeast Asia Plastics Industry Revenue (Million), by Geography 2024 & 2032
- Figure 59: Vietnam Southeast Asia Plastics Industry Revenue Share (%), by Geography 2024 & 2032
- Figure 60: Vietnam Southeast Asia Plastics Industry Revenue (Million), by Country 2024 & 2032
- Figure 61: Vietnam Southeast Asia Plastics Industry Revenue Share (%), by Country 2024 & 2032
- Figure 62: Rest of South East Asia Southeast Asia Plastics Industry Revenue (Million), by Type 2024 & 2032
- Figure 63: Rest of South East Asia Southeast Asia Plastics Industry Revenue Share (%), by Type 2024 & 2032
- Figure 64: Rest of South East Asia Southeast Asia Plastics Industry Revenue (Million), by Technology 2024 & 2032
- Figure 65: Rest of South East Asia Southeast Asia Plastics Industry Revenue Share (%), by Technology 2024 & 2032
- Figure 66: Rest of South East Asia Southeast Asia Plastics Industry Revenue (Million), by Application 2024 & 2032
- Figure 67: Rest of South East Asia Southeast Asia Plastics Industry Revenue Share (%), by Application 2024 & 2032
- Figure 68: Rest of South East Asia Southeast Asia Plastics Industry Revenue (Million), by Geography 2024 & 2032
- Figure 69: Rest of South East Asia Southeast Asia Plastics Industry Revenue Share (%), by Geography 2024 & 2032
- Figure 70: Rest of South East Asia Southeast Asia Plastics Industry Revenue (Million), by Country 2024 & 2032
- Figure 71: Rest of South East Asia Southeast Asia Plastics Industry Revenue Share (%), by Country 2024 & 2032
List of Tables
- Table 1: Global Southeast Asia Plastics Industry Revenue Million Forecast, by Region 2019 & 2032
- Table 2: Global Southeast Asia Plastics Industry Revenue Million Forecast, by Type 2019 & 2032
- Table 3: Global Southeast Asia Plastics Industry Revenue Million Forecast, by Technology 2019 & 2032
- Table 4: Global Southeast Asia Plastics Industry Revenue Million Forecast, by Application 2019 & 2032
- Table 5: Global Southeast Asia Plastics Industry Revenue Million Forecast, by Geography 2019 & 2032
- Table 6: Global Southeast Asia Plastics Industry Revenue Million Forecast, by Region 2019 & 2032
- Table 7: Global Southeast Asia Plastics Industry Revenue Million Forecast, by Type 2019 & 2032
- Table 8: Global Southeast Asia Plastics Industry Revenue Million Forecast, by Technology 2019 & 2032
- Table 9: Global Southeast Asia Plastics Industry Revenue Million Forecast, by Application 2019 & 2032
- Table 10: Global Southeast Asia Plastics Industry Revenue Million Forecast, by Geography 2019 & 2032
- Table 11: Global Southeast Asia Plastics Industry Revenue Million Forecast, by Country 2019 & 2032
- Table 12: Global Southeast Asia Plastics Industry Revenue Million Forecast, by Type 2019 & 2032
- Table 13: Global Southeast Asia Plastics Industry Revenue Million Forecast, by Technology 2019 & 2032
- Table 14: Global Southeast Asia Plastics Industry Revenue Million Forecast, by Application 2019 & 2032
- Table 15: Global Southeast Asia Plastics Industry Revenue Million Forecast, by Geography 2019 & 2032
- Table 16: Global Southeast Asia Plastics Industry Revenue Million Forecast, by Country 2019 & 2032
- Table 17: Global Southeast Asia Plastics Industry Revenue Million Forecast, by Type 2019 & 2032
- Table 18: Global Southeast Asia Plastics Industry Revenue Million Forecast, by Technology 2019 & 2032
- Table 19: Global Southeast Asia Plastics Industry Revenue Million Forecast, by Application 2019 & 2032
- Table 20: Global Southeast Asia Plastics Industry Revenue Million Forecast, by Geography 2019 & 2032
- Table 21: Global Southeast Asia Plastics Industry Revenue Million Forecast, by Country 2019 & 2032
- Table 22: Global Southeast Asia Plastics Industry Revenue Million Forecast, by Type 2019 & 2032
- Table 23: Global Southeast Asia Plastics Industry Revenue Million Forecast, by Technology 2019 & 2032
- Table 24: Global Southeast Asia Plastics Industry Revenue Million Forecast, by Application 2019 & 2032
- Table 25: Global Southeast Asia Plastics Industry Revenue Million Forecast, by Geography 2019 & 2032
- Table 26: Global Southeast Asia Plastics Industry Revenue Million Forecast, by Country 2019 & 2032
- Table 27: Global Southeast Asia Plastics Industry Revenue Million Forecast, by Type 2019 & 2032
- Table 28: Global Southeast Asia Plastics Industry Revenue Million Forecast, by Technology 2019 & 2032
- Table 29: Global Southeast Asia Plastics Industry Revenue Million Forecast, by Application 2019 & 2032
- Table 30: Global Southeast Asia Plastics Industry Revenue Million Forecast, by Geography 2019 & 2032
- Table 31: Global Southeast Asia Plastics Industry Revenue Million Forecast, by Country 2019 & 2032
- Table 32: Global Southeast Asia Plastics Industry Revenue Million Forecast, by Type 2019 & 2032
- Table 33: Global Southeast Asia Plastics Industry Revenue Million Forecast, by Technology 2019 & 2032
- Table 34: Global Southeast Asia Plastics Industry Revenue Million Forecast, by Application 2019 & 2032
- Table 35: Global Southeast Asia Plastics Industry Revenue Million Forecast, by Geography 2019 & 2032
- Table 36: Global Southeast Asia Plastics Industry Revenue Million Forecast, by Country 2019 & 2032
- Table 37: Global Southeast Asia Plastics Industry Revenue Million Forecast, by Type 2019 & 2032
- Table 38: Global Southeast Asia Plastics Industry Revenue Million Forecast, by Technology 2019 & 2032
- Table 39: Global Southeast Asia Plastics Industry Revenue Million Forecast, by Application 2019 & 2032
- Table 40: Global Southeast Asia Plastics Industry Revenue Million Forecast, by Geography 2019 & 2032
- Table 41: Global Southeast Asia Plastics Industry Revenue Million Forecast, by Country 2019 & 2032
Frequently Asked Questions
1. What is the projected Compound Annual Growth Rate (CAGR) of the Southeast Asia Plastics Industry?
The projected CAGR is approximately > 4.00%.
2. Which companies are prominent players in the Southeast Asia Plastics Industry?
Key companies in the market include Plastic Resin Manufacturers, 1 AGC Chemicals Vietnam Co Ltd, 2 BASF SE, 3 Chemrez Technologies Inc, 4 Dow, 5 DuPont, 6 JG summit Petrochemical Corporation, 7 LyondellBasell Industries Holdings B V, 8 Nan Ya Plastics Corporation (Formosa), 9 NPC Alliance Corporation, 10 Petron Corporation, 11 Philippine Resins Industries Inc, Plastic Product Manufacturers, 1 Ampac Holdings LLC, 2 Bavico Ltd, 3 Binh Minh Plastic, 4 Chan Thuan Thanh Plastic Mechanical & Trading Co Ltd, 5 Cholon Plastic Co Ltd, 6 City Long (Cambodia) Co Ltd, 7 Duy Tan Plastics Corporation*List Not Exhaustive.
3. What are the main segments of the Southeast Asia Plastics Industry?
The market segments include Type, Technology, Application, Geography.
4. Can you provide details about the market size?
The market size is estimated to be USD XX Million as of 2022.
5. What are some drivers contributing to market growth?
Rising Demand from Food and Beverage Packaging; Rapid Increase in the Downstream Processing Capacity Additions; Other Drivers.
6. What are the notable trends driving market growth?
Injection Molding Technology to Dominate the Market.
7. Are there any restraints impacting market growth?
Rising Demand from Food and Beverage Packaging; Rapid Increase in the Downstream Processing Capacity Additions; Other Drivers.
8. Can you provide examples of recent developments in the market?
The recent developments pertaining to the major players in the market are being covered in the complete study.
9. What pricing options are available for accessing the report?
Pricing options include single-user, multi-user, and enterprise licenses priced at USD 4750, USD 5250, and USD 8750 respectively.
10. Is the market size provided in terms of value or volume?
The market size is provided in terms of value, measured in Million.
11. Are there any specific market keywords associated with the report?
Yes, the market keyword associated with the report is "Southeast Asia Plastics Industry," which aids in identifying and referencing the specific market segment covered.
12. How do I determine which pricing option suits my needs best?
The pricing options vary based on user requirements and access needs. Individual users may opt for single-user licenses, while businesses requiring broader access may choose multi-user or enterprise licenses for cost-effective access to the report.
13. Are there any additional resources or data provided in the Southeast Asia Plastics Industry report?
While the report offers comprehensive insights, it's advisable to review the specific contents or supplementary materials provided to ascertain if additional resources or data are available.
14. How can I stay updated on further developments or reports in the Southeast Asia Plastics Industry?
To stay informed about further developments, trends, and reports in the Southeast Asia Plastics Industry, consider subscribing to industry newsletters, following relevant companies and organizations, or regularly checking reputable industry news sources and publications.
Methodology
Step 1 - Identification of Relevant Samples Size from Population Database


Step 2 - Approaches for Defining Global Market Size (Value, Volume* & Price*)

Note*: In applicable scenarios
Step 3 - Data Sources
Primary Research
- Web Analytics
- Survey Reports
- Research Institute
- Latest Research Reports
- Opinion Leaders
Secondary Research
- Annual Reports
- White Paper
- Latest Press Release
- Industry Association
- Paid Database
- Investor Presentations

Step 4 - Data Triangulation
Involves using different sources of information in order to increase the validity of a study
These sources are likely to be stakeholders in a program - participants, other researchers, program staff, other community members, and so on.
Then we put all data in single framework & apply various statistical tools to find out the dynamic on the market.
During the analysis stage, feedback from the stakeholder groups would be compared to determine areas of agreement as well as areas of divergence


