

Key Insights
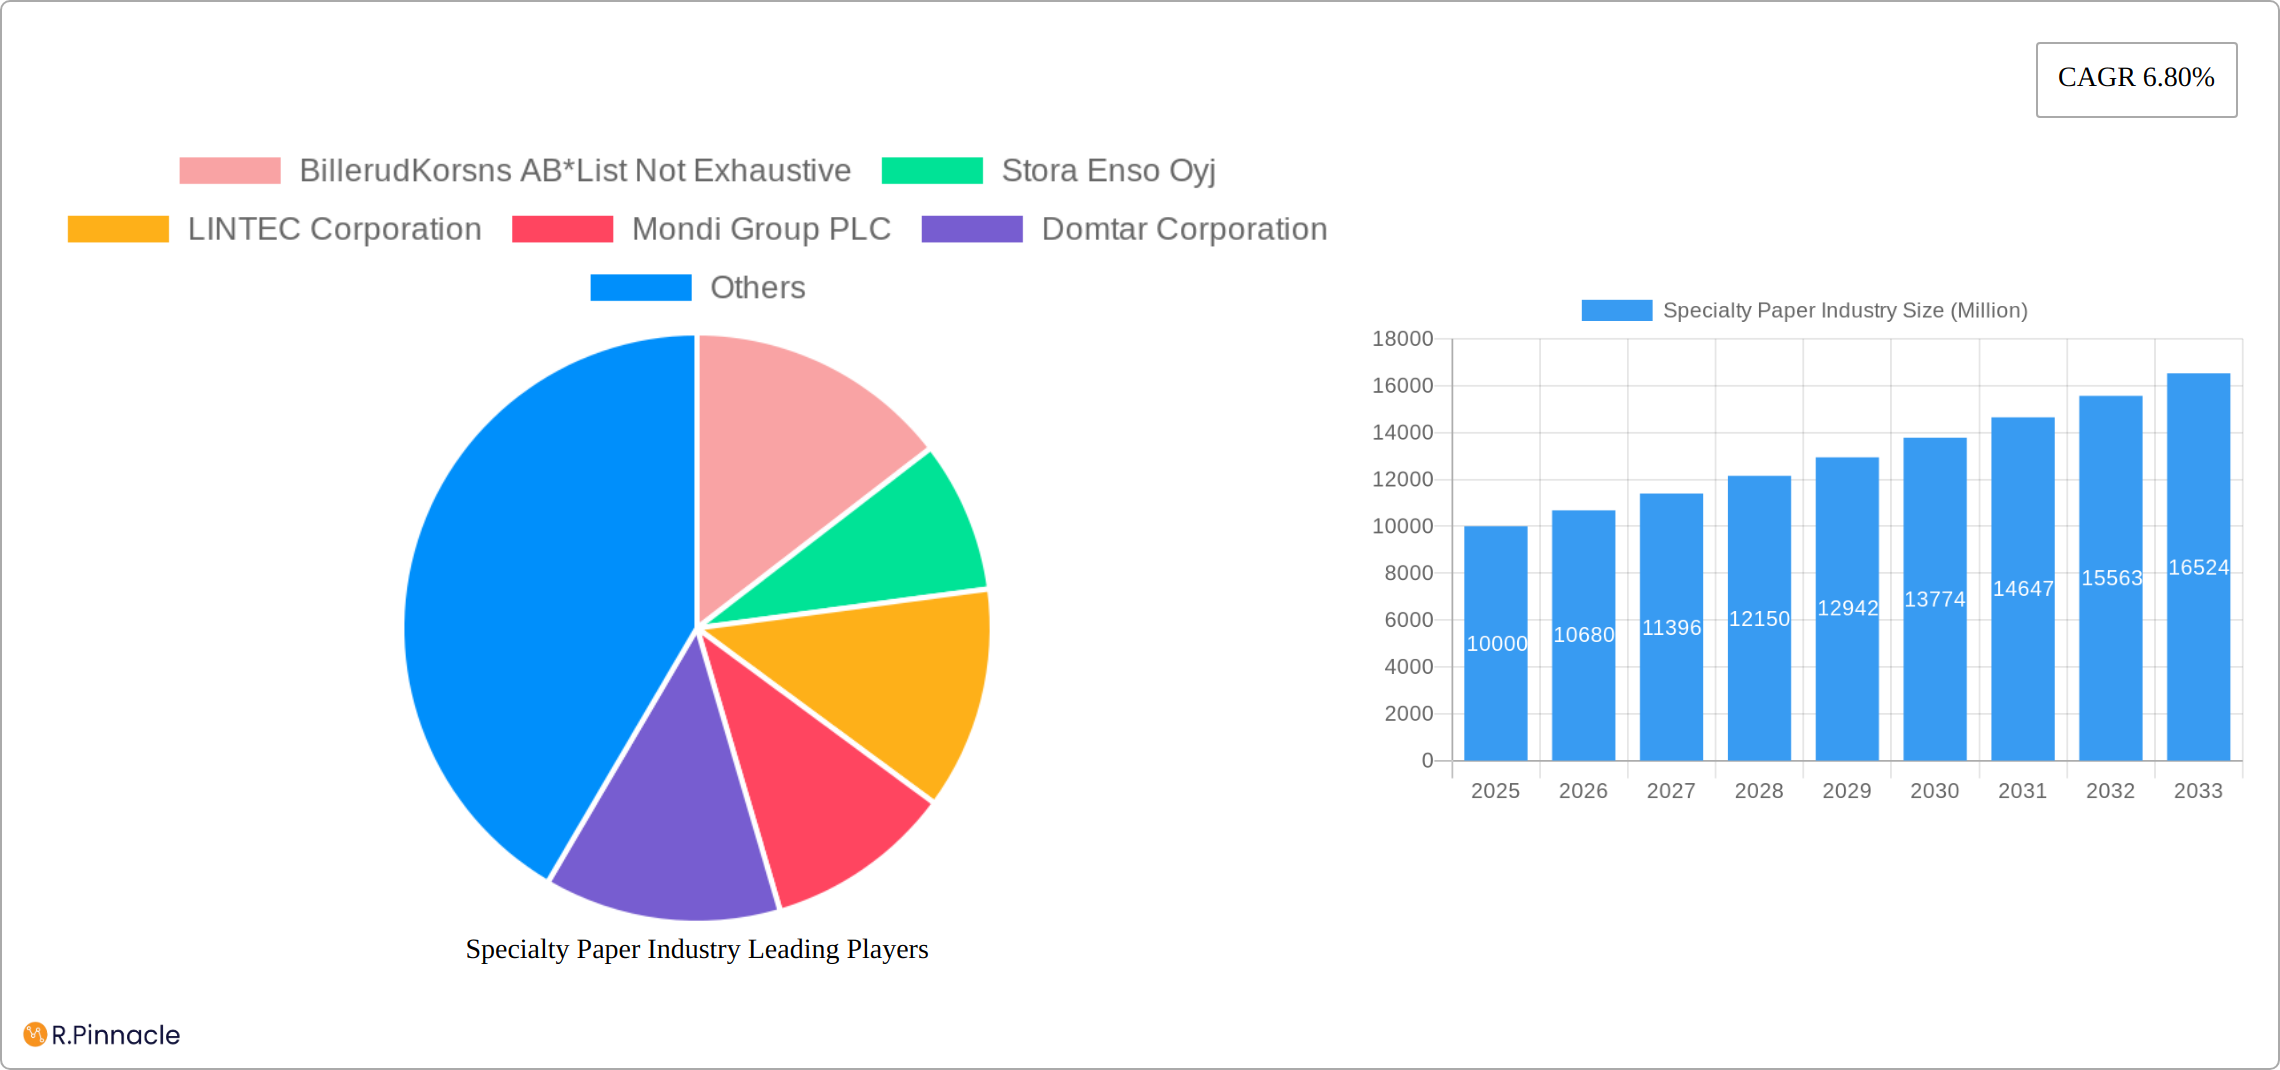
The global specialty paper market, valued at $18 billion in 2025, is projected to achieve a Compound Annual Growth Rate (CAGR) of 5.1% from 2025 to 2033. This growth is driven by increasing demand for sustainable packaging solutions in sectors like food service and e-commerce, boosting segments such as kraft paper and container board. The rise of eco-friendly printing and publishing materials is also propelling demand for label and silicon-based papers. Advancements in paper manufacturing enhancing functionality further contribute to market expansion. Key challenges include fluctuating raw material prices and competition from alternative packaging materials like plastics. North America and Europe currently lead market share, while the Asia-Pacific region is anticipated for substantial growth due to expanding economies and burgeoning packaging and printing industries.
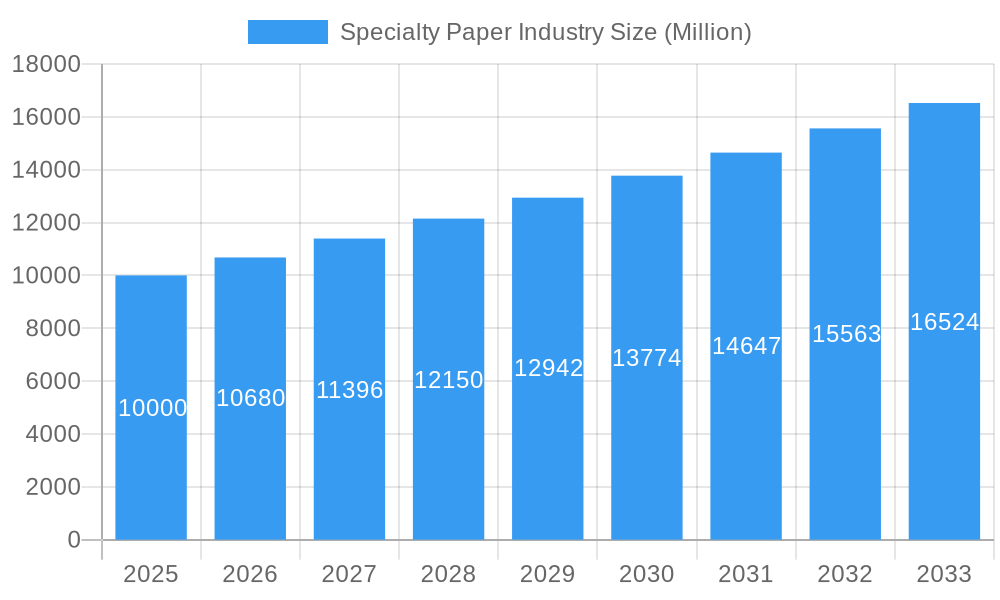
Specialty Paper Industry Market Size (In Billion)
Market segmentation highlights the dominance of kraft paper and container board, driven by sustainable packaging preferences. The label paper segment is growing due to increased demand for product labeling. Silicon-based paper adoption is rising for specialized packaging and industrial applications. The packaging and labeling segment is the largest end-user industry, followed by food service and printing & publication. The building & construction sector shows potential growth for insulation and related applications. Key market players are investing in R&D and strategic expansions. Future growth hinges on managing raw material costs, evolving consumer preferences, and environmental regulations.
Specialty Paper Industry Company Market Share
Specialty Paper Industry Market Report: 2019-2033
This comprehensive report provides an in-depth analysis of the Specialty Paper Industry, offering invaluable insights for industry professionals, investors, and strategic decision-makers. Covering the period 2019-2033, with a focus on 2025, this report leverages rigorous data analysis and expert insights to illuminate current market dynamics and predict future trends. The report projects a market size of $XX Million by 2033.
Specialty Paper Industry Market Structure & Innovation Trends
The global specialty paper market exhibits a moderately consolidated structure, with several key players commanding significant market share. BillerudKorsnäs AB, Stora Enso Oyj, Mondi Group PLC, and Sappi Limited are among the prominent companies shaping the industry landscape. The market share held by these top players is estimated at approximately 40% in 2025, reflecting both their size and historical influence. However, a significant proportion of the market is also comprised of smaller, regional players, leading to diverse competition.
Innovation is a crucial driver within the specialty paper market, fueled by rising demand for sustainable packaging solutions and the ongoing push for enhanced product functionalities. Regulatory frameworks, such as those focusing on reducing plastic waste and promoting environmentally friendly materials, significantly impact industry innovation. Product substitution, primarily from plastic alternatives, presents a noteworthy challenge, forcing manufacturers to continually innovate in product design and material science.
Mergers and acquisitions (M&A) activity plays a significant role in shaping the market structure. Recent deals, while individually not reaching billion-dollar values, collectively contribute to reshaping the competitive dynamics. For example, the average M&A deal value in the last five years was estimated at $XX Million. This activity reflects companies’ efforts to expand their product portfolio, enhance their geographic reach, and gain access to new technologies. Analyzing these deals reveals strategic priorities for market expansion and adaptation to changing consumer preferences.
Specialty Paper Industry Market Dynamics & Trends
The specialty paper market is experiencing dynamic growth, driven by several key factors. The robust growth of the packaging and labeling segments, fueled by e-commerce expansion and increasing consumer demand, is a major contributor. Technological advancements, such as the development of high-performance coatings and sustainable materials, are further driving growth. The shift towards eco-friendly packaging, coupled with the regulatory pressures to reduce plastic use, presents substantial growth opportunities. Consumer preferences are also leaning towards sustainable and functional products, creating a positive feedback loop that boosts demand for specialized paper solutions. The market's Compound Annual Growth Rate (CAGR) is projected at XX% during the forecast period (2025-2033), with the market penetration of sustainable packaging solutions expected to rise from XX% to XX% by 2033. Competitive dynamics are shaped by both price competition and the differentiation of product offerings based on sustainability, functionality, and brand reputation.
Dominant Regions & Segments in Specialty Paper Industry
North America and Europe currently dominate the specialty paper market, fueled by robust demand, well-established manufacturing infrastructure, and advanced technological capabilities. Within these regions, key players like the United States and Germany hold significant positions due to their substantial consumer markets and mature industrial bases. This dominance is further solidified by factors beyond simple geographical location.
Key Drivers of Market Leadership:
- Developed Economies and High Consumption Rates: High per capita consumption in these regions drives significant demand for specialty paper products across various sectors.
- Progressive Regulatory Landscapes: Stringent environmental regulations promoting sustainable packaging and reducing plastic waste are creating a favorable environment for specialty paper.
- Technological Innovation and R&D Investment: These regions lead in developing innovative paper materials, coatings, and processes, constantly pushing the boundaries of specialty paper applications.
- Strong Supply Chains and Infrastructure: Established supply chains and robust infrastructure ensure efficient production and distribution of specialty paper products.
Segment-Specific Analysis:
By End-user Industry: The packaging and labeling segment remains the largest, driven by the surging demand for sustainable alternatives to plastic. Within this, the food service sector shows particularly strong growth due to the increasing preference for eco-friendly packaging. While the printing and publishing segment remains relevant, it faces ongoing challenges from the digital revolution. Building and construction applications, along with other diverse end-uses (lamination, retail bags, etc.), demonstrate consistent growth, reflecting the versatility of specialty paper.
By Type: Kraft paper continues its dominance, followed by container board/paperboard due to their broad applications. Label paper experiences robust growth fueled by the packaging boom. While silicon-based paper and other specialized types occupy niche segments, they see targeted growth in high-value applications, such as electronics and medical.
Specialty Paper Industry Product Innovations
Recent product innovations in the specialty paper industry focus on enhancing sustainability, functionality, and performance. This includes the development of biodegradable and compostable papers, improved barrier coatings to enhance food safety, and specialized papers with unique surface properties. These innovations meet growing consumer demands for eco-friendly solutions and cater to industry-specific requirements. The competitive advantage lies in delivering value-added features, optimized performance, and reduced environmental impact.
Report Scope & Segmentation Analysis
This report encompasses a comprehensive analysis of the specialty paper market across various segments.
By End-user Industry: Packaging & Labeling, Food Service, Printing & Publication, Building & Construction, Other End-user Industries. Each segment is analyzed considering its growth projections, current market size, and the competitive dynamics within the sector. For instance, the Packaging & Labeling segment is expected to maintain its dominant position, exhibiting a CAGR of XX% due to the continued expansion of the e-commerce sector.
By Type: Kraft Paper, Container Board/Paper Board, Label Paper, Silicon-based Paper, and Others. Each segment’s growth trajectory is influenced by its unique application characteristics and the demand for related end products. For example, the Label Paper segment is projected to experience rapid growth owing to the sustained demand for high-quality label products in the food and beverage and pharmaceutical sectors. Market sizes and growth projections are provided for each segment.
Key Drivers of Specialty Paper Industry Growth
The specialty paper industry's growth is fueled by several key factors. Firstly, the surging demand for sustainable packaging alternatives to plastic is a significant driver. Secondly, technological advancements in paper production, allowing for enhanced functionality and durability, are driving growth. Thirdly, government regulations promoting environmentally friendly materials are bolstering the industry. For example, the EU's Single-Use Plastics Directive has spurred innovation in sustainable packaging solutions.
Challenges in the Specialty Paper Industry Sector
The specialty paper industry faces significant challenges, including fluctuating raw material prices impacting profitability. Supply chain disruptions, particularly during global events, can severely impact production and delivery schedules. Intense competition among established players and emerging market entrants further complicates the market landscape. These challenges require strategic management and adaptation. The combined effect of these factors can lead to a reduction in profit margins by an estimated XX% in years with significant supply chain disruptions.
Emerging Opportunities in Specialty Paper Industry
The specialty paper industry presents several emerging opportunities. The increasing demand for sustainable and biodegradable packaging materials offers considerable potential for growth. The development of new paper-based applications in sectors such as electronics and healthcare represents another promising area. Furthermore, advancements in digital printing technologies are creating new possibilities for customized and personalized paper products.
Leading Players in the Specialty Paper Industry Market
- BillerudKorsnäs AB
- Stora Enso Oyj
- LINTEC Corporation
- Mondi Group PLC
- Domtar Corporation
- Sappi Limited
- Nippon Paper Industries Co Ltd
- ITC Limited
- Twin Rivers Paper Company
- Nordic Paper AS
Key Developments in Specialty Paper Industry
November 2022: Sappi North America announced a USD 418 million investment in paper machine rebuilds at its Somerset Mill, focusing on increasing the production of sustainable solid bleached sulfate board—a direct competitor to plastic packaging. This significant investment underscores the industry's shift toward sustainable alternatives and Sappi's commitment to its Thrive25 strategy.
September 2022: Sappi Europe invested a double-digit million-euro sum to expand its Gratkorn, Austria mill, enabling the production of wet-strength label papers. This expansion positions Sappi for leadership in the growing label sector.
Future Outlook for Specialty Paper Industry Market
The future of the specialty paper industry appears positive, driven by ongoing demand for sustainable packaging solutions and technological advancements. The industry is expected to experience robust growth in the coming years, driven by expanding global markets and the increasing adoption of specialized paper products across diverse sectors. Strategic investments in research and development, coupled with sustainable practices, will play a vital role in shaping the industry's future trajectory and ensuring long-term success.
Specialty Paper Industry Segmentation
-
1. Type
- 1.1. Kraft Paper
- 1.2. Container Board/Paper Board
- 1.3. Label Paper
- 1.4. Silicon-based Paper
- 1.5. Others
-
2. End-user Industry
- 2.1. Packaging & Labelling
- 2.2. Food Service
- 2.3. Printing & Publication
- 2.4. Building & Construction
- 2.5. Other En
Specialty Paper Industry Segmentation By Geography
-
1. North America
- 1.1. United States
- 1.2. Canada
-
2. Europe
- 2.1. Germany
- 2.2. United Kingdom
- 2.3. France
- 2.4. Rest of Europe
-
3. Asia Pacific
- 3.1. China
- 3.2. India
- 3.3. Japan
- 3.4. Rest of Asia Pacific
-
4. Latin America
- 4.1. Brazil
- 4.2. Mexico
- 4.3. Rest of Latin America
- 5. Middle East and Africa
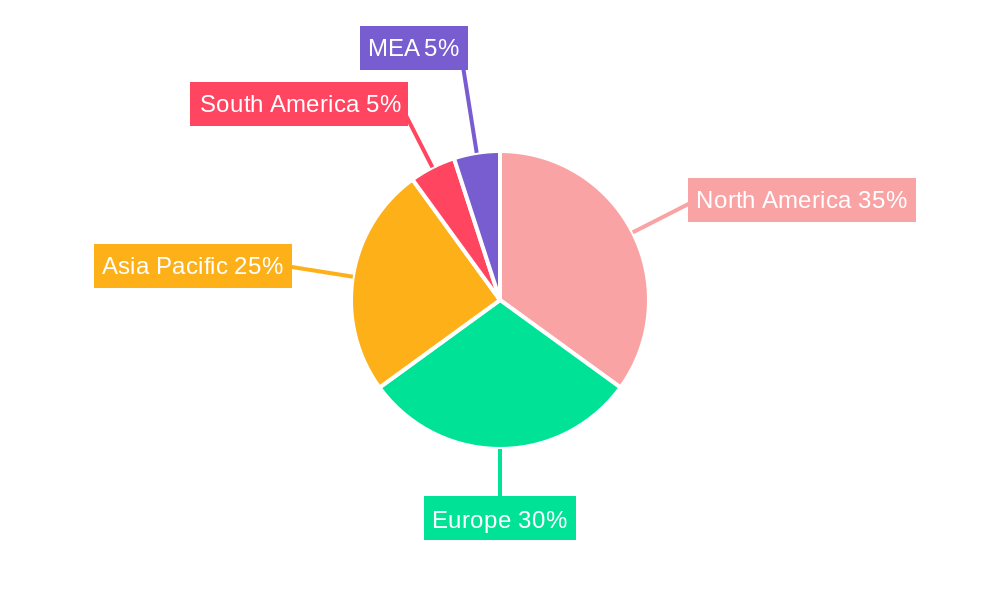
Specialty Paper Industry Regional Market Share
Geographic Coverage of Specialty Paper Industry
Specialty Paper Industry REPORT HIGHLIGHTS
| Aspects | Details |
|---|---|
| Study Period | 2020-2034 |
| Base Year | 2025 |
| Estimated Year | 2026 |
| Forecast Period | 2026-2034 |
| Historical Period | 2020-2025 |
| Growth Rate | CAGR of 5.1% from 2020-2034 |
| Segmentation |
|
Table of Contents
- 1. Introduction
- 1.1. Research Scope
- 1.2. Market Segmentation
- 1.3. Research Objective
- 1.4. Definitions and Assumptions
- 2. Executive Summary
- 2.1. Market Snapshot
- 3. Market Dynamics
- 3.1. Market Drivers
- 3.2. Market Restrains
- 3.3. Market Trends
- 3.4. Market Opportunities
- 4. Market Factor Analysis
- 4.1. Porters Five Forces
- 4.1.1. Bargaining Power of Suppliers
- 4.1.2. Bargaining Power of Buyers
- 4.1.3. Threat of New Entrants
- 4.1.4. Threat of Substitutes
- 4.1.5. Competitive Rivalry
- 4.2. PESTEL analysis
- 4.3. BCG Analysis
- 4.3.1. Stars (High Growth, High Market Share)
- 4.3.2. Cash Cows (Low Growth, High Market Share)
- 4.3.3. Question Mark (High Growth, Low Market Share)
- 4.3.4. Dogs (Low Growth, Low Market Share)
- 4.4. Ansoff Matrix Analysis
- 4.5. Supply Chain Analysis
- 4.6. Regulatory Landscape
- 4.7. Current Market Potential and Opportunity Assessment (TAM–SAM–SOM Framework)
- 4.8. PRI Analyst Note
- 4.1. Porters Five Forces
- 5. Market Analysis, Insights and Forecast 2021-2033
- 5.1. Market Analysis, Insights and Forecast - by Type
- 5.1.1. Kraft Paper
- 5.1.2. Container Board/Paper Board
- 5.1.3. Label Paper
- 5.1.4. Silicon-based Paper
- 5.1.5. Others
- 5.2. Market Analysis, Insights and Forecast - by End-user Industry
- 5.2.1. Packaging & Labelling
- 5.2.2. Food Service
- 5.2.3. Printing & Publication
- 5.2.4. Building & Construction
- 5.2.5. Other En
- 5.3. Market Analysis, Insights and Forecast - by Region
- 5.3.1. North America
- 5.3.2. Europe
- 5.3.3. Asia Pacific
- 5.3.4. Latin America
- 5.3.5. Middle East and Africa
- 5.1. Market Analysis, Insights and Forecast - by Type
- 6. Global Specialty Paper Industry Analysis, Insights and Forecast, 2021-2033
- 6.1. Market Analysis, Insights and Forecast - by Type
- 6.1.1. Kraft Paper
- 6.1.2. Container Board/Paper Board
- 6.1.3. Label Paper
- 6.1.4. Silicon-based Paper
- 6.1.5. Others
- 6.2. Market Analysis, Insights and Forecast - by End-user Industry
- 6.2.1. Packaging & Labelling
- 6.2.2. Food Service
- 6.2.3. Printing & Publication
- 6.2.4. Building & Construction
- 6.2.5. Other En
- 6.1. Market Analysis, Insights and Forecast - by Type
- 7. North America Specialty Paper Industry Analysis, Insights and Forecast, 2020-2032
- 7.1. Market Analysis, Insights and Forecast - by Type
- 7.1.1. Kraft Paper
- 7.1.2. Container Board/Paper Board
- 7.1.3. Label Paper
- 7.1.4. Silicon-based Paper
- 7.1.5. Others
- 7.2. Market Analysis, Insights and Forecast - by End-user Industry
- 7.2.1. Packaging & Labelling
- 7.2.2. Food Service
- 7.2.3. Printing & Publication
- 7.2.4. Building & Construction
- 7.2.5. Other En
- 7.1. Market Analysis, Insights and Forecast - by Type
- 8. Europe Specialty Paper Industry Analysis, Insights and Forecast, 2020-2032
- 8.1. Market Analysis, Insights and Forecast - by Type
- 8.1.1. Kraft Paper
- 8.1.2. Container Board/Paper Board
- 8.1.3. Label Paper
- 8.1.4. Silicon-based Paper
- 8.1.5. Others
- 8.2. Market Analysis, Insights and Forecast - by End-user Industry
- 8.2.1. Packaging & Labelling
- 8.2.2. Food Service
- 8.2.3. Printing & Publication
- 8.2.4. Building & Construction
- 8.2.5. Other En
- 8.1. Market Analysis, Insights and Forecast - by Type
- 9. Asia Pacific Specialty Paper Industry Analysis, Insights and Forecast, 2020-2032
- 9.1. Market Analysis, Insights and Forecast - by Type
- 9.1.1. Kraft Paper
- 9.1.2. Container Board/Paper Board
- 9.1.3. Label Paper
- 9.1.4. Silicon-based Paper
- 9.1.5. Others
- 9.2. Market Analysis, Insights and Forecast - by End-user Industry
- 9.2.1. Packaging & Labelling
- 9.2.2. Food Service
- 9.2.3. Printing & Publication
- 9.2.4. Building & Construction
- 9.2.5. Other En
- 9.1. Market Analysis, Insights and Forecast - by Type
- 10. Latin America Specialty Paper Industry Analysis, Insights and Forecast, 2020-2032
- 10.1. Market Analysis, Insights and Forecast - by Type
- 10.1.1. Kraft Paper
- 10.1.2. Container Board/Paper Board
- 10.1.3. Label Paper
- 10.1.4. Silicon-based Paper
- 10.1.5. Others
- 10.2. Market Analysis, Insights and Forecast - by End-user Industry
- 10.2.1. Packaging & Labelling
- 10.2.2. Food Service
- 10.2.3. Printing & Publication
- 10.2.4. Building & Construction
- 10.2.5. Other En
- 10.1. Market Analysis, Insights and Forecast - by Type
- 11. Middle East and Africa Specialty Paper Industry Analysis, Insights and Forecast, 2020-2032
- 11.1. Market Analysis, Insights and Forecast - by Type
- 11.1.1. Kraft Paper
- 11.1.2. Container Board/Paper Board
- 11.1.3. Label Paper
- 11.1.4. Silicon-based Paper
- 11.1.5. Others
- 11.2. Market Analysis, Insights and Forecast - by End-user Industry
- 11.2.1. Packaging & Labelling
- 11.2.2. Food Service
- 11.2.3. Printing & Publication
- 11.2.4. Building & Construction
- 11.2.5. Other En
- 11.1. Market Analysis, Insights and Forecast - by Type
- 12. Competitive Analysis
- 12.1. Company Profiles
- 12.1.1 BillerudKorsns AB*List Not Exhaustive
- 12.1.1.1. Company Overview
- 12.1.1.2. Products
- 12.1.1.3. Company Financials
- 12.1.1.4. SWOT Analysis
- 12.1.2 Stora Enso Oyj
- 12.1.2.1. Company Overview
- 12.1.2.2. Products
- 12.1.2.3. Company Financials
- 12.1.2.4. SWOT Analysis
- 12.1.3 LINTEC Corporation
- 12.1.3.1. Company Overview
- 12.1.3.2. Products
- 12.1.3.3. Company Financials
- 12.1.3.4. SWOT Analysis
- 12.1.4 Mondi Group PLC
- 12.1.4.1. Company Overview
- 12.1.4.2. Products
- 12.1.4.3. Company Financials
- 12.1.4.4. SWOT Analysis
- 12.1.5 Domtar Corporation
- 12.1.5.1. Company Overview
- 12.1.5.2. Products
- 12.1.5.3. Company Financials
- 12.1.5.4. SWOT Analysis
- 12.1.6 Sappi Limited
- 12.1.6.1. Company Overview
- 12.1.6.2. Products
- 12.1.6.3. Company Financials
- 12.1.6.4. SWOT Analysis
- 12.1.7 Nippon Paper Industries Co Ltd
- 12.1.7.1. Company Overview
- 12.1.7.2. Products
- 12.1.7.3. Company Financials
- 12.1.7.4. SWOT Analysis
- 12.1.8 ITC Limited
- 12.1.8.1. Company Overview
- 12.1.8.2. Products
- 12.1.8.3. Company Financials
- 12.1.8.4. SWOT Analysis
- 12.1.9 Twin Rivers Paper Company
- 12.1.9.1. Company Overview
- 12.1.9.2. Products
- 12.1.9.3. Company Financials
- 12.1.9.4. SWOT Analysis
- 12.1.10 Nordic Paper AS
- 12.1.10.1. Company Overview
- 12.1.10.2. Products
- 12.1.10.3. Company Financials
- 12.1.10.4. SWOT Analysis
- 12.1.1 BillerudKorsns AB*List Not Exhaustive
- 12.2. Market Entropy
- 12.2.1 Company's Key Areas Served
- 12.2.2 Recent Developments
- 12.3. Company Market Share Analysis 2025
- 12.3.1 Top 5 Companies Market Share Analysis
- 12.3.2 Top 3 Companies Market Share Analysis
- 12.4. List of Potential Customers
- 13. Research Methodology
List of Figures
- Figure 1: Global Specialty Paper Industry Revenue Breakdown (billion, %) by Region 2025 & 2033
- Figure 2: North America Specialty Paper Industry Revenue (billion), by Type 2025 & 2033
- Figure 3: North America Specialty Paper Industry Revenue Share (%), by Type 2025 & 2033
- Figure 4: North America Specialty Paper Industry Revenue (billion), by End-user Industry 2025 & 2033
- Figure 5: North America Specialty Paper Industry Revenue Share (%), by End-user Industry 2025 & 2033
- Figure 6: North America Specialty Paper Industry Revenue (billion), by Country 2025 & 2033
- Figure 7: North America Specialty Paper Industry Revenue Share (%), by Country 2025 & 2033
- Figure 8: Europe Specialty Paper Industry Revenue (billion), by Type 2025 & 2033
- Figure 9: Europe Specialty Paper Industry Revenue Share (%), by Type 2025 & 2033
- Figure 10: Europe Specialty Paper Industry Revenue (billion), by End-user Industry 2025 & 2033
- Figure 11: Europe Specialty Paper Industry Revenue Share (%), by End-user Industry 2025 & 2033
- Figure 12: Europe Specialty Paper Industry Revenue (billion), by Country 2025 & 2033
- Figure 13: Europe Specialty Paper Industry Revenue Share (%), by Country 2025 & 2033
- Figure 14: Asia Pacific Specialty Paper Industry Revenue (billion), by Type 2025 & 2033
- Figure 15: Asia Pacific Specialty Paper Industry Revenue Share (%), by Type 2025 & 2033
- Figure 16: Asia Pacific Specialty Paper Industry Revenue (billion), by End-user Industry 2025 & 2033
- Figure 17: Asia Pacific Specialty Paper Industry Revenue Share (%), by End-user Industry 2025 & 2033
- Figure 18: Asia Pacific Specialty Paper Industry Revenue (billion), by Country 2025 & 2033
- Figure 19: Asia Pacific Specialty Paper Industry Revenue Share (%), by Country 2025 & 2033
- Figure 20: Latin America Specialty Paper Industry Revenue (billion), by Type 2025 & 2033
- Figure 21: Latin America Specialty Paper Industry Revenue Share (%), by Type 2025 & 2033
- Figure 22: Latin America Specialty Paper Industry Revenue (billion), by End-user Industry 2025 & 2033
- Figure 23: Latin America Specialty Paper Industry Revenue Share (%), by End-user Industry 2025 & 2033
- Figure 24: Latin America Specialty Paper Industry Revenue (billion), by Country 2025 & 2033
- Figure 25: Latin America Specialty Paper Industry Revenue Share (%), by Country 2025 & 2033
- Figure 26: Middle East and Africa Specialty Paper Industry Revenue (billion), by Type 2025 & 2033
- Figure 27: Middle East and Africa Specialty Paper Industry Revenue Share (%), by Type 2025 & 2033
- Figure 28: Middle East and Africa Specialty Paper Industry Revenue (billion), by End-user Industry 2025 & 2033
- Figure 29: Middle East and Africa Specialty Paper Industry Revenue Share (%), by End-user Industry 2025 & 2033
- Figure 30: Middle East and Africa Specialty Paper Industry Revenue (billion), by Country 2025 & 2033
- Figure 31: Middle East and Africa Specialty Paper Industry Revenue Share (%), by Country 2025 & 2033
List of Tables
- Table 1: Global Specialty Paper Industry Revenue billion Forecast, by Type 2020 & 2033
- Table 2: Global Specialty Paper Industry Revenue billion Forecast, by End-user Industry 2020 & 2033
- Table 3: Global Specialty Paper Industry Revenue billion Forecast, by Region 2020 & 2033
- Table 4: Global Specialty Paper Industry Revenue billion Forecast, by Type 2020 & 2033
- Table 5: Global Specialty Paper Industry Revenue billion Forecast, by End-user Industry 2020 & 2033
- Table 6: Global Specialty Paper Industry Revenue billion Forecast, by Country 2020 & 2033
- Table 7: United States Specialty Paper Industry Revenue (billion) Forecast, by Application 2020 & 2033
- Table 8: Canada Specialty Paper Industry Revenue (billion) Forecast, by Application 2020 & 2033
- Table 9: Global Specialty Paper Industry Revenue billion Forecast, by Type 2020 & 2033
- Table 10: Global Specialty Paper Industry Revenue billion Forecast, by End-user Industry 2020 & 2033
- Table 11: Global Specialty Paper Industry Revenue billion Forecast, by Country 2020 & 2033
- Table 12: Germany Specialty Paper Industry Revenue (billion) Forecast, by Application 2020 & 2033
- Table 13: United Kingdom Specialty Paper Industry Revenue (billion) Forecast, by Application 2020 & 2033
- Table 14: France Specialty Paper Industry Revenue (billion) Forecast, by Application 2020 & 2033
- Table 15: Rest of Europe Specialty Paper Industry Revenue (billion) Forecast, by Application 2020 & 2033
- Table 16: Global Specialty Paper Industry Revenue billion Forecast, by Type 2020 & 2033
- Table 17: Global Specialty Paper Industry Revenue billion Forecast, by End-user Industry 2020 & 2033
- Table 18: Global Specialty Paper Industry Revenue billion Forecast, by Country 2020 & 2033
- Table 19: China Specialty Paper Industry Revenue (billion) Forecast, by Application 2020 & 2033
- Table 20: India Specialty Paper Industry Revenue (billion) Forecast, by Application 2020 & 2033
- Table 21: Japan Specialty Paper Industry Revenue (billion) Forecast, by Application 2020 & 2033
- Table 22: Rest of Asia Pacific Specialty Paper Industry Revenue (billion) Forecast, by Application 2020 & 2033
- Table 23: Global Specialty Paper Industry Revenue billion Forecast, by Type 2020 & 2033
- Table 24: Global Specialty Paper Industry Revenue billion Forecast, by End-user Industry 2020 & 2033
- Table 25: Global Specialty Paper Industry Revenue billion Forecast, by Country 2020 & 2033
- Table 26: Brazil Specialty Paper Industry Revenue (billion) Forecast, by Application 2020 & 2033
- Table 27: Mexico Specialty Paper Industry Revenue (billion) Forecast, by Application 2020 & 2033
- Table 28: Rest of Latin America Specialty Paper Industry Revenue (billion) Forecast, by Application 2020 & 2033
- Table 29: Global Specialty Paper Industry Revenue billion Forecast, by Type 2020 & 2033
- Table 30: Global Specialty Paper Industry Revenue billion Forecast, by End-user Industry 2020 & 2033
- Table 31: Global Specialty Paper Industry Revenue billion Forecast, by Country 2020 & 2033
Frequently Asked Questions
1. What is the projected Compound Annual Growth Rate (CAGR) of the Specialty Paper Industry?
The projected CAGR is approximately 5.1%.
2. Which companies are prominent players in the Specialty Paper Industry?
Key companies in the market include BillerudKorsns AB*List Not Exhaustive, Stora Enso Oyj, LINTEC Corporation, Mondi Group PLC, Domtar Corporation, Sappi Limited, Nippon Paper Industries Co Ltd, ITC Limited, Twin Rivers Paper Company, Nordic Paper AS.
3. What are the main segments of the Specialty Paper Industry?
The market segments include Type, End-user Industry.
4. Can you provide details about the market size?
The market size is estimated to be USD 18 billion as of 2022.
5. What are some drivers contributing to market growth?
Rising Trend of Online Food Ordering; Changing Consumer Preference to Adopt Sustainable Decorative Lamination.
6. What are the notable trends driving market growth?
Food Service Industry is Expected to hold Significant Share.
7. Are there any restraints impacting market growth?
Greenhouse Gas Emission Due To Dairy Activities Leading To Legislative Issues.
8. Can you provide examples of recent developments in the market?
November 2022: Sappi North America announced the investment of USD 418 million in paper machine rebuilds at its Somerset Mill in Skowhegan. With this investment, the company is focusing on increasing Paper Machine No. 2's capacity to produce solid bleached sulfate board products, a sustainable alternative to plastic packaging. This move of the company indicates its long-term Thrive25 strategy, which focuses on growing its portfolio in packaging and speciality papers, pulp, and biomaterials.
9. What pricing options are available for accessing the report?
Pricing options include single-user, multi-user, and enterprise licenses priced at USD 4750, USD 5250, and USD 8750 respectively.
10. Is the market size provided in terms of value or volume?
The market size is provided in terms of value, measured in billion.
11. Are there any specific market keywords associated with the report?
Yes, the market keyword associated with the report is "Specialty Paper Industry," which aids in identifying and referencing the specific market segment covered.
12. How do I determine which pricing option suits my needs best?
The pricing options vary based on user requirements and access needs. Individual users may opt for single-user licenses, while businesses requiring broader access may choose multi-user or enterprise licenses for cost-effective access to the report.
13. Are there any additional resources or data provided in the Specialty Paper Industry report?
While the report offers comprehensive insights, it's advisable to review the specific contents or supplementary materials provided to ascertain if additional resources or data are available.
14. How can I stay updated on further developments or reports in the Specialty Paper Industry?
To stay informed about further developments, trends, and reports in the Specialty Paper Industry, consider subscribing to industry newsletters, following relevant companies and organizations, or regularly checking reputable industry news sources and publications.
Methodology
Step 1 - Identification of Relevant Samples Size from Population Database


Step 2 - Approaches for Defining Global Market Size (Value, Volume* & Price*)

Note*: In applicable scenarios
Step 3 - Data Sources
Primary Research
- Web Analytics
- Survey Reports
- Research Institute
- Latest Research Reports
- Opinion Leaders
Secondary Research
- Annual Reports
- White Paper
- Latest Press Release
- Industry Association
- Paid Database
- Investor Presentations

Step 4 - Data Triangulation
Involves using different sources of information in order to increase the validity of a study
These sources are likely to be stakeholders in a program - participants, other researchers, program staff, other community members, and so on.
Then we put all data in single framework & apply various statistical tools to find out the dynamic on the market.
During the analysis stage, feedback from the stakeholder groups would be compared to determine areas of agreement as well as areas of divergence