

Key Insights
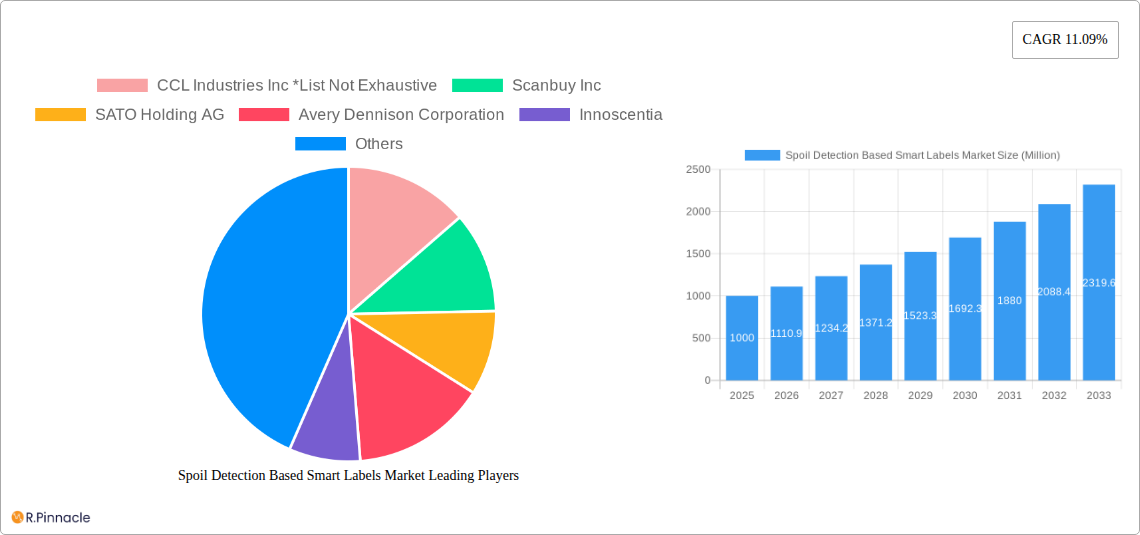
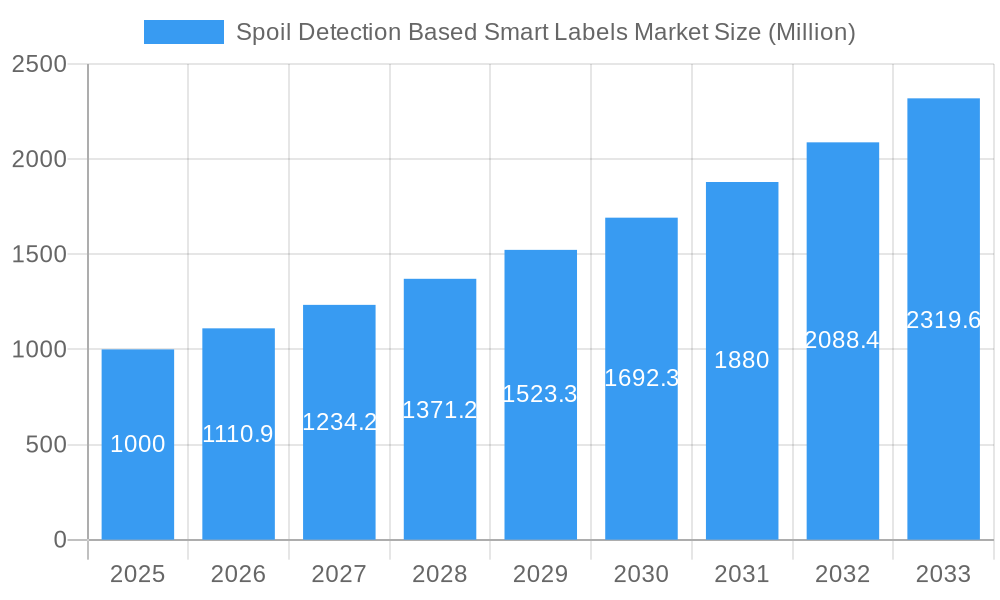
The Spoil Detection Based Smart Labels market is experiencing robust growth, projected to reach a market size of $1 billion by 2025, exhibiting a Compound Annual Growth Rate (CAGR) of 11.09% from 2025 to 2033. This expansion is fueled by several key drivers. Increasing consumer demand for fresh and high-quality food products necessitates effective spoilage detection methods. The rise of e-commerce and extended supply chains increases the risk of product spoilage during transit, creating a strong incentive for adoption of smart label technology. Furthermore, stringent government regulations regarding food safety and traceability are pushing companies to implement innovative solutions, driving market growth. Technological advancements in RFID, NFC, and sensing labels are making these solutions more cost-effective and user-friendly, further stimulating market adoption across various end-user industries such as pharmaceuticals, food and beverage, logistics, and cosmetics. The market is segmented geographically, with North America and Europe currently holding significant shares due to early adoption and robust regulatory frameworks. However, the Asia-Pacific region is projected to experience the fastest growth in the coming years, driven by increasing consumer awareness and economic growth.
Spoil Detection Based Smart Labels Market Market Size (In Billion)
The competitive landscape is dynamic, with key players including CCL Industries Inc., Scanbuy Inc., SATO Holding AG, Avery Dennison Corporation, and others continuously innovating to enhance the functionalities and applications of spoil detection smart labels. The market's future trajectory will likely depend on factors such as the development of more sophisticated sensing technologies, decreasing production costs, and the expansion of regulatory mandates across different regions. Focus will remain on improving the accuracy and reliability of spoilage detection, incorporating real-time data analytics, and seamlessly integrating smart labels into existing supply chain management systems. The market's growth potential is substantial, promising significant opportunities for both established players and emerging companies in the years to come.
Spoil Detection Based Smart Labels Market Company Market Share
Spoil Detection Based Smart Labels Market: A Comprehensive Report (2019-2033)
This in-depth report provides a comprehensive analysis of the Spoil Detection Based Smart Labels Market, offering invaluable insights for industry professionals, investors, and strategic decision-makers. With a focus on market dynamics, technological advancements, and competitive landscapes, this report covers the period from 2019 to 2033, with a base year of 2025 and a forecast period of 2025-2033. The report is meticulously structured to deliver actionable intelligence, supported by robust data and qualitative analysis. The global market value is projected to reach xx Million by 2033.
Spoil Detection Based Smart Labels Market Structure & Innovation Trends
This section analyzes the market's competitive landscape, identifying key players and their market share. The report examines the level of market concentration, pinpointing the dominance of major players such as CCL Industries Inc, Scanbuy Inc, SATO Holding AG, Avery Dennison Corporation, Innoscentia, SpotSee, Insignia Technologies, Zebra Technologies Corporation, Evigence Sensors, and Ensurge Micropower ASA. The report also explores the impact of mergers and acquisitions (M&A) activities, quantifying deal values where possible. Innovation drivers, such as the need for improved food safety and supply chain efficiency, are explored alongside regulatory frameworks and the presence of product substitutes. End-user demographics are analyzed to identify key market segments and their growth potential. Market share data for key players is included, along with an assessment of the overall market concentration. The total M&A deal value within the industry during the study period is estimated at xx Million.
Spoil Detection Based Smart Labels Market Dynamics & Trends
This section delves into the market's growth drivers, technological disruptions, consumer preferences, and competitive dynamics. Factors influencing market growth, including increased consumer awareness of food safety and the rising demand for efficient supply chain management, are meticulously analyzed. The Compound Annual Growth Rate (CAGR) for the forecast period is projected to be xx%, reflecting a robust market expansion. The report assesses the impact of technological advancements, such as RFID, sensing labels, and NFC technology, on market penetration rates. Specific examples of technological disruptions and their implications for the market are provided. A detailed competitive analysis highlights the strategies employed by key players to maintain their market share and gain a competitive edge. Market penetration rates for various technologies are projected, and their influence on market dynamics is thoroughly examined.
Dominant Regions & Segments in Spoil Detection Based Smart Labels Market
This section identifies the leading regions and segments within the spoil detection based smart labels market. The analysis considers geographic factors and end-user industries.
Leading Regions: The report identifies [Region Name] as the dominant region, supported by a thorough analysis of economic factors, infrastructure development, and consumer behavior. Detailed reasons for the dominance of this region are provided, including factors such as strong regulatory support, robust infrastructure, and high consumer awareness of food safety.
Leading End-user Industries: The pharmaceutical, food and beverage, and logistics industries are identified as major market segments. Factors driving growth in these segments include stringent quality control standards, the need to minimize product spoilage, and the demand for efficient supply chain management.
Leading Technologies: The report analyzes the dominance of different technologies, such as RFID, sensing labels, and NFC, within the market, assessing their respective strengths and weaknesses and forecasting their future market share.
The analysis includes a detailed discussion of the key drivers for each dominant segment and region, offering insights into future market potential.
Spoil Detection Based Smart Labels Market Product Innovations
Recent product developments have focused on enhancing the accuracy, reliability, and ease of use of spoil detection smart labels. This includes advancements in sensing technology, improved data transmission capabilities, and the integration of smart label solutions with existing supply chain management systems. Technological trends, such as the miniaturization of sensors and the development of more energy-efficient solutions, are driving innovation. The market fit of new products is assessed based on factors such as cost-effectiveness, ease of integration, and consumer acceptance.
Report Scope & Segmentation Analysis
This report segments the Spoil Detection Based Smart Labels Market based on technology (RFID, Sensing Label, NFC) and end-user industry (Pharmaceutical, Food and Beverage, Logistics, Cosmetics, Other). Each segment's market size, growth projections, and competitive dynamics are individually analyzed.
By Technology:
RFID: The RFID segment is expected to experience substantial growth due to its ability to provide real-time tracking and monitoring of products. Market size and growth projections are provided.
Sensing Label: The sensing label segment offers cost-effective solutions for various applications. Market dynamics and future outlook are presented.
NFC: NFC technology is gaining traction due to its ease of use and integration with mobile devices. Market size projections and competitive insights are included.
By End-User Industry:
Each end-user industry segment is discussed with growth projections and competitive analysis.
Key Drivers of Spoil Detection Based Smart Labels Market Growth
Several factors drive market growth, including:
Stringent Food Safety Regulations: Growing concerns over food safety and quality have led to stricter regulations, boosting demand for reliable spoil detection solutions.
Technological Advancements: Continuous innovations in sensor technology and data analytics enhance the accuracy and efficiency of spoil detection systems.
Rising Demand for Supply Chain Efficiency: Businesses are increasingly focusing on optimizing their supply chain operations to minimize waste and improve product quality.
Challenges in the Spoil Detection Based Smart Labels Market Sector
Several challenges hinder market growth:
High Initial Investment Costs: The implementation of smart label technology can involve significant upfront costs, deterring smaller businesses.
Interoperability Issues: Lack of standardization across different technologies can limit interoperability and data exchange.
Data Security Concerns: The collection and storage of sensitive product data raise concerns about data security and privacy.
Emerging Opportunities in Spoil Detection Based Smart Labels Market
Several emerging opportunities exist:
Expansion into New Markets: The application of smart labels is expanding beyond traditional industries, creating new market segments.
Integration with IoT Platforms: Connecting smart labels to the Internet of Things (IoT) enhances data management and analytics capabilities.
Development of Advanced Sensing Technologies: Advancements in biosensors and other technologies can improve the accuracy and sensitivity of spoil detection.
Leading Players in the Spoil Detection Based Smart Labels Market Market
- CCL Industries Inc
- Scanbuy Inc
- SATO Holding AG
- Avery Dennison Corporation
- Innoscentia
- SpotSee
- Insignia Technologies
- Zebra Technologies Corporation
- Evigence Sensors
- Ensurge Micropower ASA
Key Developments in Spoil Detection Based Smart Labels Market Industry
- April 2022: Avery Dennison opens a new manufacturing facility in Greater Noida, India, enhancing production capacity and efficiency.
- April 2022: SpotSee launches FreezeSafe, a low-cost temperature indicator for improved supply chain monitoring.
- December 2021: SpotSee introduces the Vaccine Vial Indicator for cold chain maintenance.
- September 2021: Timestrip UK Limited launches the VFM-7C vaccine freezer monitor to prevent wastage.
Future Outlook for Spoil Detection Based Smart Labels Market Market
The future of the Spoil Detection Based Smart Labels Market looks promising, driven by technological advancements, increasing consumer demand for food safety, and the growing need for efficient supply chain management. The market is poised for significant growth, with opportunities for innovation and expansion into new sectors and geographies. Strategic partnerships and investments in research and development will further fuel market expansion.
Spoil Detection Based Smart Labels Market Segmentation
-
1. Technology (Qualitative Trend Analysis)
- 1.1. RFID
- 1.2. Sensing Label
- 1.3. NFC
-
2. End-user Industry
- 2.1. Pharmaceutical
- 2.2. Food and Beverage
- 2.3. Logistics
- 2.4. Cosmetics
- 2.5. Other End-user Industries
Spoil Detection Based Smart Labels Market Segmentation By Geography
-
1. North America
- 1.1. United States
- 1.2. Canada
-
2. Europe
- 2.1. Germany
- 2.2. United Kingdom
- 2.3. France
- 2.4. Rest of Europe
-
3. Asia Pacific
- 3.1. China
- 3.2. Japan
- 3.3. India
- 3.4. Rest of Asia Pacific
- 4. Latin America
- 5. Middle East and Africa
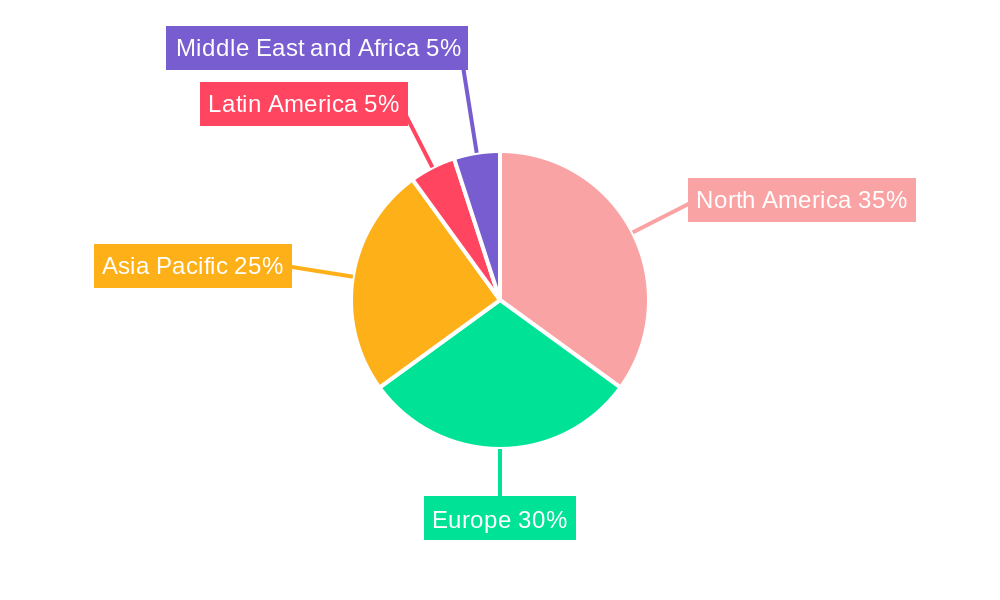
Spoil Detection Based Smart Labels Market Regional Market Share
Geographic Coverage of Spoil Detection Based Smart Labels Market
Spoil Detection Based Smart Labels Market REPORT HIGHLIGHTS
| Aspects | Details |
|---|---|
| Study Period | 2020-2034 |
| Base Year | 2025 |
| Estimated Year | 2026 |
| Forecast Period | 2026-2034 |
| Historical Period | 2020-2025 |
| Growth Rate | CAGR of 11.09% from 2020-2034 |
| Segmentation |
|
Table of Contents
- 1. Introduction
- 1.1. Research Scope
- 1.2. Market Segmentation
- 1.3. Research Objective
- 1.4. Definitions and Assumptions
- 2. Executive Summary
- 2.1. Market Snapshot
- 3. Market Dynamics
- 3.1. Market Drivers
- 3.2. Market Restrains
- 3.3. Market Trends
- 3.4. Market Opportunities
- 4. Market Factor Analysis
- 4.1. Porters Five Forces
- 4.1.1. Bargaining Power of Suppliers
- 4.1.2. Bargaining Power of Buyers
- 4.1.3. Threat of New Entrants
- 4.1.4. Threat of Substitutes
- 4.1.5. Competitive Rivalry
- 4.2. PESTEL analysis
- 4.3. BCG Analysis
- 4.3.1. Stars (High Growth, High Market Share)
- 4.3.2. Cash Cows (Low Growth, High Market Share)
- 4.3.3. Question Mark (High Growth, Low Market Share)
- 4.3.4. Dogs (Low Growth, Low Market Share)
- 4.4. Ansoff Matrix Analysis
- 4.5. Supply Chain Analysis
- 4.6. Regulatory Landscape
- 4.7. Current Market Potential and Opportunity Assessment (TAM–SAM–SOM Framework)
- 4.8. PRI Analyst Note
- 4.1. Porters Five Forces
- 5. Market Analysis, Insights and Forecast 2021-2033
- 5.1. Market Analysis, Insights and Forecast - by Technology (Qualitative Trend Analysis)
- 5.1.1. RFID
- 5.1.2. Sensing Label
- 5.1.3. NFC
- 5.2. Market Analysis, Insights and Forecast - by End-user Industry
- 5.2.1. Pharmaceutical
- 5.2.2. Food and Beverage
- 5.2.3. Logistics
- 5.2.4. Cosmetics
- 5.2.5. Other End-user Industries
- 5.3. Market Analysis, Insights and Forecast - by Region
- 5.3.1. North America
- 5.3.2. Europe
- 5.3.3. Asia Pacific
- 5.3.4. Latin America
- 5.3.5. Middle East and Africa
- 5.1. Market Analysis, Insights and Forecast - by Technology (Qualitative Trend Analysis)
- 6. Global Spoil Detection Based Smart Labels Market Analysis, Insights and Forecast, 2021-2033
- 6.1. Market Analysis, Insights and Forecast - by Technology (Qualitative Trend Analysis)
- 6.1.1. RFID
- 6.1.2. Sensing Label
- 6.1.3. NFC
- 6.2. Market Analysis, Insights and Forecast - by End-user Industry
- 6.2.1. Pharmaceutical
- 6.2.2. Food and Beverage
- 6.2.3. Logistics
- 6.2.4. Cosmetics
- 6.2.5. Other End-user Industries
- 6.1. Market Analysis, Insights and Forecast - by Technology (Qualitative Trend Analysis)
- 7. North America Spoil Detection Based Smart Labels Market Analysis, Insights and Forecast, 2020-2032
- 7.1. Market Analysis, Insights and Forecast - by Technology (Qualitative Trend Analysis)
- 7.1.1. RFID
- 7.1.2. Sensing Label
- 7.1.3. NFC
- 7.2. Market Analysis, Insights and Forecast - by End-user Industry
- 7.2.1. Pharmaceutical
- 7.2.2. Food and Beverage
- 7.2.3. Logistics
- 7.2.4. Cosmetics
- 7.2.5. Other End-user Industries
- 7.1. Market Analysis, Insights and Forecast - by Technology (Qualitative Trend Analysis)
- 8. Europe Spoil Detection Based Smart Labels Market Analysis, Insights and Forecast, 2020-2032
- 8.1. Market Analysis, Insights and Forecast - by Technology (Qualitative Trend Analysis)
- 8.1.1. RFID
- 8.1.2. Sensing Label
- 8.1.3. NFC
- 8.2. Market Analysis, Insights and Forecast - by End-user Industry
- 8.2.1. Pharmaceutical
- 8.2.2. Food and Beverage
- 8.2.3. Logistics
- 8.2.4. Cosmetics
- 8.2.5. Other End-user Industries
- 8.1. Market Analysis, Insights and Forecast - by Technology (Qualitative Trend Analysis)
- 9. Asia Pacific Spoil Detection Based Smart Labels Market Analysis, Insights and Forecast, 2020-2032
- 9.1. Market Analysis, Insights and Forecast - by Technology (Qualitative Trend Analysis)
- 9.1.1. RFID
- 9.1.2. Sensing Label
- 9.1.3. NFC
- 9.2. Market Analysis, Insights and Forecast - by End-user Industry
- 9.2.1. Pharmaceutical
- 9.2.2. Food and Beverage
- 9.2.3. Logistics
- 9.2.4. Cosmetics
- 9.2.5. Other End-user Industries
- 9.1. Market Analysis, Insights and Forecast - by Technology (Qualitative Trend Analysis)
- 10. Latin America Spoil Detection Based Smart Labels Market Analysis, Insights and Forecast, 2020-2032
- 10.1. Market Analysis, Insights and Forecast - by Technology (Qualitative Trend Analysis)
- 10.1.1. RFID
- 10.1.2. Sensing Label
- 10.1.3. NFC
- 10.2. Market Analysis, Insights and Forecast - by End-user Industry
- 10.2.1. Pharmaceutical
- 10.2.2. Food and Beverage
- 10.2.3. Logistics
- 10.2.4. Cosmetics
- 10.2.5. Other End-user Industries
- 10.1. Market Analysis, Insights and Forecast - by Technology (Qualitative Trend Analysis)
- 11. Middle East and Africa Spoil Detection Based Smart Labels Market Analysis, Insights and Forecast, 2020-2032
- 11.1. Market Analysis, Insights and Forecast - by Technology (Qualitative Trend Analysis)
- 11.1.1. RFID
- 11.1.2. Sensing Label
- 11.1.3. NFC
- 11.2. Market Analysis, Insights and Forecast - by End-user Industry
- 11.2.1. Pharmaceutical
- 11.2.2. Food and Beverage
- 11.2.3. Logistics
- 11.2.4. Cosmetics
- 11.2.5. Other End-user Industries
- 11.1. Market Analysis, Insights and Forecast - by Technology (Qualitative Trend Analysis)
- 12. Competitive Analysis
- 12.1. Company Profiles
- 12.1.1 CCL Industries Inc *List Not Exhaustive
- 12.1.1.1. Company Overview
- 12.1.1.2. Products
- 12.1.1.3. Company Financials
- 12.1.1.4. SWOT Analysis
- 12.1.2 Scanbuy Inc
- 12.1.2.1. Company Overview
- 12.1.2.2. Products
- 12.1.2.3. Company Financials
- 12.1.2.4. SWOT Analysis
- 12.1.3 SATO Holding AG
- 12.1.3.1. Company Overview
- 12.1.3.2. Products
- 12.1.3.3. Company Financials
- 12.1.3.4. SWOT Analysis
- 12.1.4 Avery Dennison Corporation
- 12.1.4.1. Company Overview
- 12.1.4.2. Products
- 12.1.4.3. Company Financials
- 12.1.4.4. SWOT Analysis
- 12.1.5 Innoscentia
- 12.1.5.1. Company Overview
- 12.1.5.2. Products
- 12.1.5.3. Company Financials
- 12.1.5.4. SWOT Analysis
- 12.1.6 SpotSee
- 12.1.6.1. Company Overview
- 12.1.6.2. Products
- 12.1.6.3. Company Financials
- 12.1.6.4. SWOT Analysis
- 12.1.7 Insignia Technologies
- 12.1.7.1. Company Overview
- 12.1.7.2. Products
- 12.1.7.3. Company Financials
- 12.1.7.4. SWOT Analysis
- 12.1.8 Zebra Technologies Corporation
- 12.1.8.1. Company Overview
- 12.1.8.2. Products
- 12.1.8.3. Company Financials
- 12.1.8.4. SWOT Analysis
- 12.1.9 Evigence Sensors
- 12.1.9.1. Company Overview
- 12.1.9.2. Products
- 12.1.9.3. Company Financials
- 12.1.9.4. SWOT Analysis
- 12.1.10 Ensurge Micropower ASA
- 12.1.10.1. Company Overview
- 12.1.10.2. Products
- 12.1.10.3. Company Financials
- 12.1.10.4. SWOT Analysis
- 12.1.1 CCL Industries Inc *List Not Exhaustive
- 12.2. Market Entropy
- 12.2.1 Company's Key Areas Served
- 12.2.2 Recent Developments
- 12.3. Company Market Share Analysis 2025
- 12.3.1 Top 5 Companies Market Share Analysis
- 12.3.2 Top 3 Companies Market Share Analysis
- 12.4. List of Potential Customers
- 13. Research Methodology
List of Figures
- Figure 1: Global Spoil Detection Based Smart Labels Market Revenue Breakdown (Million, %) by Region 2025 & 2033
- Figure 2: North America Spoil Detection Based Smart Labels Market Revenue (Million), by Technology (Qualitative Trend Analysis) 2025 & 2033
- Figure 3: North America Spoil Detection Based Smart Labels Market Revenue Share (%), by Technology (Qualitative Trend Analysis) 2025 & 2033
- Figure 4: North America Spoil Detection Based Smart Labels Market Revenue (Million), by End-user Industry 2025 & 2033
- Figure 5: North America Spoil Detection Based Smart Labels Market Revenue Share (%), by End-user Industry 2025 & 2033
- Figure 6: North America Spoil Detection Based Smart Labels Market Revenue (Million), by Country 2025 & 2033
- Figure 7: North America Spoil Detection Based Smart Labels Market Revenue Share (%), by Country 2025 & 2033
- Figure 8: Europe Spoil Detection Based Smart Labels Market Revenue (Million), by Technology (Qualitative Trend Analysis) 2025 & 2033
- Figure 9: Europe Spoil Detection Based Smart Labels Market Revenue Share (%), by Technology (Qualitative Trend Analysis) 2025 & 2033
- Figure 10: Europe Spoil Detection Based Smart Labels Market Revenue (Million), by End-user Industry 2025 & 2033
- Figure 11: Europe Spoil Detection Based Smart Labels Market Revenue Share (%), by End-user Industry 2025 & 2033
- Figure 12: Europe Spoil Detection Based Smart Labels Market Revenue (Million), by Country 2025 & 2033
- Figure 13: Europe Spoil Detection Based Smart Labels Market Revenue Share (%), by Country 2025 & 2033
- Figure 14: Asia Pacific Spoil Detection Based Smart Labels Market Revenue (Million), by Technology (Qualitative Trend Analysis) 2025 & 2033
- Figure 15: Asia Pacific Spoil Detection Based Smart Labels Market Revenue Share (%), by Technology (Qualitative Trend Analysis) 2025 & 2033
- Figure 16: Asia Pacific Spoil Detection Based Smart Labels Market Revenue (Million), by End-user Industry 2025 & 2033
- Figure 17: Asia Pacific Spoil Detection Based Smart Labels Market Revenue Share (%), by End-user Industry 2025 & 2033
- Figure 18: Asia Pacific Spoil Detection Based Smart Labels Market Revenue (Million), by Country 2025 & 2033
- Figure 19: Asia Pacific Spoil Detection Based Smart Labels Market Revenue Share (%), by Country 2025 & 2033
- Figure 20: Latin America Spoil Detection Based Smart Labels Market Revenue (Million), by Technology (Qualitative Trend Analysis) 2025 & 2033
- Figure 21: Latin America Spoil Detection Based Smart Labels Market Revenue Share (%), by Technology (Qualitative Trend Analysis) 2025 & 2033
- Figure 22: Latin America Spoil Detection Based Smart Labels Market Revenue (Million), by End-user Industry 2025 & 2033
- Figure 23: Latin America Spoil Detection Based Smart Labels Market Revenue Share (%), by End-user Industry 2025 & 2033
- Figure 24: Latin America Spoil Detection Based Smart Labels Market Revenue (Million), by Country 2025 & 2033
- Figure 25: Latin America Spoil Detection Based Smart Labels Market Revenue Share (%), by Country 2025 & 2033
- Figure 26: Middle East and Africa Spoil Detection Based Smart Labels Market Revenue (Million), by Technology (Qualitative Trend Analysis) 2025 & 2033
- Figure 27: Middle East and Africa Spoil Detection Based Smart Labels Market Revenue Share (%), by Technology (Qualitative Trend Analysis) 2025 & 2033
- Figure 28: Middle East and Africa Spoil Detection Based Smart Labels Market Revenue (Million), by End-user Industry 2025 & 2033
- Figure 29: Middle East and Africa Spoil Detection Based Smart Labels Market Revenue Share (%), by End-user Industry 2025 & 2033
- Figure 30: Middle East and Africa Spoil Detection Based Smart Labels Market Revenue (Million), by Country 2025 & 2033
- Figure 31: Middle East and Africa Spoil Detection Based Smart Labels Market Revenue Share (%), by Country 2025 & 2033
List of Tables
- Table 1: Global Spoil Detection Based Smart Labels Market Revenue Million Forecast, by Technology (Qualitative Trend Analysis) 2020 & 2033
- Table 2: Global Spoil Detection Based Smart Labels Market Revenue Million Forecast, by End-user Industry 2020 & 2033
- Table 3: Global Spoil Detection Based Smart Labels Market Revenue Million Forecast, by Region 2020 & 2033
- Table 4: Global Spoil Detection Based Smart Labels Market Revenue Million Forecast, by Technology (Qualitative Trend Analysis) 2020 & 2033
- Table 5: Global Spoil Detection Based Smart Labels Market Revenue Million Forecast, by End-user Industry 2020 & 2033
- Table 6: Global Spoil Detection Based Smart Labels Market Revenue Million Forecast, by Country 2020 & 2033
- Table 7: United States Spoil Detection Based Smart Labels Market Revenue (Million) Forecast, by Application 2020 & 2033
- Table 8: Canada Spoil Detection Based Smart Labels Market Revenue (Million) Forecast, by Application 2020 & 2033
- Table 9: Global Spoil Detection Based Smart Labels Market Revenue Million Forecast, by Technology (Qualitative Trend Analysis) 2020 & 2033
- Table 10: Global Spoil Detection Based Smart Labels Market Revenue Million Forecast, by End-user Industry 2020 & 2033
- Table 11: Global Spoil Detection Based Smart Labels Market Revenue Million Forecast, by Country 2020 & 2033
- Table 12: Germany Spoil Detection Based Smart Labels Market Revenue (Million) Forecast, by Application 2020 & 2033
- Table 13: United Kingdom Spoil Detection Based Smart Labels Market Revenue (Million) Forecast, by Application 2020 & 2033
- Table 14: France Spoil Detection Based Smart Labels Market Revenue (Million) Forecast, by Application 2020 & 2033
- Table 15: Rest of Europe Spoil Detection Based Smart Labels Market Revenue (Million) Forecast, by Application 2020 & 2033
- Table 16: Global Spoil Detection Based Smart Labels Market Revenue Million Forecast, by Technology (Qualitative Trend Analysis) 2020 & 2033
- Table 17: Global Spoil Detection Based Smart Labels Market Revenue Million Forecast, by End-user Industry 2020 & 2033
- Table 18: Global Spoil Detection Based Smart Labels Market Revenue Million Forecast, by Country 2020 & 2033
- Table 19: China Spoil Detection Based Smart Labels Market Revenue (Million) Forecast, by Application 2020 & 2033
- Table 20: Japan Spoil Detection Based Smart Labels Market Revenue (Million) Forecast, by Application 2020 & 2033
- Table 21: India Spoil Detection Based Smart Labels Market Revenue (Million) Forecast, by Application 2020 & 2033
- Table 22: Rest of Asia Pacific Spoil Detection Based Smart Labels Market Revenue (Million) Forecast, by Application 2020 & 2033
- Table 23: Global Spoil Detection Based Smart Labels Market Revenue Million Forecast, by Technology (Qualitative Trend Analysis) 2020 & 2033
- Table 24: Global Spoil Detection Based Smart Labels Market Revenue Million Forecast, by End-user Industry 2020 & 2033
- Table 25: Global Spoil Detection Based Smart Labels Market Revenue Million Forecast, by Country 2020 & 2033
- Table 26: Global Spoil Detection Based Smart Labels Market Revenue Million Forecast, by Technology (Qualitative Trend Analysis) 2020 & 2033
- Table 27: Global Spoil Detection Based Smart Labels Market Revenue Million Forecast, by End-user Industry 2020 & 2033
- Table 28: Global Spoil Detection Based Smart Labels Market Revenue Million Forecast, by Country 2020 & 2033
Frequently Asked Questions
1. What is the projected Compound Annual Growth Rate (CAGR) of the Spoil Detection Based Smart Labels Market?
The projected CAGR is approximately 11.09%.
2. Which companies are prominent players in the Spoil Detection Based Smart Labels Market?
Key companies in the market include CCL Industries Inc *List Not Exhaustive, Scanbuy Inc, SATO Holding AG, Avery Dennison Corporation, Innoscentia, SpotSee, Insignia Technologies, Zebra Technologies Corporation, Evigence Sensors, Ensurge Micropower ASA.
3. What are the main segments of the Spoil Detection Based Smart Labels Market?
The market segments include Technology (Qualitative Trend Analysis), End-user Industry.
4. Can you provide details about the market size?
The market size is estimated to be USD 1.00 Million as of 2022.
5. What are some drivers contributing to market growth?
Rising Need to Determine the Freshness of Products; Rising Consumer Preference for Hygienic Food Materials; Increasing Demand for Security and Tracking Solutions.
6. What are the notable trends driving market growth?
The RFID Segment is Expected to Hold a Major Market Share.
7. Are there any restraints impacting market growth?
Competition from Substitutes. such as Glass and Plastic Packaging.
8. Can you provide examples of recent developments in the market?
April 2022 - Avery Dennison, one of the leaders in global materials science and manufacturing, to commence operations in its new state-of-the-art manufacturing facility in Greater Noida. Through this new facility, the company will consolidate its manufacturing operations to serve customer demands better while optimizing the latest technology and leveraging improved efficiencies.
9. What pricing options are available for accessing the report?
Pricing options include single-user, multi-user, and enterprise licenses priced at USD 4750, USD 5250, and USD 8750 respectively.
10. Is the market size provided in terms of value or volume?
The market size is provided in terms of value, measured in Million.
11. Are there any specific market keywords associated with the report?
Yes, the market keyword associated with the report is "Spoil Detection Based Smart Labels Market," which aids in identifying and referencing the specific market segment covered.
12. How do I determine which pricing option suits my needs best?
The pricing options vary based on user requirements and access needs. Individual users may opt for single-user licenses, while businesses requiring broader access may choose multi-user or enterprise licenses for cost-effective access to the report.
13. Are there any additional resources or data provided in the Spoil Detection Based Smart Labels Market report?
While the report offers comprehensive insights, it's advisable to review the specific contents or supplementary materials provided to ascertain if additional resources or data are available.
14. How can I stay updated on further developments or reports in the Spoil Detection Based Smart Labels Market?
To stay informed about further developments, trends, and reports in the Spoil Detection Based Smart Labels Market, consider subscribing to industry newsletters, following relevant companies and organizations, or regularly checking reputable industry news sources and publications.
Methodology
Step 1 - Identification of Relevant Samples Size from Population Database


Step 2 - Approaches for Defining Global Market Size (Value, Volume* & Price*)

Note*: In applicable scenarios
Step 3 - Data Sources
Primary Research
- Web Analytics
- Survey Reports
- Research Institute
- Latest Research Reports
- Opinion Leaders
Secondary Research
- Annual Reports
- White Paper
- Latest Press Release
- Industry Association
- Paid Database
- Investor Presentations

Step 4 - Data Triangulation
Involves using different sources of information in order to increase the validity of a study
These sources are likely to be stakeholders in a program - participants, other researchers, program staff, other community members, and so on.
Then we put all data in single framework & apply various statistical tools to find out the dynamic on the market.
During the analysis stage, feedback from the stakeholder groups would be compared to determine areas of agreement as well as areas of divergence