

Key Insights
The global sports drink market, valued at $37.17 billion in 2025, is projected to achieve a robust compound annual growth rate (CAGR) of 6.54% from 2025 to 2033. This growth is primarily driven by increasing consumer health consciousness and a focus on hydration and electrolyte replenishment post-exercise. The expanding popularity of fitness and sports activities across all demographics, coupled with a greater understanding of sports drinks' benefits compared to conventional sugary beverages, significantly fuels market expansion. Innovative product development, including electrolyte-enhanced waters, protein-based drinks, and specialized functional beverages, further diversifies and propels the market. The integration of sports drinks into daily routines, beyond strenuous athletic performance, also contributes to their widespread adoption.
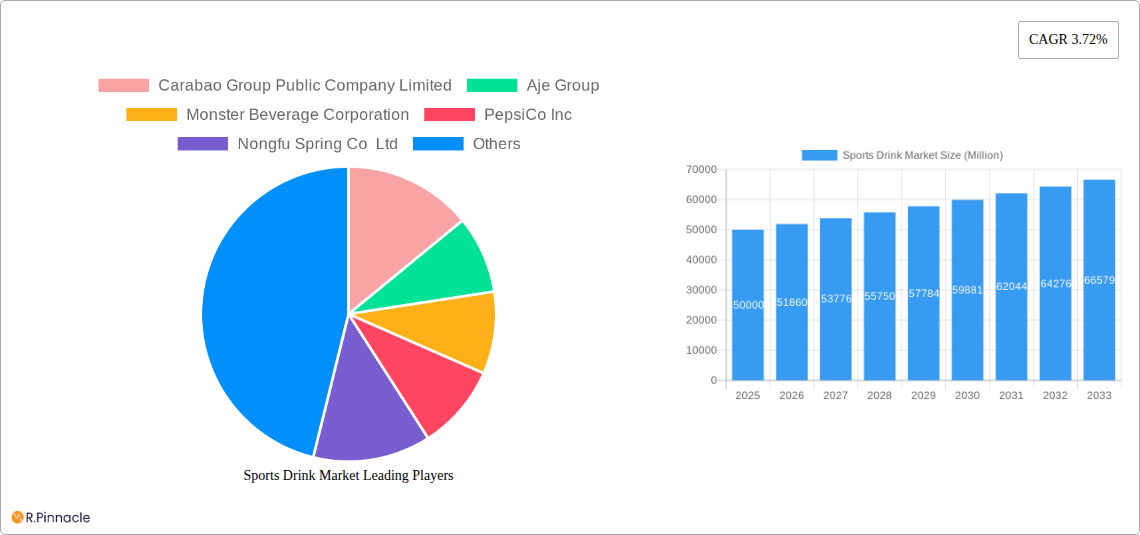
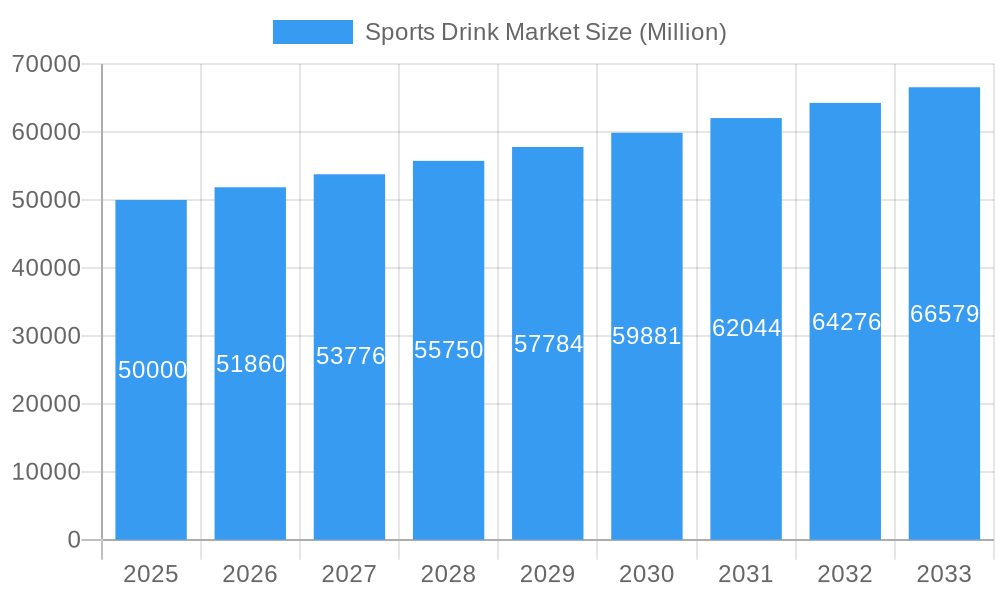
Sports Drink Market Market Size (In Billion)
Market segmentation by packaging (aseptic, metal cans, PET bottles), distribution channels (convenience stores, online, supermarkets), and drink types (isotonic, hypotonic, hypertonic, electrolyte-enhanced, protein-based) offers extensive opportunities for growth and penetration. The market is characterized by intense competition from established players like Coca-Cola, PepsiCo, and Monster Beverage, alongside regional and emerging brands, fostering continuous innovation and strategic marketing efforts.
Sports Drink Market Company Market Share
However, market expansion is tempered by certain restraints. Concerns regarding high sugar content and artificial sweeteners in some products may deter health-conscious consumers. The rising appeal of natural alternatives, such as coconut water and infused waters, presents a competitive challenge. Price volatility of raw materials, including sweeteners and electrolytes, can affect profitability and pricing. Additionally, stringent food safety and labeling regulations in various regions add compliance costs.
Despite these challenges, the sustained growth of the fitness and wellness industry, coupled with ongoing product innovation, indicates a positive outlook for the sports drink market. Significant market presence in developed economies like North America and Europe, alongside rapid expansion in emerging markets such as Asia-Pacific, promises a dynamic and broad landscape for future market engagement.
Sports Drink Market Report: 2019-2033 Forecast
This comprehensive report provides an in-depth analysis of the global sports drink market, covering the period 2019-2033. It offers actionable insights for industry professionals, investors, and strategic decision-makers seeking to navigate the dynamic landscape of this rapidly evolving sector. The report leverages extensive market research and data analysis to provide a clear picture of current market trends, future growth potential, and competitive dynamics. The total market value is projected to reach xx Million by 2033.
Sports Drink Market Structure & Innovation Trends
This section analyzes the competitive landscape of the sports drink market, encompassing market concentration, innovation drivers, regulatory frameworks, and key industry activities (M&A). The global sports drink market is characterized by a mix of established multinational corporations and emerging regional players. Key players include PepsiCo Inc., The Coca-Cola Company, Monster Beverage Corporation, and others.
- Market Concentration: The market exhibits moderate concentration, with the top five players holding approximately xx% of the global market share in 2024. This concentration is likely to remain relatively stable over the forecast period.
- Innovation Drivers: Ongoing research and development into new formulations, functional ingredients (e.g., electrolytes, protein, vitamins), and sustainable packaging are key drivers of innovation.
- Regulatory Framework: Government regulations regarding labeling, ingredient safety, and marketing claims significantly impact the industry. Variations in regulations across different geographies create complexities for manufacturers.
- Product Substitutes: The market faces competition from other hydration beverages like bottled water, juices, and energy drinks, necessitating continuous product differentiation.
- End-User Demographics: The primary target audience comprises health-conscious consumers, athletes, and fitness enthusiasts, with a growing demand from the younger generation.
- M&A Activities: The past five years have witnessed several significant mergers and acquisitions, with deals valued at approximately xx Million, primarily focused on expanding product portfolios and market reach.
Sports Drink Market Dynamics & Trends
The global sports drink market is experiencing robust growth, driven by several key factors. The Compound Annual Growth Rate (CAGR) from 2025-2033 is estimated to be xx%. Increased consumer awareness of health and fitness, expanding urbanization and rising disposable incomes in developing economies, and the growing popularity of sports and fitness activities are all contributing to market expansion. The market penetration of sports drinks within the broader beverage industry is steadily increasing. Technological advancements in production and packaging, alongside evolving consumer preferences for natural and functional ingredients, are shaping the market landscape. Intense competition among major players drives innovation and influences pricing strategies.
Dominant Regions & Segments in Sports Drink Market
The North American region dominates the global sports drink market, with significant contributions from the United States and Canada. However, Asia-Pacific and Europe are experiencing rapid growth.
- Dominant Regions: North America (US, Canada) maintains its leading position due to high consumption rates and established market infrastructure. Asia-Pacific shows strong growth potential fueled by increasing disposable incomes and a rising health-conscious population.
- Dominant Packaging Type: PET bottles hold the largest market share due to affordability, convenience, and recyclability. However, growth in aseptic packages and metal cans is expected, driven by extended shelf-life and premium positioning.
- Dominant Distribution Channel: Supermarket/Hypermarkets are the leading distribution channel, offering significant retail space and reach. However, the convenience store segment is growing, benefiting from the convenience offered by these locations.
- Dominant Soft Drink Type: Isotonic sports drinks remain dominant, fulfilling the need for efficient hydration and electrolyte replenishment. Growth in protein-based sports drinks is also projected.
Key Drivers of Regional Dominance:
- North America: Well-established distribution networks, high consumer spending power, and a robust fitness culture.
- Asia-Pacific: Rising disposable incomes, a burgeoning young population, and increasing health awareness.
- Europe: A mature market with established brands and a focus on healthy and functional beverages.
Sports Drink Market Product Innovations
Recent years have witnessed significant product innovation in the sports drink market. The focus is on developing drinks with enhanced functionality, natural ingredients, and improved taste profiles. Key trends include electrolyte-enhanced water, low-sugar formulations, protein-based options, and innovative packaging solutions to enhance shelf life and reduce environmental impact.
Report Scope & Segmentation Analysis
The report provides a detailed segmentation analysis of the sports drink market, encompassing:
- Packaging Type: Aseptic packages, Metal Can, PET Bottles. Each segment's growth projections, market sizes, and competitive dynamics are detailed within the full report.
- Sub Distribution Channel: Convenience Stores, Online Retail, Specialty Stores, Supermarket/Hypermarket, Others. Market shares and future growth prospects for each channel are analyzed.
- Soft Drink Type: Electrolyte-Enhanced Water, Hypertonic, Hypotonic, Isotonic, Protein-based Sport Drinks. The report provides detailed analysis of growth projections, market sizes, and competitive dynamics for each soft drink type.
Key Drivers of Sports Drink Market Growth
Several factors fuel the growth of the sports drink market: The rising health and fitness consciousness among consumers, the increasing prevalence of sports and athletic activities, and the development of innovative products with added functionalities and better taste profiles drive market expansion. Government regulations promoting healthier beverage options and the expansion of retail channels also contribute significantly.
Challenges in the Sports Drink Market Sector
The sports drink market faces challenges such as intense competition from established players and emerging brands, fluctuating raw material prices, and stringent regulatory requirements impacting production and labeling. Concerns regarding sugar content and artificial additives pose another challenge, pushing manufacturers towards healthier formulations. These factors can impact profitability and market share.
Emerging Opportunities in Sports Drink Market
Growing demand for functional and natural sports drinks, expanding into untapped markets, and capitalizing on the growth of e-commerce present significant opportunities. The development of new and innovative flavors, incorporating trending ingredients like CBD or adaptogens, can further attract health-conscious consumers and open new market segments.
Leading Players in the Sports Drink Market Market
- Carabao Group Public Company Limited
- Aje Group
- Monster Beverage Corporation
- PepsiCo Inc
- Nongfu Spring Co Ltd
- The Coca-Cola Company
- Abbott Laboratories
- Suntory Holdings Limited
- Seven & i Holdings Co Ltd
- Keurig Dr Pepper Inc
- Thai Beverages PCL
- Otsuka Holdings Co Ltd
- Congo Brands
Key Developments in Sports Drink Market Industry
- September 2023: Coca-Cola India launched Limca Sportz ION4, a new variant of its Limca Sportz sports drink.
- December 2023: Spar partnered with Congo Brands to distribute Prime drinks in its stores.
- February 2024: Pepsi Gatorade partnered with the top tier of Saudi Arabian soccer.
Future Outlook for Sports Drink Market Market
The sports drink market is poised for continued growth, driven by rising health awareness, increasing sports participation, and the development of functional and innovative products. Strategic partnerships, product diversification, and expansion into new markets will be crucial for success. The focus on natural ingredients, sustainable packaging, and customized products tailored to specific consumer needs will further drive market expansion.
Sports Drink Market Segmentation
-
1. Soft Drink Type
- 1.1. Electrolyte-Enhanced Water
- 1.2. Hypertonic
- 1.3. Hypotonic
- 1.4. Isotonic
- 1.5. Protein-based Sport Drinks
-
2. Packaging Type
- 2.1. Aseptic packages
- 2.2. Metal Can
- 2.3. PET Bottles
-
3. Sub Distribution Channel
- 3.1. Convenience Stores
- 3.2. Online Retail
- 3.3. Specialty Stores
- 3.4. Supermarket/Hypermarket
- 3.5. Others
Sports Drink Market Segmentation By Geography
-
1. North America
- 1.1. United States
- 1.2. Canada
- 1.3. Mexico
-
2. South America
- 2.1. Brazil
- 2.2. Argentina
- 2.3. Rest of South America
-
3. Europe
- 3.1. United Kingdom
- 3.2. Germany
- 3.3. France
- 3.4. Italy
- 3.5. Spain
- 3.6. Russia
- 3.7. Benelux
- 3.8. Nordics
- 3.9. Rest of Europe
-
4. Middle East & Africa
- 4.1. Turkey
- 4.2. Israel
- 4.3. GCC
- 4.4. North Africa
- 4.5. South Africa
- 4.6. Rest of Middle East & Africa
-
5. Asia Pacific
- 5.1. China
- 5.2. India
- 5.3. Japan
- 5.4. South Korea
- 5.5. ASEAN
- 5.6. Oceania
- 5.7. Rest of Asia Pacific
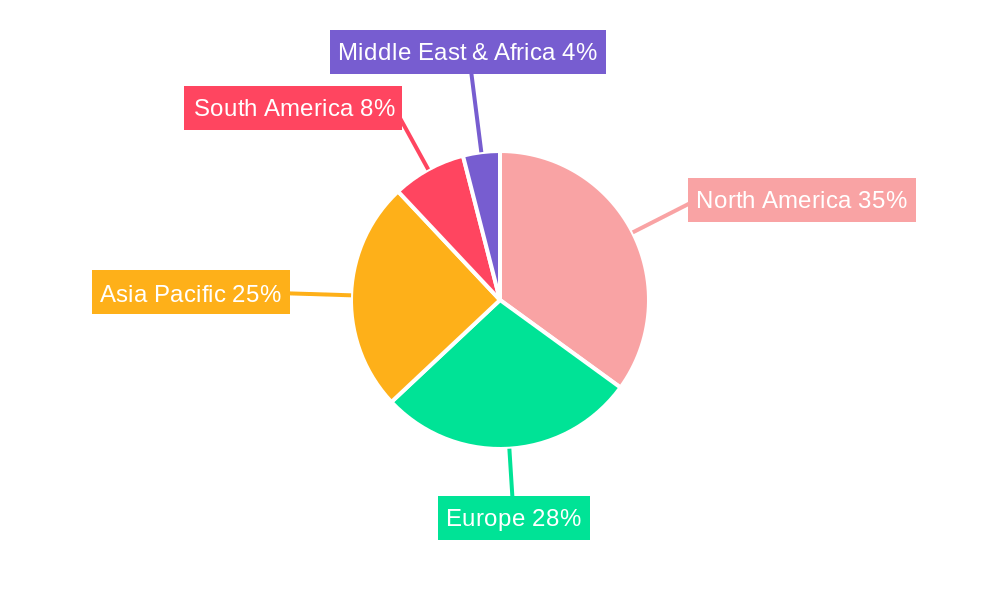
Sports Drink Market Regional Market Share
Geographic Coverage of Sports Drink Market
Sports Drink Market REPORT HIGHLIGHTS
| Aspects | Details |
|---|---|
| Study Period | 2020-2034 |
| Base Year | 2025 |
| Estimated Year | 2026 |
| Forecast Period | 2026-2034 |
| Historical Period | 2020-2025 |
| Growth Rate | CAGR of 6.54% from 2020-2034 |
| Segmentation |
|
Table of Contents
- 1. Introduction
- 1.1. Research Scope
- 1.2. Market Segmentation
- 1.3. Research Objective
- 1.4. Definitions and Assumptions
- 2. Executive Summary
- 2.1. Market Snapshot
- 3. Market Dynamics
- 3.1. Market Drivers
- 3.2. Market Restrains
- 3.3. Market Trends
- 3.4. Market Opportunities
- 4. Market Factor Analysis
- 4.1. Porters Five Forces
- 4.1.1. Bargaining Power of Suppliers
- 4.1.2. Bargaining Power of Buyers
- 4.1.3. Threat of New Entrants
- 4.1.4. Threat of Substitutes
- 4.1.5. Competitive Rivalry
- 4.2. PESTEL analysis
- 4.3. BCG Analysis
- 4.3.1. Stars (High Growth, High Market Share)
- 4.3.2. Cash Cows (Low Growth, High Market Share)
- 4.3.3. Question Mark (High Growth, Low Market Share)
- 4.3.4. Dogs (Low Growth, Low Market Share)
- 4.4. Ansoff Matrix Analysis
- 4.5. Supply Chain Analysis
- 4.6. Regulatory Landscape
- 4.7. Current Market Potential and Opportunity Assessment (TAM–SAM–SOM Framework)
- 4.8. PRI Analyst Note
- 4.1. Porters Five Forces
- 5. Market Analysis, Insights and Forecast 2021-2033
- 5.1. Market Analysis, Insights and Forecast - by Soft Drink Type
- 5.1.1. Electrolyte-Enhanced Water
- 5.1.2. Hypertonic
- 5.1.3. Hypotonic
- 5.1.4. Isotonic
- 5.1.5. Protein-based Sport Drinks
- 5.2. Market Analysis, Insights and Forecast - by Packaging Type
- 5.2.1. Aseptic packages
- 5.2.2. Metal Can
- 5.2.3. PET Bottles
- 5.3. Market Analysis, Insights and Forecast - by Sub Distribution Channel
- 5.3.1. Convenience Stores
- 5.3.2. Online Retail
- 5.3.3. Specialty Stores
- 5.3.4. Supermarket/Hypermarket
- 5.3.5. Others
- 5.4. Market Analysis, Insights and Forecast - by Region
- 5.4.1. North America
- 5.4.2. South America
- 5.4.3. Europe
- 5.4.4. Middle East & Africa
- 5.4.5. Asia Pacific
- 5.1. Market Analysis, Insights and Forecast - by Soft Drink Type
- 6. Global Sports Drink Market Analysis, Insights and Forecast, 2021-2033
- 6.1. Market Analysis, Insights and Forecast - by Soft Drink Type
- 6.1.1. Electrolyte-Enhanced Water
- 6.1.2. Hypertonic
- 6.1.3. Hypotonic
- 6.1.4. Isotonic
- 6.1.5. Protein-based Sport Drinks
- 6.2. Market Analysis, Insights and Forecast - by Packaging Type
- 6.2.1. Aseptic packages
- 6.2.2. Metal Can
- 6.2.3. PET Bottles
- 6.3. Market Analysis, Insights and Forecast - by Sub Distribution Channel
- 6.3.1. Convenience Stores
- 6.3.2. Online Retail
- 6.3.3. Specialty Stores
- 6.3.4. Supermarket/Hypermarket
- 6.3.5. Others
- 6.1. Market Analysis, Insights and Forecast - by Soft Drink Type
- 7. North America Sports Drink Market Analysis, Insights and Forecast, 2020-2032
- 7.1. Market Analysis, Insights and Forecast - by Soft Drink Type
- 7.1.1. Electrolyte-Enhanced Water
- 7.1.2. Hypertonic
- 7.1.3. Hypotonic
- 7.1.4. Isotonic
- 7.1.5. Protein-based Sport Drinks
- 7.2. Market Analysis, Insights and Forecast - by Packaging Type
- 7.2.1. Aseptic packages
- 7.2.2. Metal Can
- 7.2.3. PET Bottles
- 7.3. Market Analysis, Insights and Forecast - by Sub Distribution Channel
- 7.3.1. Convenience Stores
- 7.3.2. Online Retail
- 7.3.3. Specialty Stores
- 7.3.4. Supermarket/Hypermarket
- 7.3.5. Others
- 7.1. Market Analysis, Insights and Forecast - by Soft Drink Type
- 8. South America Sports Drink Market Analysis, Insights and Forecast, 2020-2032
- 8.1. Market Analysis, Insights and Forecast - by Soft Drink Type
- 8.1.1. Electrolyte-Enhanced Water
- 8.1.2. Hypertonic
- 8.1.3. Hypotonic
- 8.1.4. Isotonic
- 8.1.5. Protein-based Sport Drinks
- 8.2. Market Analysis, Insights and Forecast - by Packaging Type
- 8.2.1. Aseptic packages
- 8.2.2. Metal Can
- 8.2.3. PET Bottles
- 8.3. Market Analysis, Insights and Forecast - by Sub Distribution Channel
- 8.3.1. Convenience Stores
- 8.3.2. Online Retail
- 8.3.3. Specialty Stores
- 8.3.4. Supermarket/Hypermarket
- 8.3.5. Others
- 8.1. Market Analysis, Insights and Forecast - by Soft Drink Type
- 9. Europe Sports Drink Market Analysis, Insights and Forecast, 2020-2032
- 9.1. Market Analysis, Insights and Forecast - by Soft Drink Type
- 9.1.1. Electrolyte-Enhanced Water
- 9.1.2. Hypertonic
- 9.1.3. Hypotonic
- 9.1.4. Isotonic
- 9.1.5. Protein-based Sport Drinks
- 9.2. Market Analysis, Insights and Forecast - by Packaging Type
- 9.2.1. Aseptic packages
- 9.2.2. Metal Can
- 9.2.3. PET Bottles
- 9.3. Market Analysis, Insights and Forecast - by Sub Distribution Channel
- 9.3.1. Convenience Stores
- 9.3.2. Online Retail
- 9.3.3. Specialty Stores
- 9.3.4. Supermarket/Hypermarket
- 9.3.5. Others
- 9.1. Market Analysis, Insights and Forecast - by Soft Drink Type
- 10. Middle East & Africa Sports Drink Market Analysis, Insights and Forecast, 2020-2032
- 10.1. Market Analysis, Insights and Forecast - by Soft Drink Type
- 10.1.1. Electrolyte-Enhanced Water
- 10.1.2. Hypertonic
- 10.1.3. Hypotonic
- 10.1.4. Isotonic
- 10.1.5. Protein-based Sport Drinks
- 10.2. Market Analysis, Insights and Forecast - by Packaging Type
- 10.2.1. Aseptic packages
- 10.2.2. Metal Can
- 10.2.3. PET Bottles
- 10.3. Market Analysis, Insights and Forecast - by Sub Distribution Channel
- 10.3.1. Convenience Stores
- 10.3.2. Online Retail
- 10.3.3. Specialty Stores
- 10.3.4. Supermarket/Hypermarket
- 10.3.5. Others
- 10.1. Market Analysis, Insights and Forecast - by Soft Drink Type
- 11. Asia Pacific Sports Drink Market Analysis, Insights and Forecast, 2020-2032
- 11.1. Market Analysis, Insights and Forecast - by Soft Drink Type
- 11.1.1. Electrolyte-Enhanced Water
- 11.1.2. Hypertonic
- 11.1.3. Hypotonic
- 11.1.4. Isotonic
- 11.1.5. Protein-based Sport Drinks
- 11.2. Market Analysis, Insights and Forecast - by Packaging Type
- 11.2.1. Aseptic packages
- 11.2.2. Metal Can
- 11.2.3. PET Bottles
- 11.3. Market Analysis, Insights and Forecast - by Sub Distribution Channel
- 11.3.1. Convenience Stores
- 11.3.2. Online Retail
- 11.3.3. Specialty Stores
- 11.3.4. Supermarket/Hypermarket
- 11.3.5. Others
- 11.1. Market Analysis, Insights and Forecast - by Soft Drink Type
- 12. Competitive Analysis
- 12.1. Company Profiles
- 12.1.1 Carabao Group Public Company Limited
- 12.1.1.1. Company Overview
- 12.1.1.2. Products
- 12.1.1.3. Company Financials
- 12.1.1.4. SWOT Analysis
- 12.1.2 Aje Group
- 12.1.2.1. Company Overview
- 12.1.2.2. Products
- 12.1.2.3. Company Financials
- 12.1.2.4. SWOT Analysis
- 12.1.3 Monster Beverage Corporation
- 12.1.3.1. Company Overview
- 12.1.3.2. Products
- 12.1.3.3. Company Financials
- 12.1.3.4. SWOT Analysis
- 12.1.4 PepsiCo Inc
- 12.1.4.1. Company Overview
- 12.1.4.2. Products
- 12.1.4.3. Company Financials
- 12.1.4.4. SWOT Analysis
- 12.1.5 Nongfu Spring Co Ltd
- 12.1.5.1. Company Overview
- 12.1.5.2. Products
- 12.1.5.3. Company Financials
- 12.1.5.4. SWOT Analysis
- 12.1.6 The Coca-Cola Compan
- 12.1.6.1. Company Overview
- 12.1.6.2. Products
- 12.1.6.3. Company Financials
- 12.1.6.4. SWOT Analysis
- 12.1.7 Abbott Laboratories
- 12.1.7.1. Company Overview
- 12.1.7.2. Products
- 12.1.7.3. Company Financials
- 12.1.7.4. SWOT Analysis
- 12.1.8 Suntory Holdings Limited
- 12.1.8.1. Company Overview
- 12.1.8.2. Products
- 12.1.8.3. Company Financials
- 12.1.8.4. SWOT Analysis
- 12.1.9 Seven & i Holdings Co Ltd
- 12.1.9.1. Company Overview
- 12.1.9.2. Products
- 12.1.9.3. Company Financials
- 12.1.9.4. SWOT Analysis
- 12.1.10 Keurig Dr Pepper Inc
- 12.1.10.1. Company Overview
- 12.1.10.2. Products
- 12.1.10.3. Company Financials
- 12.1.10.4. SWOT Analysis
- 12.1.11 Thai Beverages PCL
- 12.1.11.1. Company Overview
- 12.1.11.2. Products
- 12.1.11.3. Company Financials
- 12.1.11.4. SWOT Analysis
- 12.1.12 Otsuka Holdings Co Ltd
- 12.1.12.1. Company Overview
- 12.1.12.2. Products
- 12.1.12.3. Company Financials
- 12.1.12.4. SWOT Analysis
- 12.1.13 Congo Brands
- 12.1.13.1. Company Overview
- 12.1.13.2. Products
- 12.1.13.3. Company Financials
- 12.1.13.4. SWOT Analysis
- 12.1.1 Carabao Group Public Company Limited
- 12.2. Market Entropy
- 12.2.1 Company's Key Areas Served
- 12.2.2 Recent Developments
- 12.3. Company Market Share Analysis 2025
- 12.3.1 Top 5 Companies Market Share Analysis
- 12.3.2 Top 3 Companies Market Share Analysis
- 12.4. List of Potential Customers
- 13. Research Methodology
List of Figures
- Figure 1: Global Sports Drink Market Revenue Breakdown (billion, %) by Region 2025 & 2033
- Figure 2: North America Sports Drink Market Revenue (billion), by Soft Drink Type 2025 & 2033
- Figure 3: North America Sports Drink Market Revenue Share (%), by Soft Drink Type 2025 & 2033
- Figure 4: North America Sports Drink Market Revenue (billion), by Packaging Type 2025 & 2033
- Figure 5: North America Sports Drink Market Revenue Share (%), by Packaging Type 2025 & 2033
- Figure 6: North America Sports Drink Market Revenue (billion), by Sub Distribution Channel 2025 & 2033
- Figure 7: North America Sports Drink Market Revenue Share (%), by Sub Distribution Channel 2025 & 2033
- Figure 8: North America Sports Drink Market Revenue (billion), by Country 2025 & 2033
- Figure 9: North America Sports Drink Market Revenue Share (%), by Country 2025 & 2033
- Figure 10: South America Sports Drink Market Revenue (billion), by Soft Drink Type 2025 & 2033
- Figure 11: South America Sports Drink Market Revenue Share (%), by Soft Drink Type 2025 & 2033
- Figure 12: South America Sports Drink Market Revenue (billion), by Packaging Type 2025 & 2033
- Figure 13: South America Sports Drink Market Revenue Share (%), by Packaging Type 2025 & 2033
- Figure 14: South America Sports Drink Market Revenue (billion), by Sub Distribution Channel 2025 & 2033
- Figure 15: South America Sports Drink Market Revenue Share (%), by Sub Distribution Channel 2025 & 2033
- Figure 16: South America Sports Drink Market Revenue (billion), by Country 2025 & 2033
- Figure 17: South America Sports Drink Market Revenue Share (%), by Country 2025 & 2033
- Figure 18: Europe Sports Drink Market Revenue (billion), by Soft Drink Type 2025 & 2033
- Figure 19: Europe Sports Drink Market Revenue Share (%), by Soft Drink Type 2025 & 2033
- Figure 20: Europe Sports Drink Market Revenue (billion), by Packaging Type 2025 & 2033
- Figure 21: Europe Sports Drink Market Revenue Share (%), by Packaging Type 2025 & 2033
- Figure 22: Europe Sports Drink Market Revenue (billion), by Sub Distribution Channel 2025 & 2033
- Figure 23: Europe Sports Drink Market Revenue Share (%), by Sub Distribution Channel 2025 & 2033
- Figure 24: Europe Sports Drink Market Revenue (billion), by Country 2025 & 2033
- Figure 25: Europe Sports Drink Market Revenue Share (%), by Country 2025 & 2033
- Figure 26: Middle East & Africa Sports Drink Market Revenue (billion), by Soft Drink Type 2025 & 2033
- Figure 27: Middle East & Africa Sports Drink Market Revenue Share (%), by Soft Drink Type 2025 & 2033
- Figure 28: Middle East & Africa Sports Drink Market Revenue (billion), by Packaging Type 2025 & 2033
- Figure 29: Middle East & Africa Sports Drink Market Revenue Share (%), by Packaging Type 2025 & 2033
- Figure 30: Middle East & Africa Sports Drink Market Revenue (billion), by Sub Distribution Channel 2025 & 2033
- Figure 31: Middle East & Africa Sports Drink Market Revenue Share (%), by Sub Distribution Channel 2025 & 2033
- Figure 32: Middle East & Africa Sports Drink Market Revenue (billion), by Country 2025 & 2033
- Figure 33: Middle East & Africa Sports Drink Market Revenue Share (%), by Country 2025 & 2033
- Figure 34: Asia Pacific Sports Drink Market Revenue (billion), by Soft Drink Type 2025 & 2033
- Figure 35: Asia Pacific Sports Drink Market Revenue Share (%), by Soft Drink Type 2025 & 2033
- Figure 36: Asia Pacific Sports Drink Market Revenue (billion), by Packaging Type 2025 & 2033
- Figure 37: Asia Pacific Sports Drink Market Revenue Share (%), by Packaging Type 2025 & 2033
- Figure 38: Asia Pacific Sports Drink Market Revenue (billion), by Sub Distribution Channel 2025 & 2033
- Figure 39: Asia Pacific Sports Drink Market Revenue Share (%), by Sub Distribution Channel 2025 & 2033
- Figure 40: Asia Pacific Sports Drink Market Revenue (billion), by Country 2025 & 2033
- Figure 41: Asia Pacific Sports Drink Market Revenue Share (%), by Country 2025 & 2033
List of Tables
- Table 1: Global Sports Drink Market Revenue billion Forecast, by Soft Drink Type 2020 & 2033
- Table 2: Global Sports Drink Market Revenue billion Forecast, by Packaging Type 2020 & 2033
- Table 3: Global Sports Drink Market Revenue billion Forecast, by Sub Distribution Channel 2020 & 2033
- Table 4: Global Sports Drink Market Revenue billion Forecast, by Region 2020 & 2033
- Table 5: Global Sports Drink Market Revenue billion Forecast, by Soft Drink Type 2020 & 2033
- Table 6: Global Sports Drink Market Revenue billion Forecast, by Packaging Type 2020 & 2033
- Table 7: Global Sports Drink Market Revenue billion Forecast, by Sub Distribution Channel 2020 & 2033
- Table 8: Global Sports Drink Market Revenue billion Forecast, by Country 2020 & 2033
- Table 9: United States Sports Drink Market Revenue (billion) Forecast, by Application 2020 & 2033
- Table 10: Canada Sports Drink Market Revenue (billion) Forecast, by Application 2020 & 2033
- Table 11: Mexico Sports Drink Market Revenue (billion) Forecast, by Application 2020 & 2033
- Table 12: Global Sports Drink Market Revenue billion Forecast, by Soft Drink Type 2020 & 2033
- Table 13: Global Sports Drink Market Revenue billion Forecast, by Packaging Type 2020 & 2033
- Table 14: Global Sports Drink Market Revenue billion Forecast, by Sub Distribution Channel 2020 & 2033
- Table 15: Global Sports Drink Market Revenue billion Forecast, by Country 2020 & 2033
- Table 16: Brazil Sports Drink Market Revenue (billion) Forecast, by Application 2020 & 2033
- Table 17: Argentina Sports Drink Market Revenue (billion) Forecast, by Application 2020 & 2033
- Table 18: Rest of South America Sports Drink Market Revenue (billion) Forecast, by Application 2020 & 2033
- Table 19: Global Sports Drink Market Revenue billion Forecast, by Soft Drink Type 2020 & 2033
- Table 20: Global Sports Drink Market Revenue billion Forecast, by Packaging Type 2020 & 2033
- Table 21: Global Sports Drink Market Revenue billion Forecast, by Sub Distribution Channel 2020 & 2033
- Table 22: Global Sports Drink Market Revenue billion Forecast, by Country 2020 & 2033
- Table 23: United Kingdom Sports Drink Market Revenue (billion) Forecast, by Application 2020 & 2033
- Table 24: Germany Sports Drink Market Revenue (billion) Forecast, by Application 2020 & 2033
- Table 25: France Sports Drink Market Revenue (billion) Forecast, by Application 2020 & 2033
- Table 26: Italy Sports Drink Market Revenue (billion) Forecast, by Application 2020 & 2033
- Table 27: Spain Sports Drink Market Revenue (billion) Forecast, by Application 2020 & 2033
- Table 28: Russia Sports Drink Market Revenue (billion) Forecast, by Application 2020 & 2033
- Table 29: Benelux Sports Drink Market Revenue (billion) Forecast, by Application 2020 & 2033
- Table 30: Nordics Sports Drink Market Revenue (billion) Forecast, by Application 2020 & 2033
- Table 31: Rest of Europe Sports Drink Market Revenue (billion) Forecast, by Application 2020 & 2033
- Table 32: Global Sports Drink Market Revenue billion Forecast, by Soft Drink Type 2020 & 2033
- Table 33: Global Sports Drink Market Revenue billion Forecast, by Packaging Type 2020 & 2033
- Table 34: Global Sports Drink Market Revenue billion Forecast, by Sub Distribution Channel 2020 & 2033
- Table 35: Global Sports Drink Market Revenue billion Forecast, by Country 2020 & 2033
- Table 36: Turkey Sports Drink Market Revenue (billion) Forecast, by Application 2020 & 2033
- Table 37: Israel Sports Drink Market Revenue (billion) Forecast, by Application 2020 & 2033
- Table 38: GCC Sports Drink Market Revenue (billion) Forecast, by Application 2020 & 2033
- Table 39: North Africa Sports Drink Market Revenue (billion) Forecast, by Application 2020 & 2033
- Table 40: South Africa Sports Drink Market Revenue (billion) Forecast, by Application 2020 & 2033
- Table 41: Rest of Middle East & Africa Sports Drink Market Revenue (billion) Forecast, by Application 2020 & 2033
- Table 42: Global Sports Drink Market Revenue billion Forecast, by Soft Drink Type 2020 & 2033
- Table 43: Global Sports Drink Market Revenue billion Forecast, by Packaging Type 2020 & 2033
- Table 44: Global Sports Drink Market Revenue billion Forecast, by Sub Distribution Channel 2020 & 2033
- Table 45: Global Sports Drink Market Revenue billion Forecast, by Country 2020 & 2033
- Table 46: China Sports Drink Market Revenue (billion) Forecast, by Application 2020 & 2033
- Table 47: India Sports Drink Market Revenue (billion) Forecast, by Application 2020 & 2033
- Table 48: Japan Sports Drink Market Revenue (billion) Forecast, by Application 2020 & 2033
- Table 49: South Korea Sports Drink Market Revenue (billion) Forecast, by Application 2020 & 2033
- Table 50: ASEAN Sports Drink Market Revenue (billion) Forecast, by Application 2020 & 2033
- Table 51: Oceania Sports Drink Market Revenue (billion) Forecast, by Application 2020 & 2033
- Table 52: Rest of Asia Pacific Sports Drink Market Revenue (billion) Forecast, by Application 2020 & 2033
Frequently Asked Questions
1. What is the projected Compound Annual Growth Rate (CAGR) of the Sports Drink Market?
The projected CAGR is approximately 6.54%.
2. Which companies are prominent players in the Sports Drink Market?
Key companies in the market include Carabao Group Public Company Limited, Aje Group, Monster Beverage Corporation, PepsiCo Inc, Nongfu Spring Co Ltd, The Coca-Cola Compan, Abbott Laboratories, Suntory Holdings Limited, Seven & i Holdings Co Ltd, Keurig Dr Pepper Inc, Thai Beverages PCL, Otsuka Holdings Co Ltd, Congo Brands.
3. What are the main segments of the Sports Drink Market?
The market segments include Soft Drink Type, Packaging Type, Sub Distribution Channel.
4. Can you provide details about the market size?
The market size is estimated to be USD 37.17 billion as of 2022.
5. What are some drivers contributing to market growth?
Rising Consumer Awareness about Health and Fitness; Increasing the Use of Casein and Caseinate in Food and Beverage Industry.
6. What are the notable trends driving market growth?
OTHER KEY INDUSTRY TRENDS COVERED IN THE REPORT.
7. Are there any restraints impacting market growth?
High Competition From Alternative Protein Sources.
8. Can you provide examples of recent developments in the market?
February 2024: Pepsi Gatorade has entered into a partnership with the top tier of Saudi Arabian soccer, becoming its official sports drink partner. The collaboration is focused on enhancing the matchday experience for fans through a series of activations and events.December 2023: Spar works with US distributor Congo Brands to bring Prime drinks to stores. The move makes Spar the first symbol group in the convenience channel to stock PrimeSeptember 2023: Limca Sportz, the sports drink from Coca-Cola India's home-grown brand Limca, is thrilled to announce the launch of its new variant Limca Sportz ION4 in India.
9. What pricing options are available for accessing the report?
Pricing options include single-user, multi-user, and enterprise licenses priced at USD 3800, USD 4500, and USD 5800 respectively.
10. Is the market size provided in terms of value or volume?
The market size is provided in terms of value, measured in billion.
11. Are there any specific market keywords associated with the report?
Yes, the market keyword associated with the report is "Sports Drink Market," which aids in identifying and referencing the specific market segment covered.
12. How do I determine which pricing option suits my needs best?
The pricing options vary based on user requirements and access needs. Individual users may opt for single-user licenses, while businesses requiring broader access may choose multi-user or enterprise licenses for cost-effective access to the report.
13. Are there any additional resources or data provided in the Sports Drink Market report?
While the report offers comprehensive insights, it's advisable to review the specific contents or supplementary materials provided to ascertain if additional resources or data are available.
14. How can I stay updated on further developments or reports in the Sports Drink Market?
To stay informed about further developments, trends, and reports in the Sports Drink Market, consider subscribing to industry newsletters, following relevant companies and organizations, or regularly checking reputable industry news sources and publications.
Methodology
Step 1 - Identification of Relevant Samples Size from Population Database


Step 2 - Approaches for Defining Global Market Size (Value, Volume* & Price*)

Note*: In applicable scenarios
Step 3 - Data Sources
Primary Research
- Web Analytics
- Survey Reports
- Research Institute
- Latest Research Reports
- Opinion Leaders
Secondary Research
- Annual Reports
- White Paper
- Latest Press Release
- Industry Association
- Paid Database
- Investor Presentations

Step 4 - Data Triangulation
Involves using different sources of information in order to increase the validity of a study
These sources are likely to be stakeholders in a program - participants, other researchers, program staff, other community members, and so on.
Then we put all data in single framework & apply various statistical tools to find out the dynamic on the market.
During the analysis stage, feedback from the stakeholder groups would be compared to determine areas of agreement as well as areas of divergence