

Key Insights
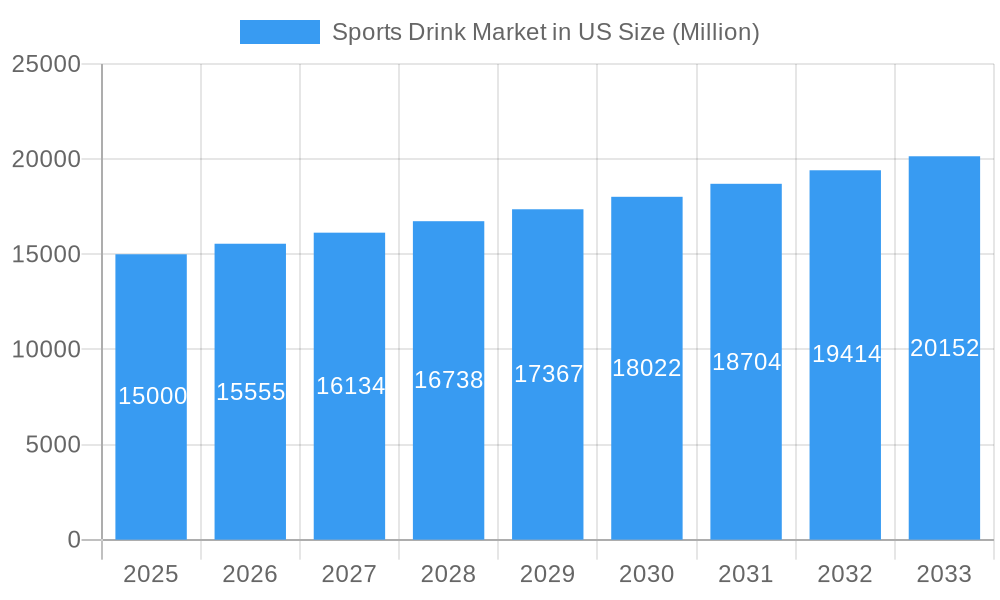
The US sports drink market is projected to reach $28.2 billion by 2024, expanding at a Compound Annual Growth Rate (CAGR) of 3.8%. This growth is propelled by escalating health consciousness, increased participation in fitness activities, and the rising demand for electrolyte-enhanced and protein-based beverages. Key growth drivers include electrolyte-enhanced water, appealing to health-conscious consumers seeking sugar-free hydration, and protein-based sports drinks, favored by athletes for muscle recovery and performance. Convenience stores and supermarkets/hypermarkets remain dominant distribution channels, though online retail is experiencing significant expansion. The competitive landscape features established players and emerging brands focused on innovation and niche products. A growing preference for healthier options, such as reduced sugar and natural ingredients, presents both challenges and opportunities for manufacturers, encouraging substantial investment in research and development for innovative product formulations.
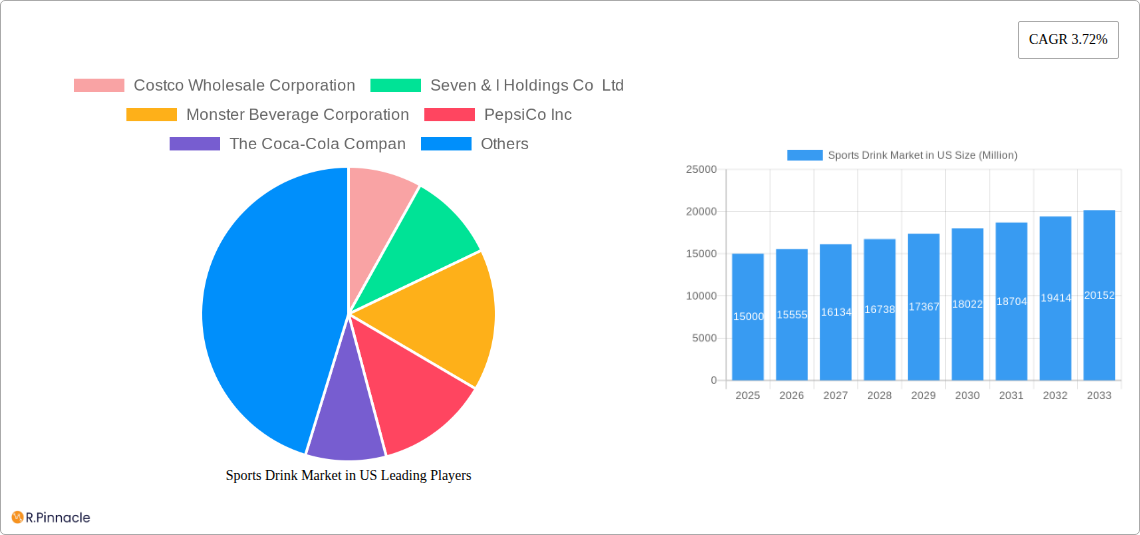
Sports Drink Market in US Market Size (In Billion)
Evolving consumer preferences for functional beverages, including those fortified with vitamins and minerals, will significantly influence market expansion. Increased competition from alternative hydration products like coconut water and enhanced water is anticipated. The aseptic packaging segment demonstrates strong potential due to extended shelf life and environmental benefits. Strategic partnerships and product diversification are crucial for maintaining a competitive advantage. Continued growth in the fitness and wellness sector will further fuel the sports drink market, with particular emphasis on segments offering natural ingredients and functional benefits tailored to specific athletic needs.
Sports Drink Market in US Company Market Share
Sports Drink Market in US: A Comprehensive Report (2019-2033)
This in-depth report provides a comprehensive analysis of the US sports drink market, covering market size, segmentation, key players, and future trends. Leveraging data from 2019-2024 (historical period), with 2025 as the base year, and projecting to 2033 (forecast period), this report is an essential resource for industry professionals, investors, and strategists. The study period encompasses critical market shifts, allowing for informed decision-making.
Sports Drink Market in US Market Structure & Innovation Trends
This section analyzes the competitive landscape, including market concentration, innovation drivers, regulatory influences, and market dynamics. The report examines the role of mergers and acquisitions (M&A) in shaping the market. Key metrics like market share and M&A deal values are included. Leading players such as PepsiCo Inc, The Coca-Cola Company, and Monster Beverage Corporation, along with emerging brands, are evaluated for their strategies and market positioning. The report details the impact of regulatory frameworks on product development and market access. Furthermore, the analysis delves into consumer demographics and preferences, identifying key trends influencing product innovation. The analysis also includes substitute products and their impact on market share. xx% of the market is controlled by the top 5 players. Recent M&A activity totalled approximately USD xx Million in 2024.
- Market Concentration: Highly concentrated with a few major players dominating.
- Innovation Drivers: Consumer demand for functional beverages and health-conscious products.
- Regulatory Framework: FDA regulations concerning labeling and ingredients.
- Product Substitutes: Water, juices, and other functional beverages.
- End-User Demographics: Focus on health-conscious consumers, athletes, and fitness enthusiasts.
- M&A Activities: Consolidation and expansion strategies amongst major players.
Sports Drink Market in US Market Dynamics & Trends
This section explores market growth drivers, technological disruptions, consumer preferences, and competitive dynamics within the US sports drink market. The report delves into the factors influencing market expansion, including evolving consumer preferences towards healthier options, the rising popularity of fitness and wellness activities, and the impact of technological advancements. The CAGR for the period 2025-2033 is estimated at xx%. Market penetration is anticipated to reach xx% by 2033. Detailed competitive analysis highlights the strategies employed by key players, including product diversification, strategic partnerships, and brand building initiatives.
Dominant Regions & Segments in Sports Drink Market in US
This section pinpoints the leading regions, countries, and market segments within the US sports drink market. Dominant segments are analyzed across Soft Drink Type (Electrolyte-Enhanced Water, Hypertonic, Hypotonic, Isotonic, Protein-based Sport Drinks), Packaging Type (Aseptic packages, Metal Can, PET Bottles), and Sub Distribution Channel (Convenience Stores, Online Retail, Specialty Stores, Supermarket/Hypermarket, Others). The analysis highlights key drivers specific to each segment's dominance.
Key Drivers (examples):
- Economic Policies: Tax incentives and subsidies for healthy food and beverage industries.
- Infrastructure: Distribution networks and logistics infrastructure influence market reach.
Dominance Analysis:
The PET Bottles segment holds the largest market share due to its cost-effectiveness and convenience. Convenience stores are the leading distribution channel, benefiting from high foot traffic and impulse purchases. Isotonic sports drinks dominate in terms of type, catering to the broad appeal of rehydration. The western region shows the highest growth due to xx.
Sports Drink Market in US Product Innovations
This section summarizes recent product developments, highlighting technological advancements, product applications, and competitive advantages in the US sports drink market. Key innovations are explored, demonstrating their impact on market positioning and competitive dynamics. The emphasis is on technological trends that are reshaping product offerings and consumer preferences.
Report Scope & Segmentation Analysis
This report segments the US sports drink market by Soft Drink Type (Electrolyte-Enhanced Water, Hypertonic, Hypotonic, Isotonic, Protein-based Sport Drinks), Packaging Type (Aseptic packages, Metal Can, PET Bottles), and Sub Distribution Channel (Convenience Stores, Online Retail, Specialty Stores, Supermarket/Hypermarket, Others). Each segment's growth projections, market sizes, and competitive dynamics are detailed. Market size projections are provided for each segment across the forecast period.
Key Drivers of Sports Drink Market in US Growth
The growth of the US sports drink market is driven by several key factors including: the rising prevalence of health-conscious consumers, increased participation in sports and fitness activities, the ongoing development of innovative product formulations (e.g., functional ingredients, enhanced hydration), and effective marketing and distribution strategies by major players. Government regulations concerning labeling and product claims also impact growth.
Challenges in the Sports Drink Market in US Sector
Challenges include intense competition, fluctuating raw material costs, evolving consumer preferences, and stringent regulatory requirements affecting product development and marketing. Supply chain disruptions can impact product availability and increase costs. Consumer preference shifts towards healthier, less sugary options create ongoing pressure on manufacturers.
Emerging Opportunities in Sports Drink Market in US
Emerging opportunities include the growing demand for functional sports drinks with added vitamins and minerals, the expansion of e-commerce channels, and the potential growth in niche markets, like plant-based sports drinks. New product development focusing on sustainability and eco-friendly packaging is another significant opportunity.
Leading Players in the Sports Drink Market in US Market
- Costco Wholesale Corporation
- Seven & I Holdings Co Ltd
- Monster Beverage Corporation
- PepsiCo Inc
- The Coca-Cola Company
- Abbott Laboratories
- Suntory Holdings Limited
- Keurig Dr Pepper Inc
- Pisa Global S A de C V
- Otsuka Holdings Co Ltd
- Bluetriton Brands Holdings Inc
- Congo Brands
Key Developments in Sports Drink Market in US Industry
- December 2023: Spar partners with Congo Brands to distribute Prime drinks, expanding Prime's reach into the convenience store sector.
- April 2023: Congo LLC invests USD 8.25 Million to expand its Louisville headquarters, creating 500 jobs. This signifies significant investment in the sector.
- February 2023: Core Hydration launches Core Hydration+, expanding its product line with nutrient-enhanced waters targeting health-conscious consumers.
Future Outlook for Sports Drink Market in US Market
The US sports drink market is poised for continued growth, driven by increasing health awareness, rising disposable incomes, and the expansion of e-commerce. Strategic partnerships, product innovation, and targeted marketing campaigns will be critical for success. The market's future is bright, with potential for further expansion into niche segments and international markets.
Sports Drink Market in US Segmentation
-
1. Soft Drink Type
- 1.1. Electrolyte-Enhanced Water
- 1.2. Hypertonic
- 1.3. Hypotonic
- 1.4. Isotonic
- 1.5. Protein-based Sport Drinks
-
2. Packaging Type
- 2.1. Aseptic packages
- 2.2. Metal Can
- 2.3. PET Bottles
-
3. Sub Distribution Channel
- 3.1. Convenience Stores
- 3.2. Online Retail
- 3.3. Specialty Stores
- 3.4. Supermarket/Hypermarket
- 3.5. Others
Sports Drink Market in US Segmentation By Geography
-
1. North America
- 1.1. United States
- 1.2. Canada
- 1.3. Mexico
-
2. South America
- 2.1. Brazil
- 2.2. Argentina
- 2.3. Rest of South America
-
3. Europe
- 3.1. United Kingdom
- 3.2. Germany
- 3.3. France
- 3.4. Italy
- 3.5. Spain
- 3.6. Russia
- 3.7. Benelux
- 3.8. Nordics
- 3.9. Rest of Europe
-
4. Middle East & Africa
- 4.1. Turkey
- 4.2. Israel
- 4.3. GCC
- 4.4. North Africa
- 4.5. South Africa
- 4.6. Rest of Middle East & Africa
-
5. Asia Pacific
- 5.1. China
- 5.2. India
- 5.3. Japan
- 5.4. South Korea
- 5.5. ASEAN
- 5.6. Oceania
- 5.7. Rest of Asia Pacific
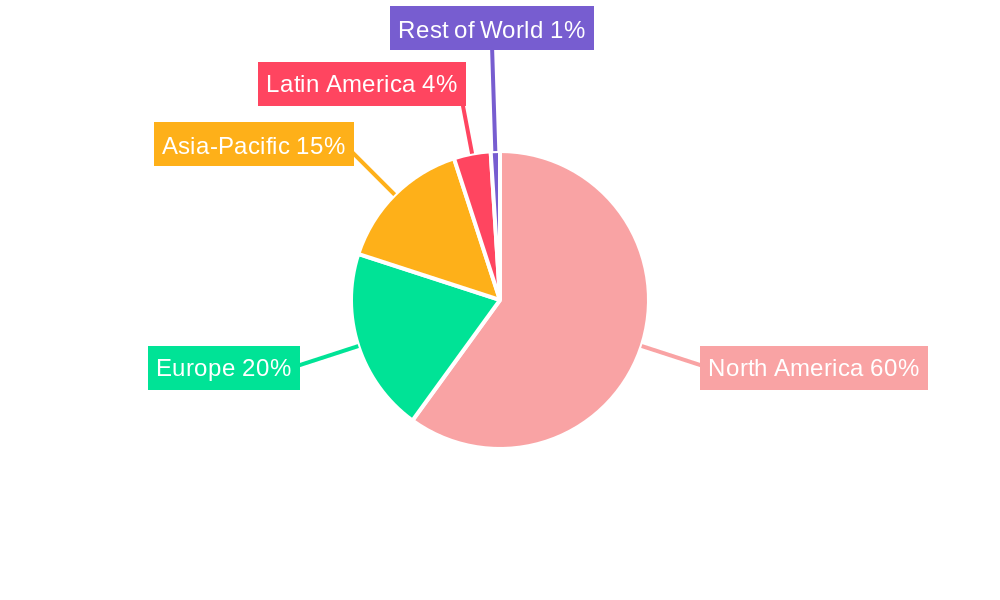
Sports Drink Market in US Regional Market Share
Geographic Coverage of Sports Drink Market in US
Sports Drink Market in US REPORT HIGHLIGHTS
| Aspects | Details |
|---|---|
| Study Period | 2020-2034 |
| Base Year | 2025 |
| Estimated Year | 2026 |
| Forecast Period | 2026-2034 |
| Historical Period | 2020-2025 |
| Growth Rate | CAGR of 3.8% from 2020-2034 |
| Segmentation |
|
Table of Contents
- 1. Introduction
- 1.1. Research Scope
- 1.2. Market Segmentation
- 1.3. Research Objective
- 1.4. Definitions and Assumptions
- 2. Executive Summary
- 2.1. Market Snapshot
- 3. Market Dynamics
- 3.1. Market Drivers
- 3.2. Market Restrains
- 3.3. Market Trends
- 3.4. Market Opportunities
- 4. Market Factor Analysis
- 4.1. Porters Five Forces
- 4.1.1. Bargaining Power of Suppliers
- 4.1.2. Bargaining Power of Buyers
- 4.1.3. Threat of New Entrants
- 4.1.4. Threat of Substitutes
- 4.1.5. Competitive Rivalry
- 4.2. PESTEL analysis
- 4.3. BCG Analysis
- 4.3.1. Stars (High Growth, High Market Share)
- 4.3.2. Cash Cows (Low Growth, High Market Share)
- 4.3.3. Question Mark (High Growth, Low Market Share)
- 4.3.4. Dogs (Low Growth, Low Market Share)
- 4.4. Ansoff Matrix Analysis
- 4.5. Supply Chain Analysis
- 4.6. Regulatory Landscape
- 4.7. Current Market Potential and Opportunity Assessment (TAM–SAM–SOM Framework)
- 4.8. PRI Analyst Note
- 4.1. Porters Five Forces
- 5. Market Analysis, Insights and Forecast 2021-2033
- 5.1. Market Analysis, Insights and Forecast - by Soft Drink Type
- 5.1.1. Electrolyte-Enhanced Water
- 5.1.2. Hypertonic
- 5.1.3. Hypotonic
- 5.1.4. Isotonic
- 5.1.5. Protein-based Sport Drinks
- 5.2. Market Analysis, Insights and Forecast - by Packaging Type
- 5.2.1. Aseptic packages
- 5.2.2. Metal Can
- 5.2.3. PET Bottles
- 5.3. Market Analysis, Insights and Forecast - by Sub Distribution Channel
- 5.3.1. Convenience Stores
- 5.3.2. Online Retail
- 5.3.3. Specialty Stores
- 5.3.4. Supermarket/Hypermarket
- 5.3.5. Others
- 5.4. Market Analysis, Insights and Forecast - by Region
- 5.4.1. North America
- 5.4.2. South America
- 5.4.3. Europe
- 5.4.4. Middle East & Africa
- 5.4.5. Asia Pacific
- 5.1. Market Analysis, Insights and Forecast - by Soft Drink Type
- 6. Global Sports Drink Market in US Analysis, Insights and Forecast, 2021-2033
- 6.1. Market Analysis, Insights and Forecast - by Soft Drink Type
- 6.1.1. Electrolyte-Enhanced Water
- 6.1.2. Hypertonic
- 6.1.3. Hypotonic
- 6.1.4. Isotonic
- 6.1.5. Protein-based Sport Drinks
- 6.2. Market Analysis, Insights and Forecast - by Packaging Type
- 6.2.1. Aseptic packages
- 6.2.2. Metal Can
- 6.2.3. PET Bottles
- 6.3. Market Analysis, Insights and Forecast - by Sub Distribution Channel
- 6.3.1. Convenience Stores
- 6.3.2. Online Retail
- 6.3.3. Specialty Stores
- 6.3.4. Supermarket/Hypermarket
- 6.3.5. Others
- 6.1. Market Analysis, Insights and Forecast - by Soft Drink Type
- 7. North America Sports Drink Market in US Analysis, Insights and Forecast, 2020-2032
- 7.1. Market Analysis, Insights and Forecast - by Soft Drink Type
- 7.1.1. Electrolyte-Enhanced Water
- 7.1.2. Hypertonic
- 7.1.3. Hypotonic
- 7.1.4. Isotonic
- 7.1.5. Protein-based Sport Drinks
- 7.2. Market Analysis, Insights and Forecast - by Packaging Type
- 7.2.1. Aseptic packages
- 7.2.2. Metal Can
- 7.2.3. PET Bottles
- 7.3. Market Analysis, Insights and Forecast - by Sub Distribution Channel
- 7.3.1. Convenience Stores
- 7.3.2. Online Retail
- 7.3.3. Specialty Stores
- 7.3.4. Supermarket/Hypermarket
- 7.3.5. Others
- 7.1. Market Analysis, Insights and Forecast - by Soft Drink Type
- 8. South America Sports Drink Market in US Analysis, Insights and Forecast, 2020-2032
- 8.1. Market Analysis, Insights and Forecast - by Soft Drink Type
- 8.1.1. Electrolyte-Enhanced Water
- 8.1.2. Hypertonic
- 8.1.3. Hypotonic
- 8.1.4. Isotonic
- 8.1.5. Protein-based Sport Drinks
- 8.2. Market Analysis, Insights and Forecast - by Packaging Type
- 8.2.1. Aseptic packages
- 8.2.2. Metal Can
- 8.2.3. PET Bottles
- 8.3. Market Analysis, Insights and Forecast - by Sub Distribution Channel
- 8.3.1. Convenience Stores
- 8.3.2. Online Retail
- 8.3.3. Specialty Stores
- 8.3.4. Supermarket/Hypermarket
- 8.3.5. Others
- 8.1. Market Analysis, Insights and Forecast - by Soft Drink Type
- 9. Europe Sports Drink Market in US Analysis, Insights and Forecast, 2020-2032
- 9.1. Market Analysis, Insights and Forecast - by Soft Drink Type
- 9.1.1. Electrolyte-Enhanced Water
- 9.1.2. Hypertonic
- 9.1.3. Hypotonic
- 9.1.4. Isotonic
- 9.1.5. Protein-based Sport Drinks
- 9.2. Market Analysis, Insights and Forecast - by Packaging Type
- 9.2.1. Aseptic packages
- 9.2.2. Metal Can
- 9.2.3. PET Bottles
- 9.3. Market Analysis, Insights and Forecast - by Sub Distribution Channel
- 9.3.1. Convenience Stores
- 9.3.2. Online Retail
- 9.3.3. Specialty Stores
- 9.3.4. Supermarket/Hypermarket
- 9.3.5. Others
- 9.1. Market Analysis, Insights and Forecast - by Soft Drink Type
- 10. Middle East & Africa Sports Drink Market in US Analysis, Insights and Forecast, 2020-2032
- 10.1. Market Analysis, Insights and Forecast - by Soft Drink Type
- 10.1.1. Electrolyte-Enhanced Water
- 10.1.2. Hypertonic
- 10.1.3. Hypotonic
- 10.1.4. Isotonic
- 10.1.5. Protein-based Sport Drinks
- 10.2. Market Analysis, Insights and Forecast - by Packaging Type
- 10.2.1. Aseptic packages
- 10.2.2. Metal Can
- 10.2.3. PET Bottles
- 10.3. Market Analysis, Insights and Forecast - by Sub Distribution Channel
- 10.3.1. Convenience Stores
- 10.3.2. Online Retail
- 10.3.3. Specialty Stores
- 10.3.4. Supermarket/Hypermarket
- 10.3.5. Others
- 10.1. Market Analysis, Insights and Forecast - by Soft Drink Type
- 11. Asia Pacific Sports Drink Market in US Analysis, Insights and Forecast, 2020-2032
- 11.1. Market Analysis, Insights and Forecast - by Soft Drink Type
- 11.1.1. Electrolyte-Enhanced Water
- 11.1.2. Hypertonic
- 11.1.3. Hypotonic
- 11.1.4. Isotonic
- 11.1.5. Protein-based Sport Drinks
- 11.2. Market Analysis, Insights and Forecast - by Packaging Type
- 11.2.1. Aseptic packages
- 11.2.2. Metal Can
- 11.2.3. PET Bottles
- 11.3. Market Analysis, Insights and Forecast - by Sub Distribution Channel
- 11.3.1. Convenience Stores
- 11.3.2. Online Retail
- 11.3.3. Specialty Stores
- 11.3.4. Supermarket/Hypermarket
- 11.3.5. Others
- 11.1. Market Analysis, Insights and Forecast - by Soft Drink Type
- 12. Competitive Analysis
- 12.1. Company Profiles
- 12.1.1 Costco Wholesale Corporation
- 12.1.1.1. Company Overview
- 12.1.1.2. Products
- 12.1.1.3. Company Financials
- 12.1.1.4. SWOT Analysis
- 12.1.2 Seven & I Holdings Co Ltd
- 12.1.2.1. Company Overview
- 12.1.2.2. Products
- 12.1.2.3. Company Financials
- 12.1.2.4. SWOT Analysis
- 12.1.3 Monster Beverage Corporation
- 12.1.3.1. Company Overview
- 12.1.3.2. Products
- 12.1.3.3. Company Financials
- 12.1.3.4. SWOT Analysis
- 12.1.4 PepsiCo Inc
- 12.1.4.1. Company Overview
- 12.1.4.2. Products
- 12.1.4.3. Company Financials
- 12.1.4.4. SWOT Analysis
- 12.1.5 The Coca-Cola Compan
- 12.1.5.1. Company Overview
- 12.1.5.2. Products
- 12.1.5.3. Company Financials
- 12.1.5.4. SWOT Analysis
- 12.1.6 Abbott Laboratories
- 12.1.6.1. Company Overview
- 12.1.6.2. Products
- 12.1.6.3. Company Financials
- 12.1.6.4. SWOT Analysis
- 12.1.7 Suntory Holdings Limited
- 12.1.7.1. Company Overview
- 12.1.7.2. Products
- 12.1.7.3. Company Financials
- 12.1.7.4. SWOT Analysis
- 12.1.8 Keurig Dr Pepper Inc
- 12.1.8.1. Company Overview
- 12.1.8.2. Products
- 12.1.8.3. Company Financials
- 12.1.8.4. SWOT Analysis
- 12.1.9 Pisa Global S A de C V
- 12.1.9.1. Company Overview
- 12.1.9.2. Products
- 12.1.9.3. Company Financials
- 12.1.9.4. SWOT Analysis
- 12.1.10 Otsuka Holdings Co Ltd
- 12.1.10.1. Company Overview
- 12.1.10.2. Products
- 12.1.10.3. Company Financials
- 12.1.10.4. SWOT Analysis
- 12.1.11 Bluetriton Brands Holdings Inc
- 12.1.11.1. Company Overview
- 12.1.11.2. Products
- 12.1.11.3. Company Financials
- 12.1.11.4. SWOT Analysis
- 12.1.12 Congo Brands
- 12.1.12.1. Company Overview
- 12.1.12.2. Products
- 12.1.12.3. Company Financials
- 12.1.12.4. SWOT Analysis
- 12.1.1 Costco Wholesale Corporation
- 12.2. Market Entropy
- 12.2.1 Company's Key Areas Served
- 12.2.2 Recent Developments
- 12.3. Company Market Share Analysis 2025
- 12.3.1 Top 5 Companies Market Share Analysis
- 12.3.2 Top 3 Companies Market Share Analysis
- 12.4. List of Potential Customers
- 13. Research Methodology
List of Figures
- Figure 1: Global Sports Drink Market in US Revenue Breakdown (billion, %) by Region 2025 & 2033
- Figure 2: North America Sports Drink Market in US Revenue (billion), by Soft Drink Type 2025 & 2033
- Figure 3: North America Sports Drink Market in US Revenue Share (%), by Soft Drink Type 2025 & 2033
- Figure 4: North America Sports Drink Market in US Revenue (billion), by Packaging Type 2025 & 2033
- Figure 5: North America Sports Drink Market in US Revenue Share (%), by Packaging Type 2025 & 2033
- Figure 6: North America Sports Drink Market in US Revenue (billion), by Sub Distribution Channel 2025 & 2033
- Figure 7: North America Sports Drink Market in US Revenue Share (%), by Sub Distribution Channel 2025 & 2033
- Figure 8: North America Sports Drink Market in US Revenue (billion), by Country 2025 & 2033
- Figure 9: North America Sports Drink Market in US Revenue Share (%), by Country 2025 & 2033
- Figure 10: South America Sports Drink Market in US Revenue (billion), by Soft Drink Type 2025 & 2033
- Figure 11: South America Sports Drink Market in US Revenue Share (%), by Soft Drink Type 2025 & 2033
- Figure 12: South America Sports Drink Market in US Revenue (billion), by Packaging Type 2025 & 2033
- Figure 13: South America Sports Drink Market in US Revenue Share (%), by Packaging Type 2025 & 2033
- Figure 14: South America Sports Drink Market in US Revenue (billion), by Sub Distribution Channel 2025 & 2033
- Figure 15: South America Sports Drink Market in US Revenue Share (%), by Sub Distribution Channel 2025 & 2033
- Figure 16: South America Sports Drink Market in US Revenue (billion), by Country 2025 & 2033
- Figure 17: South America Sports Drink Market in US Revenue Share (%), by Country 2025 & 2033
- Figure 18: Europe Sports Drink Market in US Revenue (billion), by Soft Drink Type 2025 & 2033
- Figure 19: Europe Sports Drink Market in US Revenue Share (%), by Soft Drink Type 2025 & 2033
- Figure 20: Europe Sports Drink Market in US Revenue (billion), by Packaging Type 2025 & 2033
- Figure 21: Europe Sports Drink Market in US Revenue Share (%), by Packaging Type 2025 & 2033
- Figure 22: Europe Sports Drink Market in US Revenue (billion), by Sub Distribution Channel 2025 & 2033
- Figure 23: Europe Sports Drink Market in US Revenue Share (%), by Sub Distribution Channel 2025 & 2033
- Figure 24: Europe Sports Drink Market in US Revenue (billion), by Country 2025 & 2033
- Figure 25: Europe Sports Drink Market in US Revenue Share (%), by Country 2025 & 2033
- Figure 26: Middle East & Africa Sports Drink Market in US Revenue (billion), by Soft Drink Type 2025 & 2033
- Figure 27: Middle East & Africa Sports Drink Market in US Revenue Share (%), by Soft Drink Type 2025 & 2033
- Figure 28: Middle East & Africa Sports Drink Market in US Revenue (billion), by Packaging Type 2025 & 2033
- Figure 29: Middle East & Africa Sports Drink Market in US Revenue Share (%), by Packaging Type 2025 & 2033
- Figure 30: Middle East & Africa Sports Drink Market in US Revenue (billion), by Sub Distribution Channel 2025 & 2033
- Figure 31: Middle East & Africa Sports Drink Market in US Revenue Share (%), by Sub Distribution Channel 2025 & 2033
- Figure 32: Middle East & Africa Sports Drink Market in US Revenue (billion), by Country 2025 & 2033
- Figure 33: Middle East & Africa Sports Drink Market in US Revenue Share (%), by Country 2025 & 2033
- Figure 34: Asia Pacific Sports Drink Market in US Revenue (billion), by Soft Drink Type 2025 & 2033
- Figure 35: Asia Pacific Sports Drink Market in US Revenue Share (%), by Soft Drink Type 2025 & 2033
- Figure 36: Asia Pacific Sports Drink Market in US Revenue (billion), by Packaging Type 2025 & 2033
- Figure 37: Asia Pacific Sports Drink Market in US Revenue Share (%), by Packaging Type 2025 & 2033
- Figure 38: Asia Pacific Sports Drink Market in US Revenue (billion), by Sub Distribution Channel 2025 & 2033
- Figure 39: Asia Pacific Sports Drink Market in US Revenue Share (%), by Sub Distribution Channel 2025 & 2033
- Figure 40: Asia Pacific Sports Drink Market in US Revenue (billion), by Country 2025 & 2033
- Figure 41: Asia Pacific Sports Drink Market in US Revenue Share (%), by Country 2025 & 2033
List of Tables
- Table 1: Global Sports Drink Market in US Revenue billion Forecast, by Soft Drink Type 2020 & 2033
- Table 2: Global Sports Drink Market in US Revenue billion Forecast, by Packaging Type 2020 & 2033
- Table 3: Global Sports Drink Market in US Revenue billion Forecast, by Sub Distribution Channel 2020 & 2033
- Table 4: Global Sports Drink Market in US Revenue billion Forecast, by Region 2020 & 2033
- Table 5: Global Sports Drink Market in US Revenue billion Forecast, by Soft Drink Type 2020 & 2033
- Table 6: Global Sports Drink Market in US Revenue billion Forecast, by Packaging Type 2020 & 2033
- Table 7: Global Sports Drink Market in US Revenue billion Forecast, by Sub Distribution Channel 2020 & 2033
- Table 8: Global Sports Drink Market in US Revenue billion Forecast, by Country 2020 & 2033
- Table 9: United States Sports Drink Market in US Revenue (billion) Forecast, by Application 2020 & 2033
- Table 10: Canada Sports Drink Market in US Revenue (billion) Forecast, by Application 2020 & 2033
- Table 11: Mexico Sports Drink Market in US Revenue (billion) Forecast, by Application 2020 & 2033
- Table 12: Global Sports Drink Market in US Revenue billion Forecast, by Soft Drink Type 2020 & 2033
- Table 13: Global Sports Drink Market in US Revenue billion Forecast, by Packaging Type 2020 & 2033
- Table 14: Global Sports Drink Market in US Revenue billion Forecast, by Sub Distribution Channel 2020 & 2033
- Table 15: Global Sports Drink Market in US Revenue billion Forecast, by Country 2020 & 2033
- Table 16: Brazil Sports Drink Market in US Revenue (billion) Forecast, by Application 2020 & 2033
- Table 17: Argentina Sports Drink Market in US Revenue (billion) Forecast, by Application 2020 & 2033
- Table 18: Rest of South America Sports Drink Market in US Revenue (billion) Forecast, by Application 2020 & 2033
- Table 19: Global Sports Drink Market in US Revenue billion Forecast, by Soft Drink Type 2020 & 2033
- Table 20: Global Sports Drink Market in US Revenue billion Forecast, by Packaging Type 2020 & 2033
- Table 21: Global Sports Drink Market in US Revenue billion Forecast, by Sub Distribution Channel 2020 & 2033
- Table 22: Global Sports Drink Market in US Revenue billion Forecast, by Country 2020 & 2033
- Table 23: United Kingdom Sports Drink Market in US Revenue (billion) Forecast, by Application 2020 & 2033
- Table 24: Germany Sports Drink Market in US Revenue (billion) Forecast, by Application 2020 & 2033
- Table 25: France Sports Drink Market in US Revenue (billion) Forecast, by Application 2020 & 2033
- Table 26: Italy Sports Drink Market in US Revenue (billion) Forecast, by Application 2020 & 2033
- Table 27: Spain Sports Drink Market in US Revenue (billion) Forecast, by Application 2020 & 2033
- Table 28: Russia Sports Drink Market in US Revenue (billion) Forecast, by Application 2020 & 2033
- Table 29: Benelux Sports Drink Market in US Revenue (billion) Forecast, by Application 2020 & 2033
- Table 30: Nordics Sports Drink Market in US Revenue (billion) Forecast, by Application 2020 & 2033
- Table 31: Rest of Europe Sports Drink Market in US Revenue (billion) Forecast, by Application 2020 & 2033
- Table 32: Global Sports Drink Market in US Revenue billion Forecast, by Soft Drink Type 2020 & 2033
- Table 33: Global Sports Drink Market in US Revenue billion Forecast, by Packaging Type 2020 & 2033
- Table 34: Global Sports Drink Market in US Revenue billion Forecast, by Sub Distribution Channel 2020 & 2033
- Table 35: Global Sports Drink Market in US Revenue billion Forecast, by Country 2020 & 2033
- Table 36: Turkey Sports Drink Market in US Revenue (billion) Forecast, by Application 2020 & 2033
- Table 37: Israel Sports Drink Market in US Revenue (billion) Forecast, by Application 2020 & 2033
- Table 38: GCC Sports Drink Market in US Revenue (billion) Forecast, by Application 2020 & 2033
- Table 39: North Africa Sports Drink Market in US Revenue (billion) Forecast, by Application 2020 & 2033
- Table 40: South Africa Sports Drink Market in US Revenue (billion) Forecast, by Application 2020 & 2033
- Table 41: Rest of Middle East & Africa Sports Drink Market in US Revenue (billion) Forecast, by Application 2020 & 2033
- Table 42: Global Sports Drink Market in US Revenue billion Forecast, by Soft Drink Type 2020 & 2033
- Table 43: Global Sports Drink Market in US Revenue billion Forecast, by Packaging Type 2020 & 2033
- Table 44: Global Sports Drink Market in US Revenue billion Forecast, by Sub Distribution Channel 2020 & 2033
- Table 45: Global Sports Drink Market in US Revenue billion Forecast, by Country 2020 & 2033
- Table 46: China Sports Drink Market in US Revenue (billion) Forecast, by Application 2020 & 2033
- Table 47: India Sports Drink Market in US Revenue (billion) Forecast, by Application 2020 & 2033
- Table 48: Japan Sports Drink Market in US Revenue (billion) Forecast, by Application 2020 & 2033
- Table 49: South Korea Sports Drink Market in US Revenue (billion) Forecast, by Application 2020 & 2033
- Table 50: ASEAN Sports Drink Market in US Revenue (billion) Forecast, by Application 2020 & 2033
- Table 51: Oceania Sports Drink Market in US Revenue (billion) Forecast, by Application 2020 & 2033
- Table 52: Rest of Asia Pacific Sports Drink Market in US Revenue (billion) Forecast, by Application 2020 & 2033
Frequently Asked Questions
1. What is the projected Compound Annual Growth Rate (CAGR) of the Sports Drink Market in US?
The projected CAGR is approximately 3.8%.
2. Which companies are prominent players in the Sports Drink Market in US?
Key companies in the market include Costco Wholesale Corporation, Seven & I Holdings Co Ltd, Monster Beverage Corporation, PepsiCo Inc, The Coca-Cola Compan, Abbott Laboratories, Suntory Holdings Limited, Keurig Dr Pepper Inc, Pisa Global S A de C V, Otsuka Holdings Co Ltd, Bluetriton Brands Holdings Inc, Congo Brands.
3. What are the main segments of the Sports Drink Market in US?
The market segments include Soft Drink Type, Packaging Type, Sub Distribution Channel.
4. Can you provide details about the market size?
The market size is estimated to be USD 28.2 billion as of 2022.
5. What are some drivers contributing to market growth?
Rising Consumer Awareness about Health and Fitness; Increasing the Use of Casein and Caseinate in Food and Beverage Industry.
6. What are the notable trends driving market growth?
OTHER KEY INDUSTRY TRENDS COVERED IN THE REPORT.
7. Are there any restraints impacting market growth?
High Competition From Alternative Protein Sources.
8. Can you provide examples of recent developments in the market?
December 2023: Spar works with US distributor Congo Brands to bring Prime drinks to stores. The move makes Spar the first symbol group in the convenience channel to stock PrimeApril 2023: Congo LLC to relocate, expand Louisville headquarters with USD 8.25 million investment, creating 500 high-wage jobs. The company will relocate its Louisville headquarters to an existing 110,000-square-foot location at 13551 Triton Park Blvd., moving from its current 18,000-square-foot facility.February 2023: Premium pH-balanced water brand Core Hydration expanded with Core Hydration+, a series of nutrient-enhanced waters, each formulated to support overall health with functional ingredients. The brand is available in three flavors under the names Core Hydration+Immunity, Core Hydartion+Vibrance, and Core Hydration+ Calm.
9. What pricing options are available for accessing the report?
Pricing options include single-user, multi-user, and enterprise licenses priced at USD 3800, USD 4500, and USD 5800 respectively.
10. Is the market size provided in terms of value or volume?
The market size is provided in terms of value, measured in billion.
11. Are there any specific market keywords associated with the report?
Yes, the market keyword associated with the report is "Sports Drink Market in US," which aids in identifying and referencing the specific market segment covered.
12. How do I determine which pricing option suits my needs best?
The pricing options vary based on user requirements and access needs. Individual users may opt for single-user licenses, while businesses requiring broader access may choose multi-user or enterprise licenses for cost-effective access to the report.
13. Are there any additional resources or data provided in the Sports Drink Market in US report?
While the report offers comprehensive insights, it's advisable to review the specific contents or supplementary materials provided to ascertain if additional resources or data are available.
14. How can I stay updated on further developments or reports in the Sports Drink Market in US?
To stay informed about further developments, trends, and reports in the Sports Drink Market in US, consider subscribing to industry newsletters, following relevant companies and organizations, or regularly checking reputable industry news sources and publications.
Methodology
Step 1 - Identification of Relevant Samples Size from Population Database


Step 2 - Approaches for Defining Global Market Size (Value, Volume* & Price*)

Note*: In applicable scenarios
Step 3 - Data Sources
Primary Research
- Web Analytics
- Survey Reports
- Research Institute
- Latest Research Reports
- Opinion Leaders
Secondary Research
- Annual Reports
- White Paper
- Latest Press Release
- Industry Association
- Paid Database
- Investor Presentations

Step 4 - Data Triangulation
Involves using different sources of information in order to increase the validity of a study
These sources are likely to be stakeholders in a program - participants, other researchers, program staff, other community members, and so on.
Then we put all data in single framework & apply various statistical tools to find out the dynamic on the market.
During the analysis stage, feedback from the stakeholder groups would be compared to determine areas of agreement as well as areas of divergence