

Key Insights
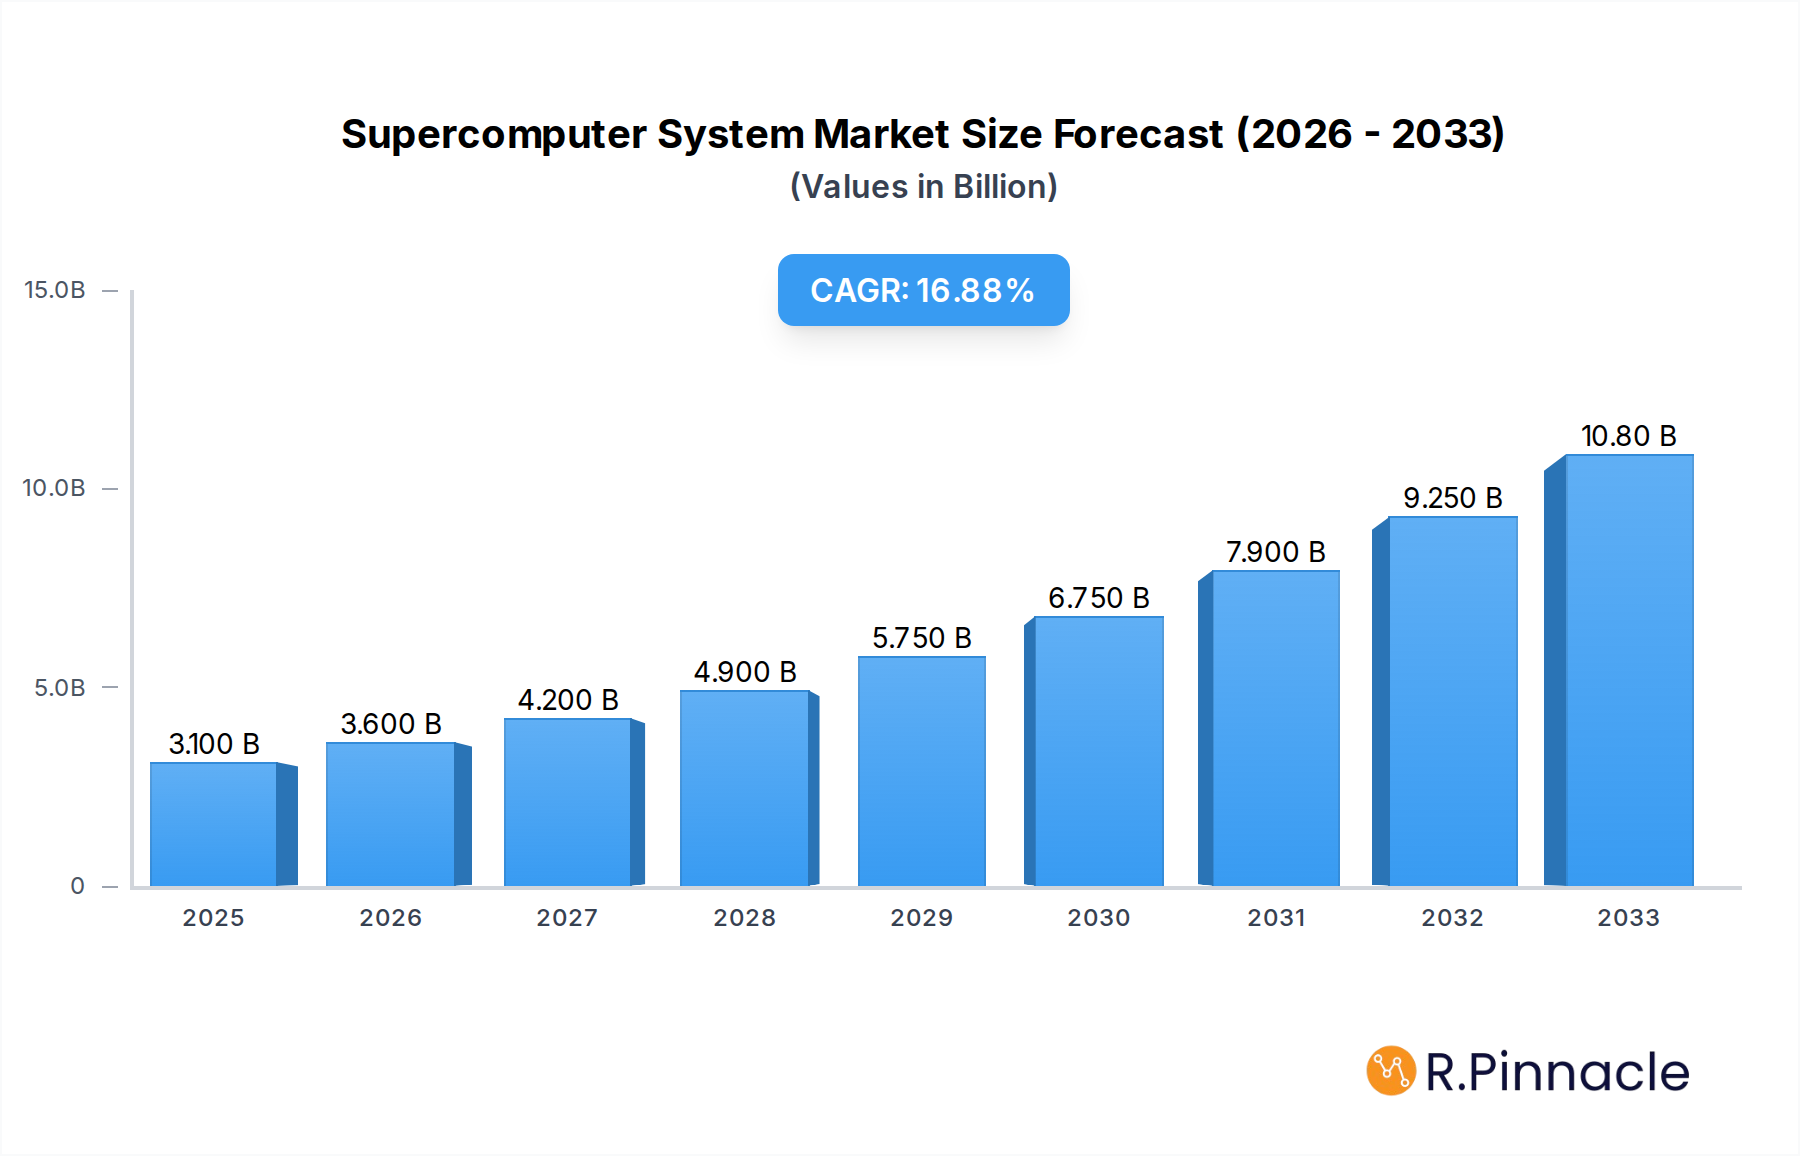
The global Supercomputer System market is poised for remarkable expansion, projected to reach $3.1 billion in 2025 and surge at a robust CAGR of 19.7% through 2033. This impressive growth is fueled by an insatiable demand for enhanced computational power across diverse sectors. Scientific research, particularly in areas like climate modeling, genomics, and astrophysics, is a primary driver, requiring increasingly sophisticated systems for complex simulations and data analysis. The medical field is witnessing significant adoption for drug discovery, personalized medicine, and advanced medical imaging, contributing to the market's upward trajectory. Furthermore, industrial applications, including manufacturing simulation, oil and gas exploration, and financial modeling, are benefiting from the precision and speed offered by supercomputers. The national defense sector also relies heavily on these systems for strategic analysis, intelligence gathering, and secure communications, presenting a stable demand base. Emerging applications in artificial intelligence and machine learning further amplify the need for high-performance computing, solidifying the supercomputer's indispensable role.

Supercomputer System Market Size (In Billion)
The market is characterized by distinct segments, with Exascale and Petascale systems leading the charge in technological advancement and adoption. While the initial investment for such powerful infrastructure can be substantial, the long-term benefits in terms of accelerated innovation, improved efficiency, and groundbreaking discoveries are compelling. Restraints, such as the high operational costs and energy consumption associated with supercomputers, are being addressed through advancements in energy-efficient hardware and cooling technologies. The competitive landscape is dominated by major technology giants like IBM, AMD, HPE, Dell, Intel, Lenovo, Microsoft, NVIDIA, Fujitsu, Atos, and Sugon, who are continuously investing in research and development to push the boundaries of computational power. Geographically, North America and Asia Pacific, particularly China and the United States, are expected to lead the market in terms of adoption and innovation due to significant investments in research infrastructure and technological advancement. Europe also represents a substantial market, driven by its strong scientific research institutions and government initiatives.
Supercomputer System Company Market Share
Supercomputer System Market Structure & Innovation Trends
The global supercomputer system market exhibits a moderately concentrated structure, with a few key players like IBM, AMD, HPE, Dell, Intel, Lenovo, Microsoft, NVIDIA, Fujitsu, Atos, and Sugon dominating a significant portion of the market share. Innovation is primarily driven by advancements in processing power (exascale and petascale computing), AI integration, and energy efficiency, crucial for scientific research, medical breakthroughs, industrial simulations, and national defense applications. Regulatory frameworks, particularly those concerning data privacy and national security in high-performance computing, play a critical role in shaping market entry and operational strategies. Product substitutes, while limited in the high-performance realm, can include distributed computing and cloud-based HPC solutions for less demanding tasks. End-user demographics are shifting towards research institutions, large enterprises in sectors like pharmaceuticals and energy, and government agencies. Mergers and acquisitions (M&A) activities, with deal values estimated to be in the billions, continue to consolidate the market, enhancing capabilities and expanding reach. For instance, strategic acquisitions in AI chip technology by companies like NVIDIA have significantly boosted their market standing, influencing the overall competitive landscape.
Supercomputer System Market Dynamics & Trends
The supercomputer system market is experiencing robust growth, propelled by an ever-increasing demand for advanced computational power across a multitude of sectors. A significant market driver is the relentless pursuit of scientific discovery, where supercomputers are indispensable for complex simulations in fields like climate modeling, particle physics, and drug discovery. The burgeoning adoption of Artificial Intelligence (AI) and Machine Learning (ML) is another pivotal factor, as these technologies require immense processing capabilities for training deep neural networks and analyzing vast datasets. This has led to a substantial increase in the market penetration of AI-optimized supercomputing solutions. Technological disruptions, such as the transition to exascale computing and the integration of novel architectures like GPUs and specialized AI accelerators, are redefining performance benchmarks and unlocking new application frontiers. Consumer preferences are increasingly leaning towards systems that offer not only raw computational power but also energy efficiency and ease of management, driven by escalating operational costs and environmental concerns. The competitive dynamics are intense, characterized by fierce R&D investments, strategic partnerships, and a constant race to achieve superior performance metrics. Companies like AMD and NVIDIA are at the forefront of providing cutting-edge processors and accelerators that are crucial for maintaining a competitive edge. The forecast CAGR for the market is estimated to be between 10% and 15% over the forecast period of 2025–2033, indicating sustained expansion. The base year of 2025 represents a significant inflection point, with anticipated market revenue reaching several billion.
Dominant Regions & Segments in Supercomputer System
North America, particularly the United States, currently holds a dominant position in the global supercomputer system market. This leadership is underpinned by substantial government investment in high-performance computing (HPC) for scientific research and national defense, coupled with a strong presence of leading technology companies like IBM, HPE, Dell, and NVIDIA. Robust economic policies supporting innovation and extensive infrastructure development further solidify its position.
Within the application segments, Scientific Research continues to be the primary driver of supercomputer adoption. Breakthroughs in areas such as climate science, astrophysics, and materials science necessitate the computational power offered by exascale and petascale systems. The need to process massive datasets generated by telescopes, particle accelerators, and other scientific instruments fuels this demand.
The Medical segment is rapidly gaining traction, driven by advancements in genomics, personalized medicine, and drug discovery. Supercomputers enable complex simulations of molecular interactions, accelerate the analysis of patient data for predictive diagnostics, and facilitate the development of new therapies. The potential for life-saving breakthroughs makes this a critical growth area.
The National Defense sector remains a significant consumer of supercomputing resources. Applications include advanced threat analysis, simulation of defense systems, cryptography, and intelligence gathering. Governments worldwide are investing billions in HPC to maintain strategic technological superiority and enhance national security.
The Industrial segment, encompassing sectors like automotive, aerospace, energy, and manufacturing, is increasingly leveraging supercomputers for complex simulations, design optimization, and predictive maintenance. For instance, the automotive industry uses HPC for crash simulations and aerodynamic modeling, while the energy sector employs it for reservoir simulation and exploration.
Regarding system type, Exascale systems represent the pinnacle of current supercomputing technology, offering unparalleled processing speeds measured in exaflops (quintillions of calculations per second). The development and deployment of these systems are critical for tackling the most complex scientific and engineering challenges. Petascale systems, while less powerful than exascale, still offer immense computational capabilities and are widely adopted across various research and industrial applications. The continuous innovation in both exascale and petascale technologies, coupled with advancements in specialized hardware like GPUs and AI accelerators, ensures their continued relevance and growth in the market. The market size for supercomputer systems is projected to reach several billion by 2033, with North America expected to maintain its lead, followed by Europe and Asia-Pacific.
Supercomputer System Product Innovations
Recent product innovations in supercomputer systems are characterized by a relentless push towards exascale computing, enhanced AI acceleration, and improved energy efficiency. Companies like NVIDIA, AMD, and Intel are leading the charge with novel CPU and GPU architectures that significantly boost processing speeds and parallel computing capabilities. These advancements are crucial for tackling increasingly complex scientific research, accelerating medical diagnostics and drug discovery, optimizing industrial processes through sophisticated simulations, and bolstering national defense capabilities. The competitive advantage lies in achieving higher performance-per-watt and integrating specialized hardware tailored for AI workloads, making these systems indispensable for cutting-edge applications.
Supercomputer System Report Scope & Segmentation Analysis
This report analyzes the global supercomputer system market across key segmentation dimensions. In terms of Application, the market is divided into Scientific Research, Medical, Industrial, National Defense, and Others. Scientific Research is projected to exhibit a significant market share and robust growth due to its fundamental reliance on high-performance computing for complex simulations and data analysis. The Medical segment is anticipated to witness accelerated growth driven by advancements in AI-powered diagnostics and drug discovery. The Industrial segment, encompassing manufacturing, energy, and aerospace, is also expected to expand considerably as businesses adopt HPC for design optimization and complex modeling. The Type segmentation includes Exascale, Petascale, and Others. Exascale systems, representing the highest tier of computational power, are experiencing growing adoption in cutting-edge research and defense applications. Petascale systems continue to form a substantial market base for a wider range of scientific and industrial tasks. Growth projections for each segment are detailed within the report, providing insights into their respective market sizes and competitive dynamics.
Key Drivers of Supercomputer System Growth
The growth of the supercomputer system market is propelled by several interconnected factors. Technologically, the insatiable demand for increased computational power to solve increasingly complex scientific problems, such as climate modeling and fusion research, is a primary driver. The rapid integration of Artificial Intelligence (AI) and Machine Learning (ML) across various industries necessitates massive processing capabilities for training sophisticated models, further fueling demand. Economically, the significant return on investment realized by organizations leveraging HPC for innovation, product development, and efficiency gains makes supercomputers a strategic imperative. Regulatory frameworks, particularly those that encourage investment in advanced computing for national security and scientific advancement, also play a supportive role. For instance, government initiatives funding exascale computing projects in the United States and Europe are directly contributing to market expansion, with budgets in the billions allocated to these endeavors.
Challenges in the Supercomputer System Sector
Despite robust growth, the supercomputer system sector faces several significant challenges. High acquisition and operational costs, often running into hundreds of millions of dollars, can be a substantial barrier for smaller organizations and even some research institutions. Power consumption and cooling requirements for exascale systems present considerable energy efficiency hurdles, leading to high electricity bills and environmental concerns. Supply chain disruptions, particularly for specialized components like advanced processors and GPUs, can lead to project delays and increased costs, impacting the timely delivery of systems valued in the billions. Furthermore, the scarcity of skilled personnel capable of programming and managing these complex systems poses a challenge to widespread adoption and efficient utilization. Competitive pressures among major vendors also lead to rapid obsolescence, requiring continuous investment to stay at the forefront of technology.
Emerging Opportunities in Supercomputer System
The supercomputer system market is ripe with emerging opportunities driven by technological advancements and evolving industry needs. The expanding adoption of AI and ML across sectors beyond traditional scientific research presents a significant growth avenue. Industries such as finance, retail, and entertainment are increasingly exploring HPC for complex data analytics, predictive modeling, and content creation, representing potential new markets worth billions. The development of specialized hardware accelerators, such as TPUs and neuromorphic chips, tailored for specific AI workloads, opens up opportunities for enhanced performance and energy efficiency. Furthermore, the growing demand for cloud-based HPC solutions offers a more accessible and flexible model for businesses that cannot afford to invest in on-premise systems, creating a hybrid computing landscape. The ongoing drive towards sustainable computing also presents opportunities for vendors to innovate in energy-efficient architectures and cooling technologies.
Leading Players in the Supercomputer System Market
IBM AMD HPE Dell Intel Lenovo Microsoft NVIDIA Fujitsu Atos Sugon
Key Developments in Supercomputer System Industry
- 2023: NVIDIA launches its Hopper architecture, enhancing GPU performance for AI and HPC workloads.
- 2023: AMD introduces its EPYC Genoa processors, further boosting CPU capabilities for supercomputing.
- 2023: The Frontier supercomputer, powered by HPE and AMD, officially becomes the first exascale system.
- 2024: IBM announces advancements in quantum computing integration with classical HPC systems.
- 2024: Intel unveils its next-generation Xeon processors designed for demanding HPC applications.
- 2024: Several national defense projects globally initiate procurements for next-generation supercomputing clusters, with budgets in the billions.
- 2025: Forecasted widespread adoption of AI-accelerated exascale systems in scientific research and industrial simulations.
- 2025: Increased investment in energy-efficient cooling technologies and sustainable HPC infrastructure.
- 2026-2030: Continued evolution towards even more powerful exascale and potentially zettascale systems.
- 2030-2033: Maturation of hybrid cloud HPC models and further integration of quantum computing capabilities.
Future Outlook for Supercomputer System Market
The future outlook for the supercomputer system market is exceptionally bright, driven by an accelerating pace of technological innovation and an ever-expanding range of applications. The continued advancement of exascale and the nascent exploration of zettascale computing will unlock unprecedented computational capabilities, enabling solutions to previously intractable scientific and societal challenges. The deep integration of AI and machine learning will transform how supercomputers are utilized, moving beyond raw processing power to intelligent data analysis and predictive modeling. Investments in energy-efficient architectures and sustainable HPC solutions will become increasingly critical, shaping the development of next-generation systems. Furthermore, the convergence of HPC with other advanced technologies like quantum computing and edge computing is poised to create entirely new paradigms for computation and problem-solving, securing sustained growth and strategic importance for the supercomputer market, with projected market values in the billions.
Supercomputer System Segmentation
-
1. Application
- 1.1. Scientific Research
- 1.2. Medical
- 1.3. Industrial
- 1.4. National Defense
- 1.5. Others
-
2. Type
- 2.1. Exascale
- 2.2. Petascale
- 2.3. Others
Supercomputer System Segmentation By Geography
-
1. North America
- 1.1. United States
- 1.2. Canada
- 1.3. Mexico
-
2. South America
- 2.1. Brazil
- 2.2. Argentina
- 2.3. Rest of South America
-
3. Europe
- 3.1. United Kingdom
- 3.2. Germany
- 3.3. France
- 3.4. Italy
- 3.5. Spain
- 3.6. Russia
- 3.7. Benelux
- 3.8. Nordics
- 3.9. Rest of Europe
-
4. Middle East & Africa
- 4.1. Turkey
- 4.2. Israel
- 4.3. GCC
- 4.4. North Africa
- 4.5. South Africa
- 4.6. Rest of Middle East & Africa
-
5. Asia Pacific
- 5.1. China
- 5.2. India
- 5.3. Japan
- 5.4. South Korea
- 5.5. ASEAN
- 5.6. Oceania
- 5.7. Rest of Asia Pacific
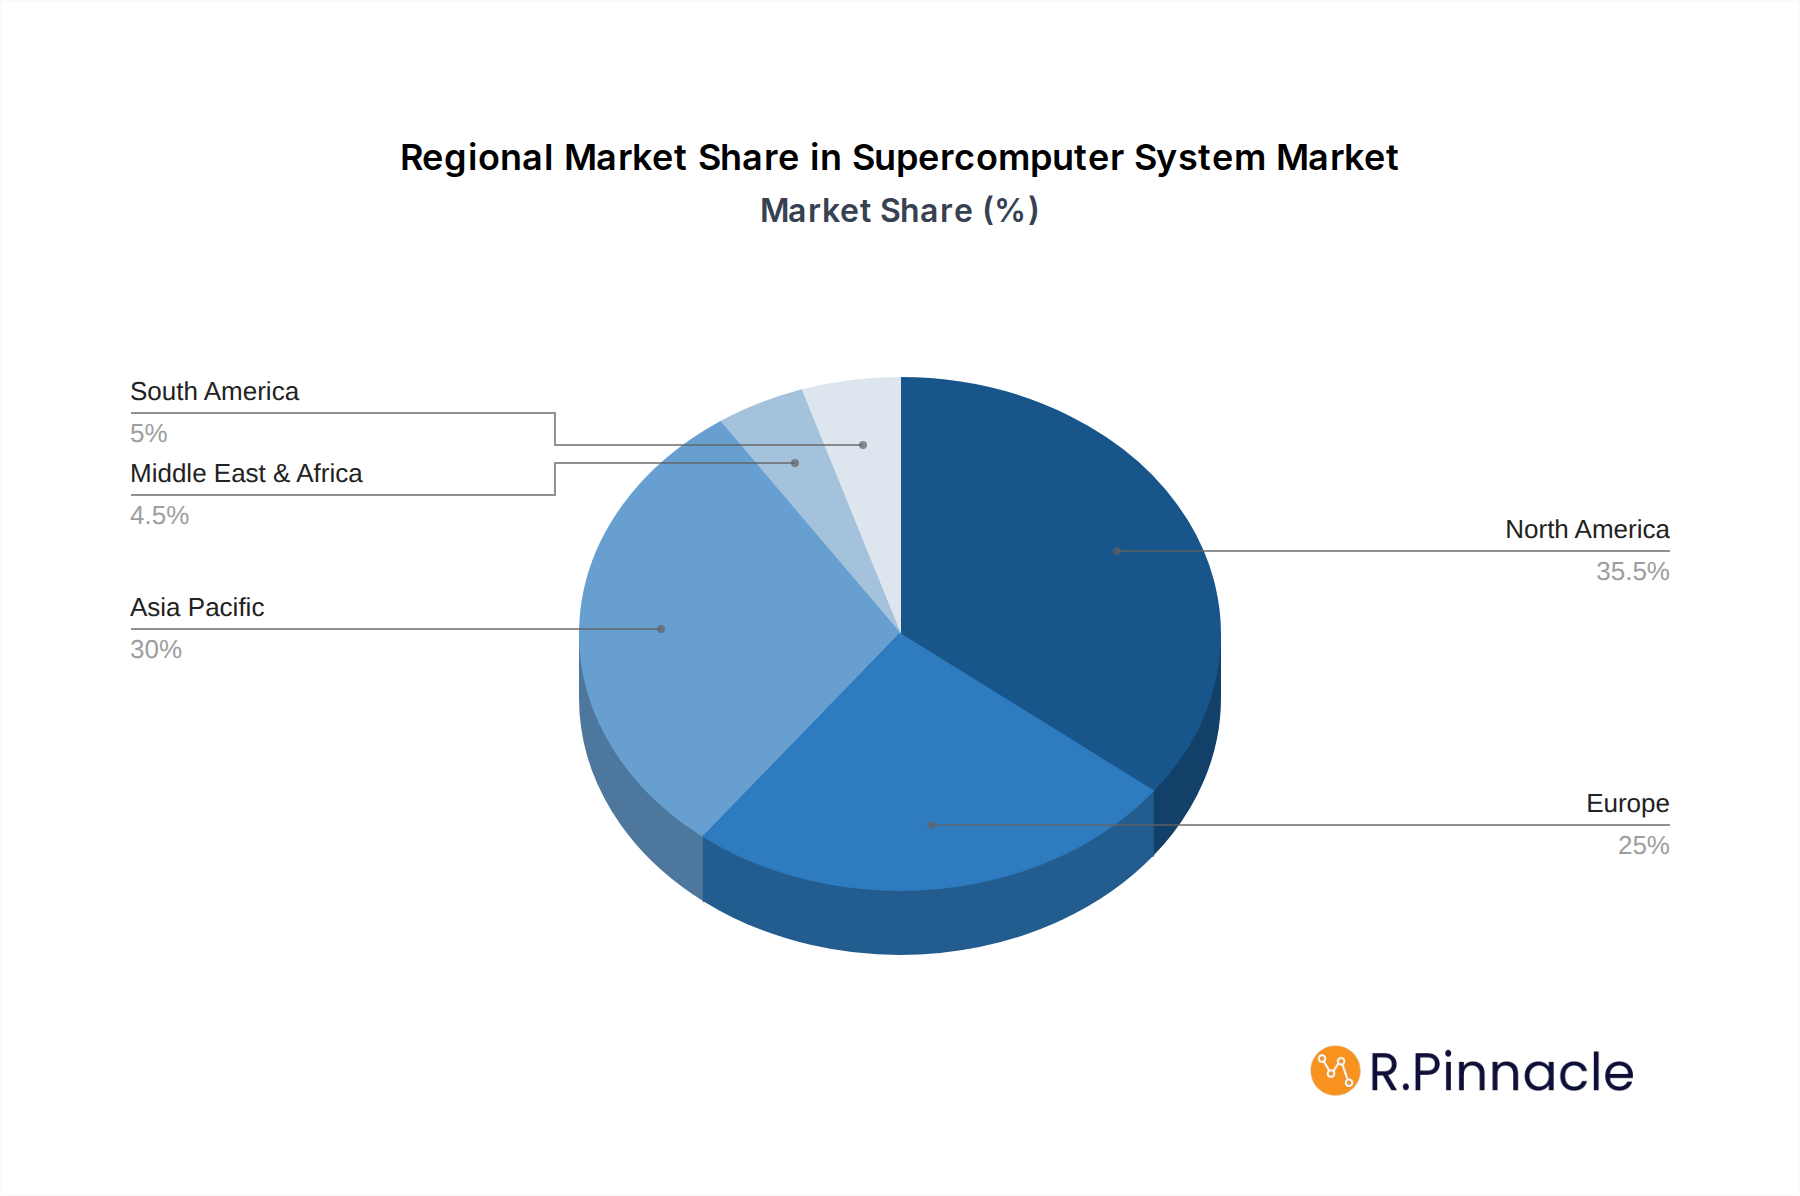
Supercomputer System Regional Market Share
Geographic Coverage of Supercomputer System
Supercomputer System REPORT HIGHLIGHTS
| Aspects | Details |
|---|---|
| Study Period | 2020-2034 |
| Base Year | 2025 |
| Estimated Year | 2026 |
| Forecast Period | 2026-2034 |
| Historical Period | 2020-2025 |
| Growth Rate | CAGR of 19.7% from 2020-2034 |
| Segmentation |
|
Table of Contents
- 1. Introduction
- 1.1. Research Scope
- 1.2. Market Segmentation
- 1.3. Research Methodology
- 1.4. Definitions and Assumptions
- 2. Executive Summary
- 2.1. Introduction
- 3. Market Dynamics
- 3.1. Introduction
- 3.2. Market Drivers
- 3.3. Market Restrains
- 3.4. Market Trends
- 4. Market Factor Analysis
- 4.1. Porters Five Forces
- 4.2. Supply/Value Chain
- 4.3. PESTEL analysis
- 4.4. Market Entropy
- 4.5. Patent/Trademark Analysis
- 5. Global Supercomputer System Analysis, Insights and Forecast, 2020-2032
- 5.1. Market Analysis, Insights and Forecast - by Application
- 5.1.1. Scientific Research
- 5.1.2. Medical
- 5.1.3. Industrial
- 5.1.4. National Defense
- 5.1.5. Others
- 5.2. Market Analysis, Insights and Forecast - by Type
- 5.2.1. Exascale
- 5.2.2. Petascale
- 5.2.3. Others
- 5.3. Market Analysis, Insights and Forecast - by Region
- 5.3.1. North America
- 5.3.2. South America
- 5.3.3. Europe
- 5.3.4. Middle East & Africa
- 5.3.5. Asia Pacific
- 5.1. Market Analysis, Insights and Forecast - by Application
- 6. North America Supercomputer System Analysis, Insights and Forecast, 2020-2032
- 6.1. Market Analysis, Insights and Forecast - by Application
- 6.1.1. Scientific Research
- 6.1.2. Medical
- 6.1.3. Industrial
- 6.1.4. National Defense
- 6.1.5. Others
- 6.2. Market Analysis, Insights and Forecast - by Type
- 6.2.1. Exascale
- 6.2.2. Petascale
- 6.2.3. Others
- 6.1. Market Analysis, Insights and Forecast - by Application
- 7. South America Supercomputer System Analysis, Insights and Forecast, 2020-2032
- 7.1. Market Analysis, Insights and Forecast - by Application
- 7.1.1. Scientific Research
- 7.1.2. Medical
- 7.1.3. Industrial
- 7.1.4. National Defense
- 7.1.5. Others
- 7.2. Market Analysis, Insights and Forecast - by Type
- 7.2.1. Exascale
- 7.2.2. Petascale
- 7.2.3. Others
- 7.1. Market Analysis, Insights and Forecast - by Application
- 8. Europe Supercomputer System Analysis, Insights and Forecast, 2020-2032
- 8.1. Market Analysis, Insights and Forecast - by Application
- 8.1.1. Scientific Research
- 8.1.2. Medical
- 8.1.3. Industrial
- 8.1.4. National Defense
- 8.1.5. Others
- 8.2. Market Analysis, Insights and Forecast - by Type
- 8.2.1. Exascale
- 8.2.2. Petascale
- 8.2.3. Others
- 8.1. Market Analysis, Insights and Forecast - by Application
- 9. Middle East & Africa Supercomputer System Analysis, Insights and Forecast, 2020-2032
- 9.1. Market Analysis, Insights and Forecast - by Application
- 9.1.1. Scientific Research
- 9.1.2. Medical
- 9.1.3. Industrial
- 9.1.4. National Defense
- 9.1.5. Others
- 9.2. Market Analysis, Insights and Forecast - by Type
- 9.2.1. Exascale
- 9.2.2. Petascale
- 9.2.3. Others
- 9.1. Market Analysis, Insights and Forecast - by Application
- 10. Asia Pacific Supercomputer System Analysis, Insights and Forecast, 2020-2032
- 10.1. Market Analysis, Insights and Forecast - by Application
- 10.1.1. Scientific Research
- 10.1.2. Medical
- 10.1.3. Industrial
- 10.1.4. National Defense
- 10.1.5. Others
- 10.2. Market Analysis, Insights and Forecast - by Type
- 10.2.1. Exascale
- 10.2.2. Petascale
- 10.2.3. Others
- 10.1. Market Analysis, Insights and Forecast - by Application
- 11. Competitive Analysis
- 11.1. Global Market Share Analysis 2025
- 11.2. Company Profiles
- 11.2.1 IBM
- 11.2.1.1. Overview
- 11.2.1.2. Products
- 11.2.1.3. SWOT Analysis
- 11.2.1.4. Recent Developments
- 11.2.1.5. Financials (Based on Availability)
- 11.2.2 AMD
- 11.2.2.1. Overview
- 11.2.2.2. Products
- 11.2.2.3. SWOT Analysis
- 11.2.2.4. Recent Developments
- 11.2.2.5. Financials (Based on Availability)
- 11.2.3 HPE
- 11.2.3.1. Overview
- 11.2.3.2. Products
- 11.2.3.3. SWOT Analysis
- 11.2.3.4. Recent Developments
- 11.2.3.5. Financials (Based on Availability)
- 11.2.4 Dell
- 11.2.4.1. Overview
- 11.2.4.2. Products
- 11.2.4.3. SWOT Analysis
- 11.2.4.4. Recent Developments
- 11.2.4.5. Financials (Based on Availability)
- 11.2.5 Intel
- 11.2.5.1. Overview
- 11.2.5.2. Products
- 11.2.5.3. SWOT Analysis
- 11.2.5.4. Recent Developments
- 11.2.5.5. Financials (Based on Availability)
- 11.2.6 Lenovo
- 11.2.6.1. Overview
- 11.2.6.2. Products
- 11.2.6.3. SWOT Analysis
- 11.2.6.4. Recent Developments
- 11.2.6.5. Financials (Based on Availability)
- 11.2.7 Microsoft
- 11.2.7.1. Overview
- 11.2.7.2. Products
- 11.2.7.3. SWOT Analysis
- 11.2.7.4. Recent Developments
- 11.2.7.5. Financials (Based on Availability)
- 11.2.8 NVIDIA
- 11.2.8.1. Overview
- 11.2.8.2. Products
- 11.2.8.3. SWOT Analysis
- 11.2.8.4. Recent Developments
- 11.2.8.5. Financials (Based on Availability)
- 11.2.9 Fujitsu
- 11.2.9.1. Overview
- 11.2.9.2. Products
- 11.2.9.3. SWOT Analysis
- 11.2.9.4. Recent Developments
- 11.2.9.5. Financials (Based on Availability)
- 11.2.10 Atos
- 11.2.10.1. Overview
- 11.2.10.2. Products
- 11.2.10.3. SWOT Analysis
- 11.2.10.4. Recent Developments
- 11.2.10.5. Financials (Based on Availability)
- 11.2.11 Sugon
- 11.2.11.1. Overview
- 11.2.11.2. Products
- 11.2.11.3. SWOT Analysis
- 11.2.11.4. Recent Developments
- 11.2.11.5. Financials (Based on Availability)
- 11.2.1 IBM
List of Figures
- Figure 1: Global Supercomputer System Revenue Breakdown (undefined, %) by Region 2025 & 2033
- Figure 2: Global Supercomputer System Volume Breakdown (K, %) by Region 2025 & 2033
- Figure 3: North America Supercomputer System Revenue (undefined), by Application 2025 & 2033
- Figure 4: North America Supercomputer System Volume (K), by Application 2025 & 2033
- Figure 5: North America Supercomputer System Revenue Share (%), by Application 2025 & 2033
- Figure 6: North America Supercomputer System Volume Share (%), by Application 2025 & 2033
- Figure 7: North America Supercomputer System Revenue (undefined), by Type 2025 & 2033
- Figure 8: North America Supercomputer System Volume (K), by Type 2025 & 2033
- Figure 9: North America Supercomputer System Revenue Share (%), by Type 2025 & 2033
- Figure 10: North America Supercomputer System Volume Share (%), by Type 2025 & 2033
- Figure 11: North America Supercomputer System Revenue (undefined), by Country 2025 & 2033
- Figure 12: North America Supercomputer System Volume (K), by Country 2025 & 2033
- Figure 13: North America Supercomputer System Revenue Share (%), by Country 2025 & 2033
- Figure 14: North America Supercomputer System Volume Share (%), by Country 2025 & 2033
- Figure 15: South America Supercomputer System Revenue (undefined), by Application 2025 & 2033
- Figure 16: South America Supercomputer System Volume (K), by Application 2025 & 2033
- Figure 17: South America Supercomputer System Revenue Share (%), by Application 2025 & 2033
- Figure 18: South America Supercomputer System Volume Share (%), by Application 2025 & 2033
- Figure 19: South America Supercomputer System Revenue (undefined), by Type 2025 & 2033
- Figure 20: South America Supercomputer System Volume (K), by Type 2025 & 2033
- Figure 21: South America Supercomputer System Revenue Share (%), by Type 2025 & 2033
- Figure 22: South America Supercomputer System Volume Share (%), by Type 2025 & 2033
- Figure 23: South America Supercomputer System Revenue (undefined), by Country 2025 & 2033
- Figure 24: South America Supercomputer System Volume (K), by Country 2025 & 2033
- Figure 25: South America Supercomputer System Revenue Share (%), by Country 2025 & 2033
- Figure 26: South America Supercomputer System Volume Share (%), by Country 2025 & 2033
- Figure 27: Europe Supercomputer System Revenue (undefined), by Application 2025 & 2033
- Figure 28: Europe Supercomputer System Volume (K), by Application 2025 & 2033
- Figure 29: Europe Supercomputer System Revenue Share (%), by Application 2025 & 2033
- Figure 30: Europe Supercomputer System Volume Share (%), by Application 2025 & 2033
- Figure 31: Europe Supercomputer System Revenue (undefined), by Type 2025 & 2033
- Figure 32: Europe Supercomputer System Volume (K), by Type 2025 & 2033
- Figure 33: Europe Supercomputer System Revenue Share (%), by Type 2025 & 2033
- Figure 34: Europe Supercomputer System Volume Share (%), by Type 2025 & 2033
- Figure 35: Europe Supercomputer System Revenue (undefined), by Country 2025 & 2033
- Figure 36: Europe Supercomputer System Volume (K), by Country 2025 & 2033
- Figure 37: Europe Supercomputer System Revenue Share (%), by Country 2025 & 2033
- Figure 38: Europe Supercomputer System Volume Share (%), by Country 2025 & 2033
- Figure 39: Middle East & Africa Supercomputer System Revenue (undefined), by Application 2025 & 2033
- Figure 40: Middle East & Africa Supercomputer System Volume (K), by Application 2025 & 2033
- Figure 41: Middle East & Africa Supercomputer System Revenue Share (%), by Application 2025 & 2033
- Figure 42: Middle East & Africa Supercomputer System Volume Share (%), by Application 2025 & 2033
- Figure 43: Middle East & Africa Supercomputer System Revenue (undefined), by Type 2025 & 2033
- Figure 44: Middle East & Africa Supercomputer System Volume (K), by Type 2025 & 2033
- Figure 45: Middle East & Africa Supercomputer System Revenue Share (%), by Type 2025 & 2033
- Figure 46: Middle East & Africa Supercomputer System Volume Share (%), by Type 2025 & 2033
- Figure 47: Middle East & Africa Supercomputer System Revenue (undefined), by Country 2025 & 2033
- Figure 48: Middle East & Africa Supercomputer System Volume (K), by Country 2025 & 2033
- Figure 49: Middle East & Africa Supercomputer System Revenue Share (%), by Country 2025 & 2033
- Figure 50: Middle East & Africa Supercomputer System Volume Share (%), by Country 2025 & 2033
- Figure 51: Asia Pacific Supercomputer System Revenue (undefined), by Application 2025 & 2033
- Figure 52: Asia Pacific Supercomputer System Volume (K), by Application 2025 & 2033
- Figure 53: Asia Pacific Supercomputer System Revenue Share (%), by Application 2025 & 2033
- Figure 54: Asia Pacific Supercomputer System Volume Share (%), by Application 2025 & 2033
- Figure 55: Asia Pacific Supercomputer System Revenue (undefined), by Type 2025 & 2033
- Figure 56: Asia Pacific Supercomputer System Volume (K), by Type 2025 & 2033
- Figure 57: Asia Pacific Supercomputer System Revenue Share (%), by Type 2025 & 2033
- Figure 58: Asia Pacific Supercomputer System Volume Share (%), by Type 2025 & 2033
- Figure 59: Asia Pacific Supercomputer System Revenue (undefined), by Country 2025 & 2033
- Figure 60: Asia Pacific Supercomputer System Volume (K), by Country 2025 & 2033
- Figure 61: Asia Pacific Supercomputer System Revenue Share (%), by Country 2025 & 2033
- Figure 62: Asia Pacific Supercomputer System Volume Share (%), by Country 2025 & 2033
List of Tables
- Table 1: Global Supercomputer System Revenue undefined Forecast, by Application 2020 & 2033
- Table 2: Global Supercomputer System Volume K Forecast, by Application 2020 & 2033
- Table 3: Global Supercomputer System Revenue undefined Forecast, by Type 2020 & 2033
- Table 4: Global Supercomputer System Volume K Forecast, by Type 2020 & 2033
- Table 5: Global Supercomputer System Revenue undefined Forecast, by Region 2020 & 2033
- Table 6: Global Supercomputer System Volume K Forecast, by Region 2020 & 2033
- Table 7: Global Supercomputer System Revenue undefined Forecast, by Application 2020 & 2033
- Table 8: Global Supercomputer System Volume K Forecast, by Application 2020 & 2033
- Table 9: Global Supercomputer System Revenue undefined Forecast, by Type 2020 & 2033
- Table 10: Global Supercomputer System Volume K Forecast, by Type 2020 & 2033
- Table 11: Global Supercomputer System Revenue undefined Forecast, by Country 2020 & 2033
- Table 12: Global Supercomputer System Volume K Forecast, by Country 2020 & 2033
- Table 13: United States Supercomputer System Revenue (undefined) Forecast, by Application 2020 & 2033
- Table 14: United States Supercomputer System Volume (K) Forecast, by Application 2020 & 2033
- Table 15: Canada Supercomputer System Revenue (undefined) Forecast, by Application 2020 & 2033
- Table 16: Canada Supercomputer System Volume (K) Forecast, by Application 2020 & 2033
- Table 17: Mexico Supercomputer System Revenue (undefined) Forecast, by Application 2020 & 2033
- Table 18: Mexico Supercomputer System Volume (K) Forecast, by Application 2020 & 2033
- Table 19: Global Supercomputer System Revenue undefined Forecast, by Application 2020 & 2033
- Table 20: Global Supercomputer System Volume K Forecast, by Application 2020 & 2033
- Table 21: Global Supercomputer System Revenue undefined Forecast, by Type 2020 & 2033
- Table 22: Global Supercomputer System Volume K Forecast, by Type 2020 & 2033
- Table 23: Global Supercomputer System Revenue undefined Forecast, by Country 2020 & 2033
- Table 24: Global Supercomputer System Volume K Forecast, by Country 2020 & 2033
- Table 25: Brazil Supercomputer System Revenue (undefined) Forecast, by Application 2020 & 2033
- Table 26: Brazil Supercomputer System Volume (K) Forecast, by Application 2020 & 2033
- Table 27: Argentina Supercomputer System Revenue (undefined) Forecast, by Application 2020 & 2033
- Table 28: Argentina Supercomputer System Volume (K) Forecast, by Application 2020 & 2033
- Table 29: Rest of South America Supercomputer System Revenue (undefined) Forecast, by Application 2020 & 2033
- Table 30: Rest of South America Supercomputer System Volume (K) Forecast, by Application 2020 & 2033
- Table 31: Global Supercomputer System Revenue undefined Forecast, by Application 2020 & 2033
- Table 32: Global Supercomputer System Volume K Forecast, by Application 2020 & 2033
- Table 33: Global Supercomputer System Revenue undefined Forecast, by Type 2020 & 2033
- Table 34: Global Supercomputer System Volume K Forecast, by Type 2020 & 2033
- Table 35: Global Supercomputer System Revenue undefined Forecast, by Country 2020 & 2033
- Table 36: Global Supercomputer System Volume K Forecast, by Country 2020 & 2033
- Table 37: United Kingdom Supercomputer System Revenue (undefined) Forecast, by Application 2020 & 2033
- Table 38: United Kingdom Supercomputer System Volume (K) Forecast, by Application 2020 & 2033
- Table 39: Germany Supercomputer System Revenue (undefined) Forecast, by Application 2020 & 2033
- Table 40: Germany Supercomputer System Volume (K) Forecast, by Application 2020 & 2033
- Table 41: France Supercomputer System Revenue (undefined) Forecast, by Application 2020 & 2033
- Table 42: France Supercomputer System Volume (K) Forecast, by Application 2020 & 2033
- Table 43: Italy Supercomputer System Revenue (undefined) Forecast, by Application 2020 & 2033
- Table 44: Italy Supercomputer System Volume (K) Forecast, by Application 2020 & 2033
- Table 45: Spain Supercomputer System Revenue (undefined) Forecast, by Application 2020 & 2033
- Table 46: Spain Supercomputer System Volume (K) Forecast, by Application 2020 & 2033
- Table 47: Russia Supercomputer System Revenue (undefined) Forecast, by Application 2020 & 2033
- Table 48: Russia Supercomputer System Volume (K) Forecast, by Application 2020 & 2033
- Table 49: Benelux Supercomputer System Revenue (undefined) Forecast, by Application 2020 & 2033
- Table 50: Benelux Supercomputer System Volume (K) Forecast, by Application 2020 & 2033
- Table 51: Nordics Supercomputer System Revenue (undefined) Forecast, by Application 2020 & 2033
- Table 52: Nordics Supercomputer System Volume (K) Forecast, by Application 2020 & 2033
- Table 53: Rest of Europe Supercomputer System Revenue (undefined) Forecast, by Application 2020 & 2033
- Table 54: Rest of Europe Supercomputer System Volume (K) Forecast, by Application 2020 & 2033
- Table 55: Global Supercomputer System Revenue undefined Forecast, by Application 2020 & 2033
- Table 56: Global Supercomputer System Volume K Forecast, by Application 2020 & 2033
- Table 57: Global Supercomputer System Revenue undefined Forecast, by Type 2020 & 2033
- Table 58: Global Supercomputer System Volume K Forecast, by Type 2020 & 2033
- Table 59: Global Supercomputer System Revenue undefined Forecast, by Country 2020 & 2033
- Table 60: Global Supercomputer System Volume K Forecast, by Country 2020 & 2033
- Table 61: Turkey Supercomputer System Revenue (undefined) Forecast, by Application 2020 & 2033
- Table 62: Turkey Supercomputer System Volume (K) Forecast, by Application 2020 & 2033
- Table 63: Israel Supercomputer System Revenue (undefined) Forecast, by Application 2020 & 2033
- Table 64: Israel Supercomputer System Volume (K) Forecast, by Application 2020 & 2033
- Table 65: GCC Supercomputer System Revenue (undefined) Forecast, by Application 2020 & 2033
- Table 66: GCC Supercomputer System Volume (K) Forecast, by Application 2020 & 2033
- Table 67: North Africa Supercomputer System Revenue (undefined) Forecast, by Application 2020 & 2033
- Table 68: North Africa Supercomputer System Volume (K) Forecast, by Application 2020 & 2033
- Table 69: South Africa Supercomputer System Revenue (undefined) Forecast, by Application 2020 & 2033
- Table 70: South Africa Supercomputer System Volume (K) Forecast, by Application 2020 & 2033
- Table 71: Rest of Middle East & Africa Supercomputer System Revenue (undefined) Forecast, by Application 2020 & 2033
- Table 72: Rest of Middle East & Africa Supercomputer System Volume (K) Forecast, by Application 2020 & 2033
- Table 73: Global Supercomputer System Revenue undefined Forecast, by Application 2020 & 2033
- Table 74: Global Supercomputer System Volume K Forecast, by Application 2020 & 2033
- Table 75: Global Supercomputer System Revenue undefined Forecast, by Type 2020 & 2033
- Table 76: Global Supercomputer System Volume K Forecast, by Type 2020 & 2033
- Table 77: Global Supercomputer System Revenue undefined Forecast, by Country 2020 & 2033
- Table 78: Global Supercomputer System Volume K Forecast, by Country 2020 & 2033
- Table 79: China Supercomputer System Revenue (undefined) Forecast, by Application 2020 & 2033
- Table 80: China Supercomputer System Volume (K) Forecast, by Application 2020 & 2033
- Table 81: India Supercomputer System Revenue (undefined) Forecast, by Application 2020 & 2033
- Table 82: India Supercomputer System Volume (K) Forecast, by Application 2020 & 2033
- Table 83: Japan Supercomputer System Revenue (undefined) Forecast, by Application 2020 & 2033
- Table 84: Japan Supercomputer System Volume (K) Forecast, by Application 2020 & 2033
- Table 85: South Korea Supercomputer System Revenue (undefined) Forecast, by Application 2020 & 2033
- Table 86: South Korea Supercomputer System Volume (K) Forecast, by Application 2020 & 2033
- Table 87: ASEAN Supercomputer System Revenue (undefined) Forecast, by Application 2020 & 2033
- Table 88: ASEAN Supercomputer System Volume (K) Forecast, by Application 2020 & 2033
- Table 89: Oceania Supercomputer System Revenue (undefined) Forecast, by Application 2020 & 2033
- Table 90: Oceania Supercomputer System Volume (K) Forecast, by Application 2020 & 2033
- Table 91: Rest of Asia Pacific Supercomputer System Revenue (undefined) Forecast, by Application 2020 & 2033
- Table 92: Rest of Asia Pacific Supercomputer System Volume (K) Forecast, by Application 2020 & 2033
Frequently Asked Questions
1. What is the projected Compound Annual Growth Rate (CAGR) of the Supercomputer System?
The projected CAGR is approximately 19.7%.
2. Which companies are prominent players in the Supercomputer System?
Key companies in the market include IBM, AMD, HPE, Dell, Intel, Lenovo, Microsoft, NVIDIA, Fujitsu, Atos, Sugon.
3. What are the main segments of the Supercomputer System?
The market segments include Application, Type.
4. Can you provide details about the market size?
The market size is estimated to be USD XXX N/A as of 2022.
5. What are some drivers contributing to market growth?
N/A
6. What are the notable trends driving market growth?
N/A
7. Are there any restraints impacting market growth?
N/A
8. Can you provide examples of recent developments in the market?
N/A
9. What pricing options are available for accessing the report?
Pricing options include single-user, multi-user, and enterprise licenses priced at USD 3950.00, USD 5925.00, and USD 7900.00 respectively.
10. Is the market size provided in terms of value or volume?
The market size is provided in terms of value, measured in N/A and volume, measured in K.
11. Are there any specific market keywords associated with the report?
Yes, the market keyword associated with the report is "Supercomputer System," which aids in identifying and referencing the specific market segment covered.
12. How do I determine which pricing option suits my needs best?
The pricing options vary based on user requirements and access needs. Individual users may opt for single-user licenses, while businesses requiring broader access may choose multi-user or enterprise licenses for cost-effective access to the report.
13. Are there any additional resources or data provided in the Supercomputer System report?
While the report offers comprehensive insights, it's advisable to review the specific contents or supplementary materials provided to ascertain if additional resources or data are available.
14. How can I stay updated on further developments or reports in the Supercomputer System?
To stay informed about further developments, trends, and reports in the Supercomputer System, consider subscribing to industry newsletters, following relevant companies and organizations, or regularly checking reputable industry news sources and publications.
Methodology
Step 1 - Identification of Relevant Samples Size from Population Database


Step 2 - Approaches for Defining Global Market Size (Value, Volume* & Price*)

Note*: In applicable scenarios
Step 3 - Data Sources
Primary Research
- Web Analytics
- Survey Reports
- Research Institute
- Latest Research Reports
- Opinion Leaders
Secondary Research
- Annual Reports
- White Paper
- Latest Press Release
- Industry Association
- Paid Database
- Investor Presentations

Step 4 - Data Triangulation
Involves using different sources of information in order to increase the validity of a study
These sources are likely to be stakeholders in a program - participants, other researchers, program staff, other community members, and so on.
Then we put all data in single framework & apply various statistical tools to find out the dynamic on the market.
During the analysis stage, feedback from the stakeholder groups would be compared to determine areas of agreement as well as areas of divergence