


Key Insights
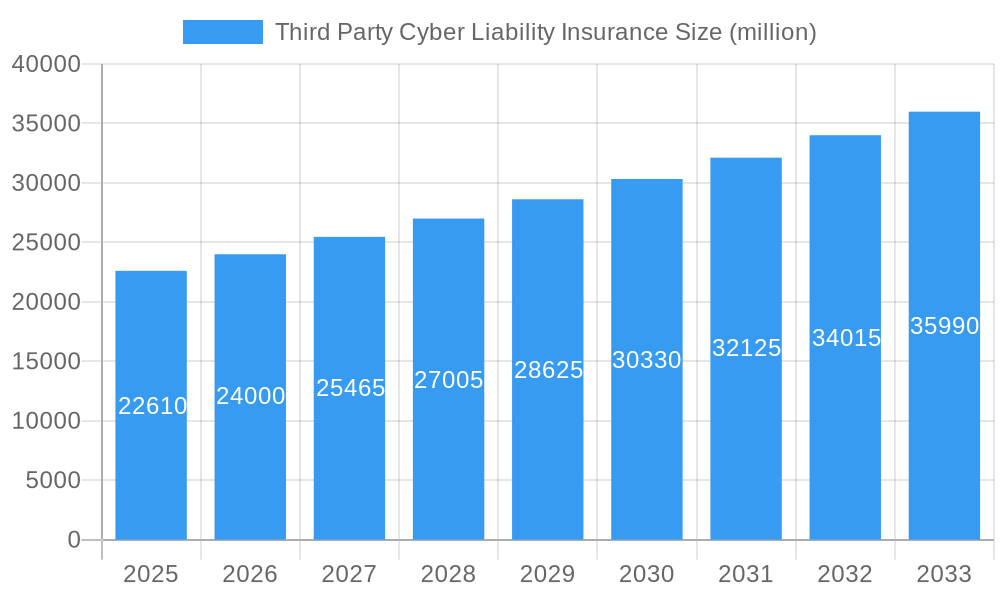
The global Third Party Cyber Liability Insurance market is experiencing robust growth, projected to reach USD 22,610 million by 2025, with a compelling Compound Annual Growth Rate (CAGR) of 6.1% over the forecast period of 2025-2033. This expansion is primarily fueled by the escalating frequency and sophistication of cyber threats that can lead to significant financial and reputational damages for businesses. As organizations increasingly rely on digital infrastructure and third-party service providers, the potential for data breaches and service disruptions originating from these external relationships grows, making cyber liability insurance a critical risk management tool. Key drivers include the growing awareness of cyber risks, stringent regulatory compliance mandates such as GDPR and CCPA, and the increasing adoption of cloud computing and IoT devices, which expand the attack surface. The market is also witnessing a surge in demand from sectors heavily reliant on sensitive data and complex IT ecosystems, including Financial Services, Information and Communication Technology, and Healthcare, where the impact of a cyber incident can be particularly devastating.
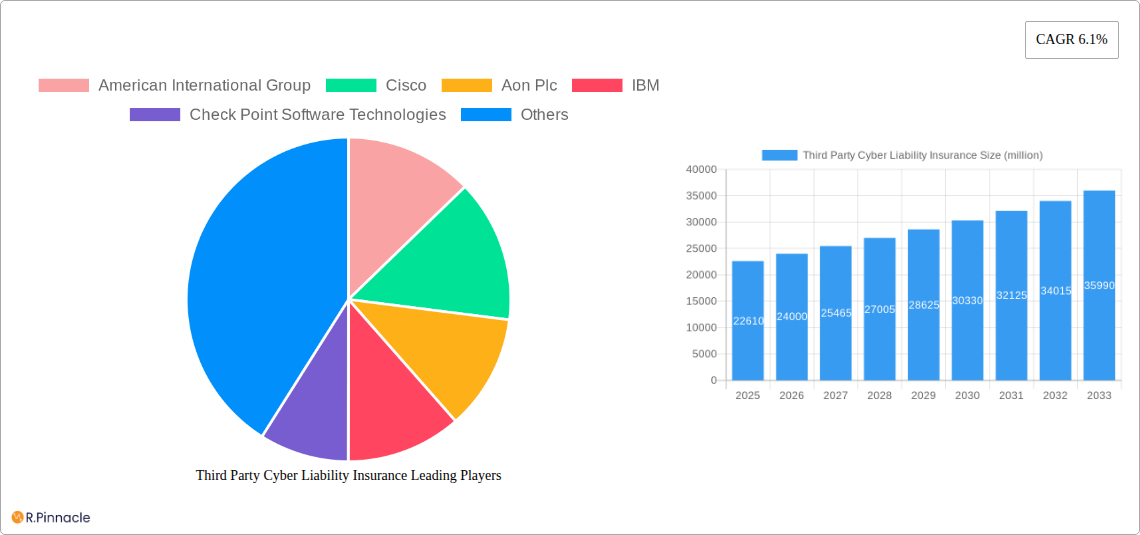
Third Party Cyber Liability Insurance Market Size (In Billion)

The market's dynamism is further shaped by evolving trends and strategic initiatives undertaken by major industry players. Companies are not only focusing on providing comprehensive insurance coverage but also investing heavily in risk mitigation services, cybersecurity consulting, and incident response planning to add value beyond traditional policies. The solutions segment is expected to see substantial growth as insurers develop more tailored and proactive cyber risk management offerings. However, challenges such as the rising cost of cyber claims, the difficulty in accurately pricing cyber risk due to its evolving nature, and a persistent talent gap in cybersecurity expertise present ongoing restraints. Despite these challenges, the sheer volume of data generated and processed, coupled with the interconnectedness of global supply chains, ensures a sustained demand for third-party cyber liability insurance, positioning it as an indispensable component of modern enterprise risk management strategies. The projected market size underscores the significant financial implications of cyber incidents and the proactive steps businesses are taking to safeguard themselves.
Third Party Cyber Liability Insurance Company Market Share
Unlock Strategic Insights: Third Party Cyber Liability Insurance Market Report 2019–2033
Navigate the evolving landscape of third-party cyber risk with our comprehensive market analysis. This in-depth report provides actionable intelligence for industry professionals, covering market dynamics, key players, and future projections within the third-party cyber liability insurance sector. Leverage data-driven insights to understand market concentration, innovation trends, and the strategic moves of leading companies.
Third Party Cyber Liability Insurance Market Structure & Innovation Trends
The third-party cyber liability insurance market exhibits a moderate to high concentration, with a few dominant players like American International Group (AIG), Aon Plc, and TechInsurance holding significant market share, estimated at over 70% combined in the base year of 2025. Innovation is primarily driven by the increasing sophistication of cyber threats and the growing need for comprehensive coverage against indirect damages arising from data breaches impacting clients and partners. Key innovation drivers include the development of proactive risk assessment tools, enhanced claims management platforms, and tailored policy offerings to address sector-specific vulnerabilities. Regulatory frameworks, such as GDPR and CCPA, continue to shape policy design, pushing insurers to offer robust coverage for third-party liabilities. Product substitutes are limited, with traditional business interruption insurance offering only partial protection. End-user demographics span across all industries, with a particular focus on Information and Communication Technology (ICT) and Financial Services, where the potential for widespread third-party impact is highest. Mergers and acquisitions (M&A) activity is on the rise, with significant deal values anticipated in the forecast period, driven by the need for scale and expanded service portfolios. For instance, M&A deals are projected to reach an aggregate value exceeding 500 million by 2028, as larger entities seek to consolidate their market position and acquire specialized cyber risk management capabilities.
Third Party Cyber Liability Insurance Market Dynamics & Trends
The third-party cyber liability insurance market is experiencing robust growth, fueled by a confluence of escalating cyber threats, increasing regulatory scrutiny, and a growing awareness of interconnected digital risks. The compound annual growth rate (CAGR) is projected to be XX% during the forecast period of 2025–2033, indicating substantial market expansion. Technological disruptions, such as the pervasive adoption of cloud computing, the Internet of Things (IoT), and advanced AI-driven cyberattacks, have created new avenues for third-party liability. Companies are increasingly reliant on third-party vendors and service providers, making them vulnerable to breaches originating from these external entities. This heightened exposure is a primary growth driver. Consumer preferences are shifting towards more comprehensive and proactive risk management solutions. Businesses are no longer content with simply indemnifying losses; they are actively seeking insurance policies that offer pre-incident services like cybersecurity assessments, incident response planning, and breach notification support. This trend is evident in the increasing market penetration of bundled cyber insurance solutions, estimated to reach XX% by 2030. Competitive dynamics are intense, with established insurers, specialized cyber insurers, and even technology companies like Amazon Web Services (AWS) and IBM vying for market share. Insurers are differentiating themselves through the breadth of their coverage, the sophistication of their risk mitigation services, and the agility of their claims processing. The historical period (2019–2024) saw a significant uptick in cyber claims frequency and severity, underscoring the need for adequate third-party cyber liability coverage and setting the stage for accelerated growth in the subsequent years. The evolving threat landscape, coupled with a proactive stance from businesses and regulators, paints a promising picture for the future of this market.
Dominant Regions & Segments in Third Party Cyber Liability Insurance
The Information and Communication Technology (ICT) segment is projected to maintain its dominance within the third-party cyber liability insurance market throughout the forecast period (2025–2033). This supremacy is underpinned by several key drivers.
- High Interconnectivity: The ICT sector is inherently interconnected, with extensive reliance on cloud services, third-party software, and outsourced IT infrastructure. A single breach within an ICT provider can have cascading effects across numerous client organizations, dramatically increasing the potential for third-party liability claims.
- Data Sensitivity: ICT companies handle vast amounts of sensitive data, making them prime targets for cybercriminals. The exposure to breaches involving client data, intellectual property, and proprietary information directly translates to a higher demand for comprehensive third-party cyber liability insurance.
- Regulatory Compliance: Stricter data protection regulations, such as GDPR and similar legislation globally, impose significant penalties on organizations for data breaches, including those caused by their vendors. This necessitates robust insurance coverage to mitigate these risks.
- Technological Sophistication: The rapid pace of technological advancement in the ICT sector, while driving innovation, also introduces new vulnerabilities. Advanced threats like zero-day exploits and sophisticated ransomware attacks originating from ICT infrastructure can lead to substantial third-party damages.
Geographical Dominance: While the market is global, North America is expected to continue its leadership position. This dominance is driven by a mature regulatory environment, high adoption of digital technologies, and a significant concentration of large enterprises with substantial cyber risk exposure. Countries like the United States and Canada have well-established insurance markets and a strong awareness of cyber threats. Economic policies in these regions often encourage innovation and digital transformation, further expanding the attack surface and, consequently, the demand for cyber insurance. The presence of major technology hubs and a high density of financial services institutions, which are particularly vulnerable to third-party cyber risks, also contributes to North America's leading role. Furthermore, robust infrastructure supporting cybersecurity solutions and a proactive approach to cybersecurity by both businesses and governments solidify its position.
Within the Type segmentation, Services are expected to see substantial growth, complementing the "Solutions" aspect of cyber insurance. This includes incident response, forensic analysis, legal support, and public relations services offered as part of the insurance package.
Third Party Cyber Liability Insurance Product Innovations
Recent product innovations in third-party cyber liability insurance focus on enhanced coverage for evolving threats and expanded service offerings. Insurers are increasingly integrating proactive risk management tools, such as advanced vulnerability scanning and threat intelligence feeds, directly into their policies. This allows policyholders to identify and mitigate risks before they escalate into claims. Furthermore, there's a growing trend towards offering tailored coverage for specific industry verticals, recognizing that risks vary significantly between sectors like Financial Services and Manufacturing. Competitive advantages are being gained by insurers who can provide comprehensive incident response capabilities, including access to specialized cybersecurity firms and legal counsel, thereby offering a more holistic risk mitigation solution rather than just financial indemnity.
Report Scope & Segmentation Analysis
This report segments the third-party cyber liability insurance market across key applications and types, providing a granular view of market dynamics.
Application Segmentation:
- Information and Communication Technology (ICT): Expected to maintain the largest market share, driven by high interconnectivity and data sensitivity. Growth projections are strong, with market size in 2025 estimated at XX million. Competitive dynamics are characterized by a focus on vendor risk management.
- Financial Services: A significant segment, driven by stringent regulations and the critical nature of financial data. Growth is projected at XX% CAGR. Market size for 2025 is estimated at XX million.
- Manufacturing: Growing segment due to increased automation and IoT adoption in factories, leading to new cyber vulnerabilities. Growth projected at XX% CAGR. Market size for 2025 is estimated at XX million.
- Retail: Experiencing steady growth as online retail expands and customer data becomes more valuable. Growth projected at XX% CAGR. Market size for 2025 is estimated at XX million.
- Healthcare: High growth potential due to the sensitive nature of patient data and increasing digitization of healthcare systems. Growth projected at XX% CAGR. Market size for 2025 is estimated at XX million.
- Others: Encompasses a broad range of industries with emerging cyber risks.
Type Segmentation:
- Solutions: Refers to the core insurance policies providing financial protection.
- Services: Includes proactive and reactive services like risk assessment, incident response, and breach notification. This segment is projected to grow at a higher CAGR due to increasing demand for comprehensive risk management.
Key Drivers of Third Party Cyber Liability Insurance Growth
The growth of the third-party cyber liability insurance market is propelled by several interconnected factors.
- Escalating Cyber Threats: The sheer volume and sophistication of cyberattacks, including ransomware, phishing, and state-sponsored attacks, continue to increase, creating a heightened awareness of potential damages from third-party breaches.
- Regulatory Landscape: Evolving data privacy regulations globally, such as GDPR and CCPA, impose significant penalties for data breaches, directly impacting organizations whose third-party vendors are compromised.
- Increased Reliance on Third-Party Vendors: Businesses are increasingly outsourcing critical functions and relying on cloud services, expanding their attack surface through external dependencies.
- Digital Transformation: The ongoing digital transformation across all industries necessitates greater investment in cybersecurity and, consequently, in insurance to cover residual risks.
Challenges in the Third Party Cyber Liability Insurance Sector
Despite robust growth, the third-party cyber liability insurance sector faces several significant challenges.
- Underwriting Complexity: Accurately assessing and pricing the risk associated with a myriad of third-party vendor relationships remains a complex challenge for insurers.
- Limited Data Availability: The scarcity of historical, standardized data on third-party cyber incidents can hinder accurate risk modeling and underwriting.
- Evolving Threat Landscape: The rapid evolution of cyber threats means that policy wordings and coverage need constant reevaluation to remain relevant and effective.
- Talent Shortage: A global shortage of skilled cybersecurity professionals, including those with expertise in cyber insurance underwriting and claims management, poses a significant operational hurdle.
Emerging Opportunities in Third Party Cyber Liability Insurance
Emerging opportunities in the third-party cyber liability insurance sector are abundant, driven by technological advancements and evolving business needs.
- Insurtech Innovations: The integration of artificial intelligence (AI), machine learning (ML), and blockchain technology offers significant potential for improved risk assessment, fraud detection, and claims processing efficiency.
- Expansion into Emerging Markets: As developing economies continue their digital transformation journey, there is a growing demand for cyber insurance solutions, presenting a substantial opportunity for market expansion.
- Specialized Coverage: Developing highly specialized insurance products for niche industries or emerging technologies, such as quantum computing security, can capture new market segments.
- Partnerships with Cybersecurity Firms: Collaborations with cybersecurity service providers can enhance the value proposition of insurance policies by offering integrated risk management and incident response services.
Leading Players in the Third Party Cyber Liability Insurance Market
- American International Group
- Cisco
- Aon Plc
- IBM
- Check Point Software Technologies
- CyberArk
- F5 Networks
- Trellix
- Forcepoint
- Fortinet Inc
- TechInsurance
- Amazon Web Services
- Oracle
- Palo Alto Networks
- Imperva
- Qualys Inc
- Accenture
- HCL Technologies Limited
- Capgemini
- Cognizant
- Gen Digita
- Broadcom Inc
- Wipro Limited
Key Developments in Third Party Cyber Liability Insurance Industry
- 2019: Increased adoption of cloud-based cybersecurity solutions by insurers to manage their own infrastructure risks.
- 2020: Significant rise in ransomware attacks targeting supply chains, leading to a surge in third-party cyber liability claims.
- 2021: Launch of new insurance products with embedded proactive risk management services by major players like AIG.
- 2022: Growing interest in parametric cyber insurance solutions offering automated payouts based on predefined triggers.
- 2023: Increased regulatory focus on vendor risk management by financial services regulators.
- 2024 (Projected): Continued M&A activity as larger insurers seek to consolidate market share and acquire specialized cyber capabilities.
Future Outlook for Third Party Cyber Liability Insurance Market
The future outlook for the third-party cyber liability insurance market is exceptionally positive, characterized by sustained growth and evolving product offerings. The increasing complexity of the threat landscape, coupled with the growing interconnectedness of businesses through digital ecosystems, will continue to drive demand for comprehensive insurance solutions. Future growth will be accelerated by advancements in AI and machine learning, enabling more sophisticated risk assessment and personalized policy development. Emerging markets represent a significant untapped potential, as these regions undergo rapid digital transformation. Furthermore, a heightened focus on proactive risk mitigation services integrated within insurance policies will become a key differentiator, moving beyond traditional indemnification to a more holistic approach to cybersecurity resilience. Strategic partnerships and innovative product development will be crucial for market leaders to capitalize on these burgeoning opportunities.
Third Party Cyber Liability Insurance Segmentation
-
1. Application
- 1.1. Information and Communication Technology
- 1.2. Financial Services
- 1.3. Manufacturing
- 1.4. Retail
- 1.5. Healthcare
- 1.6. Others
-
2. Type
- 2.1. Solutions
- 2.2. Services
Third Party Cyber Liability Insurance Segmentation By Geography
-
1. North America
- 1.1. United States
- 1.2. Canada
- 1.3. Mexico
-
2. South America
- 2.1. Brazil
- 2.2. Argentina
- 2.3. Rest of South America
-
3. Europe
- 3.1. United Kingdom
- 3.2. Germany
- 3.3. France
- 3.4. Italy
- 3.5. Spain
- 3.6. Russia
- 3.7. Benelux
- 3.8. Nordics
- 3.9. Rest of Europe
-
4. Middle East & Africa
- 4.1. Turkey
- 4.2. Israel
- 4.3. GCC
- 4.4. North Africa
- 4.5. South Africa
- 4.6. Rest of Middle East & Africa
-
5. Asia Pacific
- 5.1. China
- 5.2. India
- 5.3. Japan
- 5.4. South Korea
- 5.5. ASEAN
- 5.6. Oceania
- 5.7. Rest of Asia Pacific
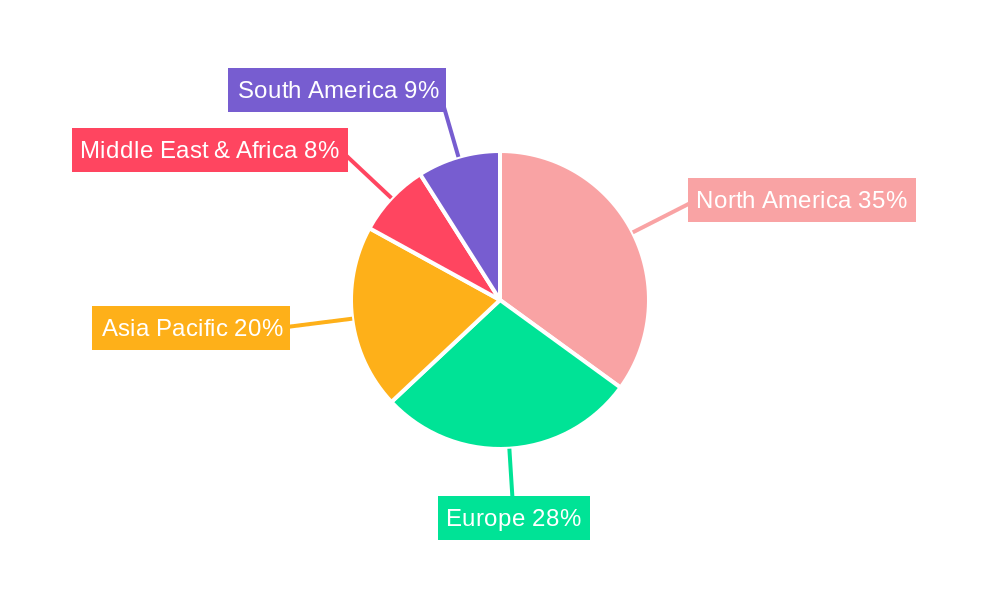
Third Party Cyber Liability Insurance Regional Market Share
Geographic Coverage of Third Party Cyber Liability Insurance
Third Party Cyber Liability Insurance REPORT HIGHLIGHTS
| Aspects | Details |
|---|---|
| Study Period | 2020-2034 |
| Base Year | 2025 |
| Estimated Year | 2026 |
| Forecast Period | 2026-2034 |
| Historical Period | 2020-2025 |
| Growth Rate | CAGR of 6.1% from 2020-2034 |
| Segmentation |
|
Table of Contents
- 1. Introduction
- 1.1. Research Scope
- 1.2. Market Segmentation
- 1.3. Research Objective
- 1.4. Definitions and Assumptions
- 2. Executive Summary
- 2.1. Market Snapshot
- 3. Market Dynamics
- 3.1. Market Drivers
- 3.2. Market Restrains
- 3.3. Market Trends
- 3.4. Market Opportunities
- 4. Market Factor Analysis
- 4.1. Porters Five Forces
- 4.1.1. Bargaining Power of Suppliers
- 4.1.2. Bargaining Power of Buyers
- 4.1.3. Threat of New Entrants
- 4.1.4. Threat of Substitutes
- 4.1.5. Competitive Rivalry
- 4.2. PESTEL analysis
- 4.3. BCG Analysis
- 4.3.1. Stars (High Growth, High Market Share)
- 4.3.2. Cash Cows (Low Growth, High Market Share)
- 4.3.3. Question Mark (High Growth, Low Market Share)
- 4.3.4. Dogs (Low Growth, Low Market Share)
- 4.4. Ansoff Matrix Analysis
- 4.5. Supply Chain Analysis
- 4.6. Regulatory Landscape
- 4.7. Current Market Potential and Opportunity Assessment (TAM–SAM–SOM Framework)
- 4.8. PRI Analyst Note
- 4.1. Porters Five Forces
- 5. Market Analysis, Insights and Forecast 2021-2033
- 5.1. Market Analysis, Insights and Forecast - by Application
- 5.1.1. Information and Communication Technology
- 5.1.2. Financial Services
- 5.1.3. Manufacturing
- 5.1.4. Retail
- 5.1.5. Healthcare
- 5.1.6. Others
- 5.2. Market Analysis, Insights and Forecast - by Type
- 5.2.1. Solutions
- 5.2.2. Services
- 5.3. Market Analysis, Insights and Forecast - by Region
- 5.3.1. North America
- 5.3.2. South America
- 5.3.3. Europe
- 5.3.4. Middle East & Africa
- 5.3.5. Asia Pacific
- 5.1. Market Analysis, Insights and Forecast - by Application
- 6. Global Third Party Cyber Liability Insurance Analysis, Insights and Forecast, 2021-2033
- 6.1. Market Analysis, Insights and Forecast - by Application
- 6.1.1. Information and Communication Technology
- 6.1.2. Financial Services
- 6.1.3. Manufacturing
- 6.1.4. Retail
- 6.1.5. Healthcare
- 6.1.6. Others
- 6.2. Market Analysis, Insights and Forecast - by Type
- 6.2.1. Solutions
- 6.2.2. Services
- 6.1. Market Analysis, Insights and Forecast - by Application
- 7. North America Third Party Cyber Liability Insurance Analysis, Insights and Forecast, 2020-2032
- 7.1. Market Analysis, Insights and Forecast - by Application
- 7.1.1. Information and Communication Technology
- 7.1.2. Financial Services
- 7.1.3. Manufacturing
- 7.1.4. Retail
- 7.1.5. Healthcare
- 7.1.6. Others
- 7.2. Market Analysis, Insights and Forecast - by Type
- 7.2.1. Solutions
- 7.2.2. Services
- 7.1. Market Analysis, Insights and Forecast - by Application
- 8. South America Third Party Cyber Liability Insurance Analysis, Insights and Forecast, 2020-2032
- 8.1. Market Analysis, Insights and Forecast - by Application
- 8.1.1. Information and Communication Technology
- 8.1.2. Financial Services
- 8.1.3. Manufacturing
- 8.1.4. Retail
- 8.1.5. Healthcare
- 8.1.6. Others
- 8.2. Market Analysis, Insights and Forecast - by Type
- 8.2.1. Solutions
- 8.2.2. Services
- 8.1. Market Analysis, Insights and Forecast - by Application
- 9. Europe Third Party Cyber Liability Insurance Analysis, Insights and Forecast, 2020-2032
- 9.1. Market Analysis, Insights and Forecast - by Application
- 9.1.1. Information and Communication Technology
- 9.1.2. Financial Services
- 9.1.3. Manufacturing
- 9.1.4. Retail
- 9.1.5. Healthcare
- 9.1.6. Others
- 9.2. Market Analysis, Insights and Forecast - by Type
- 9.2.1. Solutions
- 9.2.2. Services
- 9.1. Market Analysis, Insights and Forecast - by Application
- 10. Middle East & Africa Third Party Cyber Liability Insurance Analysis, Insights and Forecast, 2020-2032
- 10.1. Market Analysis, Insights and Forecast - by Application
- 10.1.1. Information and Communication Technology
- 10.1.2. Financial Services
- 10.1.3. Manufacturing
- 10.1.4. Retail
- 10.1.5. Healthcare
- 10.1.6. Others
- 10.2. Market Analysis, Insights and Forecast - by Type
- 10.2.1. Solutions
- 10.2.2. Services
- 10.1. Market Analysis, Insights and Forecast - by Application
- 11. Asia Pacific Third Party Cyber Liability Insurance Analysis, Insights and Forecast, 2020-2032
- 11.1. Market Analysis, Insights and Forecast - by Application
- 11.1.1. Information and Communication Technology
- 11.1.2. Financial Services
- 11.1.3. Manufacturing
- 11.1.4. Retail
- 11.1.5. Healthcare
- 11.1.6. Others
- 11.2. Market Analysis, Insights and Forecast - by Type
- 11.2.1. Solutions
- 11.2.2. Services
- 11.1. Market Analysis, Insights and Forecast - by Application
- 12. Competitive Analysis
- 12.1. Company Profiles
- 12.1.1 American International Group
- 12.1.1.1. Company Overview
- 12.1.1.2. Products
- 12.1.1.3. Company Financials
- 12.1.1.4. SWOT Analysis
- 12.1.2 Cisco
- 12.1.2.1. Company Overview
- 12.1.2.2. Products
- 12.1.2.3. Company Financials
- 12.1.2.4. SWOT Analysis
- 12.1.3 Aon Plc
- 12.1.3.1. Company Overview
- 12.1.3.2. Products
- 12.1.3.3. Company Financials
- 12.1.3.4. SWOT Analysis
- 12.1.4 IBM
- 12.1.4.1. Company Overview
- 12.1.4.2. Products
- 12.1.4.3. Company Financials
- 12.1.4.4. SWOT Analysis
- 12.1.5 Check Point Software Technologies
- 12.1.5.1. Company Overview
- 12.1.5.2. Products
- 12.1.5.3. Company Financials
- 12.1.5.4. SWOT Analysis
- 12.1.6 CyberArk
- 12.1.6.1. Company Overview
- 12.1.6.2. Products
- 12.1.6.3. Company Financials
- 12.1.6.4. SWOT Analysis
- 12.1.7 F5 Networks
- 12.1.7.1. Company Overview
- 12.1.7.2. Products
- 12.1.7.3. Company Financials
- 12.1.7.4. SWOT Analysis
- 12.1.8 Trellix
- 12.1.8.1. Company Overview
- 12.1.8.2. Products
- 12.1.8.3. Company Financials
- 12.1.8.4. SWOT Analysis
- 12.1.9 Forcepoint
- 12.1.9.1. Company Overview
- 12.1.9.2. Products
- 12.1.9.3. Company Financials
- 12.1.9.4. SWOT Analysis
- 12.1.10 Fortinet Inc
- 12.1.10.1. Company Overview
- 12.1.10.2. Products
- 12.1.10.3. Company Financials
- 12.1.10.4. SWOT Analysis
- 12.1.11 TechInsurance
- 12.1.11.1. Company Overview
- 12.1.11.2. Products
- 12.1.11.3. Company Financials
- 12.1.11.4. SWOT Analysis
- 12.1.12 Amazon Web Services
- 12.1.12.1. Company Overview
- 12.1.12.2. Products
- 12.1.12.3. Company Financials
- 12.1.12.4. SWOT Analysis
- 12.1.13 Oracle
- 12.1.13.1. Company Overview
- 12.1.13.2. Products
- 12.1.13.3. Company Financials
- 12.1.13.4. SWOT Analysis
- 12.1.14 Palo Alto Networks
- 12.1.14.1. Company Overview
- 12.1.14.2. Products
- 12.1.14.3. Company Financials
- 12.1.14.4. SWOT Analysis
- 12.1.15 Imperva
- 12.1.15.1. Company Overview
- 12.1.15.2. Products
- 12.1.15.3. Company Financials
- 12.1.15.4. SWOT Analysis
- 12.1.16 Qualys Inc
- 12.1.16.1. Company Overview
- 12.1.16.2. Products
- 12.1.16.3. Company Financials
- 12.1.16.4. SWOT Analysis
- 12.1.17 Accenture
- 12.1.17.1. Company Overview
- 12.1.17.2. Products
- 12.1.17.3. Company Financials
- 12.1.17.4. SWOT Analysis
- 12.1.18 HCL Technologies Limited
- 12.1.18.1. Company Overview
- 12.1.18.2. Products
- 12.1.18.3. Company Financials
- 12.1.18.4. SWOT Analysis
- 12.1.19 Capgemini
- 12.1.19.1. Company Overview
- 12.1.19.2. Products
- 12.1.19.3. Company Financials
- 12.1.19.4. SWOT Analysis
- 12.1.20 Cognizant
- 12.1.20.1. Company Overview
- 12.1.20.2. Products
- 12.1.20.3. Company Financials
- 12.1.20.4. SWOT Analysis
- 12.1.21 Gen Digita
- 12.1.21.1. Company Overview
- 12.1.21.2. Products
- 12.1.21.3. Company Financials
- 12.1.21.4. SWOT Analysis
- 12.1.22 Broadcom Inc
- 12.1.22.1. Company Overview
- 12.1.22.2. Products
- 12.1.22.3. Company Financials
- 12.1.22.4. SWOT Analysis
- 12.1.23 Wipro Limited
- 12.1.23.1. Company Overview
- 12.1.23.2. Products
- 12.1.23.3. Company Financials
- 12.1.23.4. SWOT Analysis
- 12.1.1 American International Group
- 12.2. Market Entropy
- 12.2.1 Company's Key Areas Served
- 12.2.2 Recent Developments
- 12.3. Company Market Share Analysis 2025
- 12.3.1 Top 5 Companies Market Share Analysis
- 12.3.2 Top 3 Companies Market Share Analysis
- 12.4. List of Potential Customers
- 13. Research Methodology
List of Figures
- Figure 1: Global Third Party Cyber Liability Insurance Revenue Breakdown (million, %) by Region 2025 & 2033
- Figure 2: North America Third Party Cyber Liability Insurance Revenue (million), by Application 2025 & 2033
- Figure 3: North America Third Party Cyber Liability Insurance Revenue Share (%), by Application 2025 & 2033
- Figure 4: North America Third Party Cyber Liability Insurance Revenue (million), by Type 2025 & 2033
- Figure 5: North America Third Party Cyber Liability Insurance Revenue Share (%), by Type 2025 & 2033
- Figure 6: North America Third Party Cyber Liability Insurance Revenue (million), by Country 2025 & 2033
- Figure 7: North America Third Party Cyber Liability Insurance Revenue Share (%), by Country 2025 & 2033
- Figure 8: South America Third Party Cyber Liability Insurance Revenue (million), by Application 2025 & 2033
- Figure 9: South America Third Party Cyber Liability Insurance Revenue Share (%), by Application 2025 & 2033
- Figure 10: South America Third Party Cyber Liability Insurance Revenue (million), by Type 2025 & 2033
- Figure 11: South America Third Party Cyber Liability Insurance Revenue Share (%), by Type 2025 & 2033
- Figure 12: South America Third Party Cyber Liability Insurance Revenue (million), by Country 2025 & 2033
- Figure 13: South America Third Party Cyber Liability Insurance Revenue Share (%), by Country 2025 & 2033
- Figure 14: Europe Third Party Cyber Liability Insurance Revenue (million), by Application 2025 & 2033
- Figure 15: Europe Third Party Cyber Liability Insurance Revenue Share (%), by Application 2025 & 2033
- Figure 16: Europe Third Party Cyber Liability Insurance Revenue (million), by Type 2025 & 2033
- Figure 17: Europe Third Party Cyber Liability Insurance Revenue Share (%), by Type 2025 & 2033
- Figure 18: Europe Third Party Cyber Liability Insurance Revenue (million), by Country 2025 & 2033
- Figure 19: Europe Third Party Cyber Liability Insurance Revenue Share (%), by Country 2025 & 2033
- Figure 20: Middle East & Africa Third Party Cyber Liability Insurance Revenue (million), by Application 2025 & 2033
- Figure 21: Middle East & Africa Third Party Cyber Liability Insurance Revenue Share (%), by Application 2025 & 2033
- Figure 22: Middle East & Africa Third Party Cyber Liability Insurance Revenue (million), by Type 2025 & 2033
- Figure 23: Middle East & Africa Third Party Cyber Liability Insurance Revenue Share (%), by Type 2025 & 2033
- Figure 24: Middle East & Africa Third Party Cyber Liability Insurance Revenue (million), by Country 2025 & 2033
- Figure 25: Middle East & Africa Third Party Cyber Liability Insurance Revenue Share (%), by Country 2025 & 2033
- Figure 26: Asia Pacific Third Party Cyber Liability Insurance Revenue (million), by Application 2025 & 2033
- Figure 27: Asia Pacific Third Party Cyber Liability Insurance Revenue Share (%), by Application 2025 & 2033
- Figure 28: Asia Pacific Third Party Cyber Liability Insurance Revenue (million), by Type 2025 & 2033
- Figure 29: Asia Pacific Third Party Cyber Liability Insurance Revenue Share (%), by Type 2025 & 2033
- Figure 30: Asia Pacific Third Party Cyber Liability Insurance Revenue (million), by Country 2025 & 2033
- Figure 31: Asia Pacific Third Party Cyber Liability Insurance Revenue Share (%), by Country 2025 & 2033
List of Tables
- Table 1: Global Third Party Cyber Liability Insurance Revenue million Forecast, by Application 2020 & 2033
- Table 2: Global Third Party Cyber Liability Insurance Revenue million Forecast, by Type 2020 & 2033
- Table 3: Global Third Party Cyber Liability Insurance Revenue million Forecast, by Region 2020 & 2033
- Table 4: Global Third Party Cyber Liability Insurance Revenue million Forecast, by Application 2020 & 2033
- Table 5: Global Third Party Cyber Liability Insurance Revenue million Forecast, by Type 2020 & 2033
- Table 6: Global Third Party Cyber Liability Insurance Revenue million Forecast, by Country 2020 & 2033
- Table 7: United States Third Party Cyber Liability Insurance Revenue (million) Forecast, by Application 2020 & 2033
- Table 8: Canada Third Party Cyber Liability Insurance Revenue (million) Forecast, by Application 2020 & 2033
- Table 9: Mexico Third Party Cyber Liability Insurance Revenue (million) Forecast, by Application 2020 & 2033
- Table 10: Global Third Party Cyber Liability Insurance Revenue million Forecast, by Application 2020 & 2033
- Table 11: Global Third Party Cyber Liability Insurance Revenue million Forecast, by Type 2020 & 2033
- Table 12: Global Third Party Cyber Liability Insurance Revenue million Forecast, by Country 2020 & 2033
- Table 13: Brazil Third Party Cyber Liability Insurance Revenue (million) Forecast, by Application 2020 & 2033
- Table 14: Argentina Third Party Cyber Liability Insurance Revenue (million) Forecast, by Application 2020 & 2033
- Table 15: Rest of South America Third Party Cyber Liability Insurance Revenue (million) Forecast, by Application 2020 & 2033
- Table 16: Global Third Party Cyber Liability Insurance Revenue million Forecast, by Application 2020 & 2033
- Table 17: Global Third Party Cyber Liability Insurance Revenue million Forecast, by Type 2020 & 2033
- Table 18: Global Third Party Cyber Liability Insurance Revenue million Forecast, by Country 2020 & 2033
- Table 19: United Kingdom Third Party Cyber Liability Insurance Revenue (million) Forecast, by Application 2020 & 2033
- Table 20: Germany Third Party Cyber Liability Insurance Revenue (million) Forecast, by Application 2020 & 2033
- Table 21: France Third Party Cyber Liability Insurance Revenue (million) Forecast, by Application 2020 & 2033
- Table 22: Italy Third Party Cyber Liability Insurance Revenue (million) Forecast, by Application 2020 & 2033
- Table 23: Spain Third Party Cyber Liability Insurance Revenue (million) Forecast, by Application 2020 & 2033
- Table 24: Russia Third Party Cyber Liability Insurance Revenue (million) Forecast, by Application 2020 & 2033
- Table 25: Benelux Third Party Cyber Liability Insurance Revenue (million) Forecast, by Application 2020 & 2033
- Table 26: Nordics Third Party Cyber Liability Insurance Revenue (million) Forecast, by Application 2020 & 2033
- Table 27: Rest of Europe Third Party Cyber Liability Insurance Revenue (million) Forecast, by Application 2020 & 2033
- Table 28: Global Third Party Cyber Liability Insurance Revenue million Forecast, by Application 2020 & 2033
- Table 29: Global Third Party Cyber Liability Insurance Revenue million Forecast, by Type 2020 & 2033
- Table 30: Global Third Party Cyber Liability Insurance Revenue million Forecast, by Country 2020 & 2033
- Table 31: Turkey Third Party Cyber Liability Insurance Revenue (million) Forecast, by Application 2020 & 2033
- Table 32: Israel Third Party Cyber Liability Insurance Revenue (million) Forecast, by Application 2020 & 2033
- Table 33: GCC Third Party Cyber Liability Insurance Revenue (million) Forecast, by Application 2020 & 2033
- Table 34: North Africa Third Party Cyber Liability Insurance Revenue (million) Forecast, by Application 2020 & 2033
- Table 35: South Africa Third Party Cyber Liability Insurance Revenue (million) Forecast, by Application 2020 & 2033
- Table 36: Rest of Middle East & Africa Third Party Cyber Liability Insurance Revenue (million) Forecast, by Application 2020 & 2033
- Table 37: Global Third Party Cyber Liability Insurance Revenue million Forecast, by Application 2020 & 2033
- Table 38: Global Third Party Cyber Liability Insurance Revenue million Forecast, by Type 2020 & 2033
- Table 39: Global Third Party Cyber Liability Insurance Revenue million Forecast, by Country 2020 & 2033
- Table 40: China Third Party Cyber Liability Insurance Revenue (million) Forecast, by Application 2020 & 2033
- Table 41: India Third Party Cyber Liability Insurance Revenue (million) Forecast, by Application 2020 & 2033
- Table 42: Japan Third Party Cyber Liability Insurance Revenue (million) Forecast, by Application 2020 & 2033
- Table 43: South Korea Third Party Cyber Liability Insurance Revenue (million) Forecast, by Application 2020 & 2033
- Table 44: ASEAN Third Party Cyber Liability Insurance Revenue (million) Forecast, by Application 2020 & 2033
- Table 45: Oceania Third Party Cyber Liability Insurance Revenue (million) Forecast, by Application 2020 & 2033
- Table 46: Rest of Asia Pacific Third Party Cyber Liability Insurance Revenue (million) Forecast, by Application 2020 & 2033
Frequently Asked Questions
1. What is the projected Compound Annual Growth Rate (CAGR) of the Third Party Cyber Liability Insurance?
The projected CAGR is approximately 6.1%.
2. Which companies are prominent players in the Third Party Cyber Liability Insurance?
Key companies in the market include American International Group, Cisco, Aon Plc, IBM, Check Point Software Technologies, CyberArk, F5 Networks, Trellix, Forcepoint, Fortinet Inc, TechInsurance, Amazon Web Services, Oracle, Palo Alto Networks, Imperva, Qualys Inc, Accenture, HCL Technologies Limited, Capgemini, Cognizant, Gen Digita, Broadcom Inc, Wipro Limited.
3. What are the main segments of the Third Party Cyber Liability Insurance?
The market segments include Application, Type.
4. Can you provide details about the market size?
The market size is estimated to be USD 22610 million as of 2022.
5. What are some drivers contributing to market growth?
N/A
6. What are the notable trends driving market growth?
N/A
7. Are there any restraints impacting market growth?
N/A
8. Can you provide examples of recent developments in the market?
N/A
9. What pricing options are available for accessing the report?
Pricing options include single-user, multi-user, and enterprise licenses priced at USD 2900.00, USD 4350.00, and USD 5800.00 respectively.
10. Is the market size provided in terms of value or volume?
The market size is provided in terms of value, measured in million.
11. Are there any specific market keywords associated with the report?
Yes, the market keyword associated with the report is "Third Party Cyber Liability Insurance," which aids in identifying and referencing the specific market segment covered.
12. How do I determine which pricing option suits my needs best?
The pricing options vary based on user requirements and access needs. Individual users may opt for single-user licenses, while businesses requiring broader access may choose multi-user or enterprise licenses for cost-effective access to the report.
13. Are there any additional resources or data provided in the Third Party Cyber Liability Insurance report?
While the report offers comprehensive insights, it's advisable to review the specific contents or supplementary materials provided to ascertain if additional resources or data are available.
14. How can I stay updated on further developments or reports in the Third Party Cyber Liability Insurance?
To stay informed about further developments, trends, and reports in the Third Party Cyber Liability Insurance, consider subscribing to industry newsletters, following relevant companies and organizations, or regularly checking reputable industry news sources and publications.
Methodology
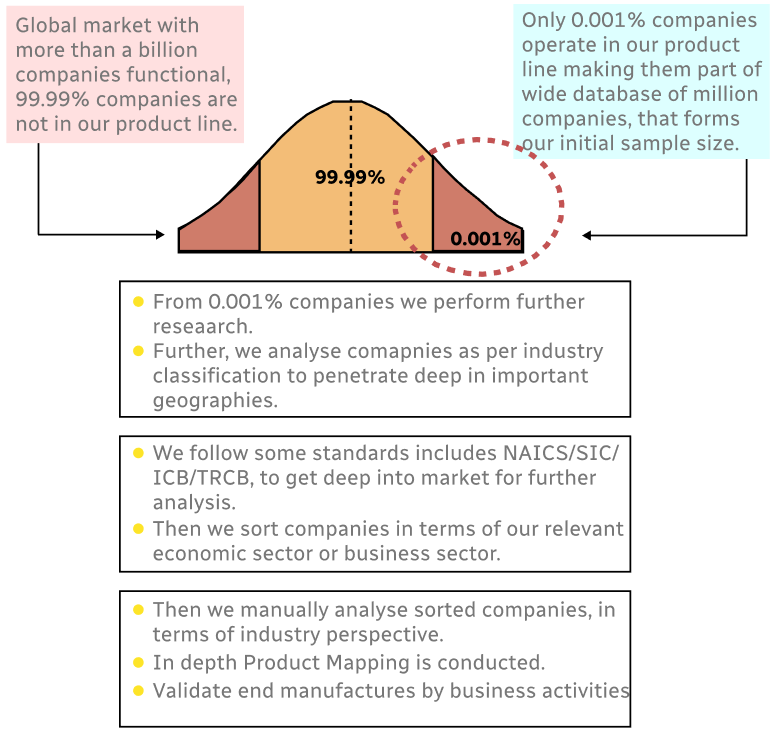
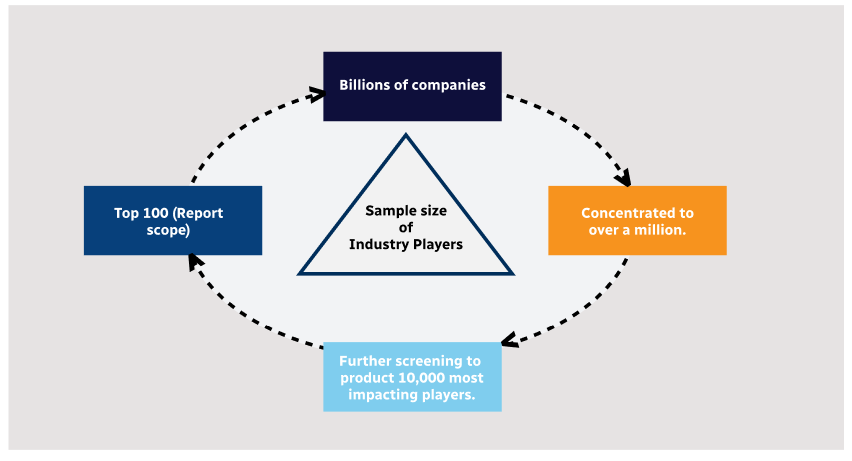
Step 1 - Identification of Relevant Samples Size from Population Database
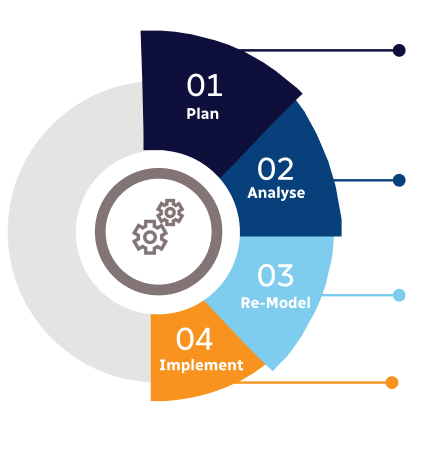
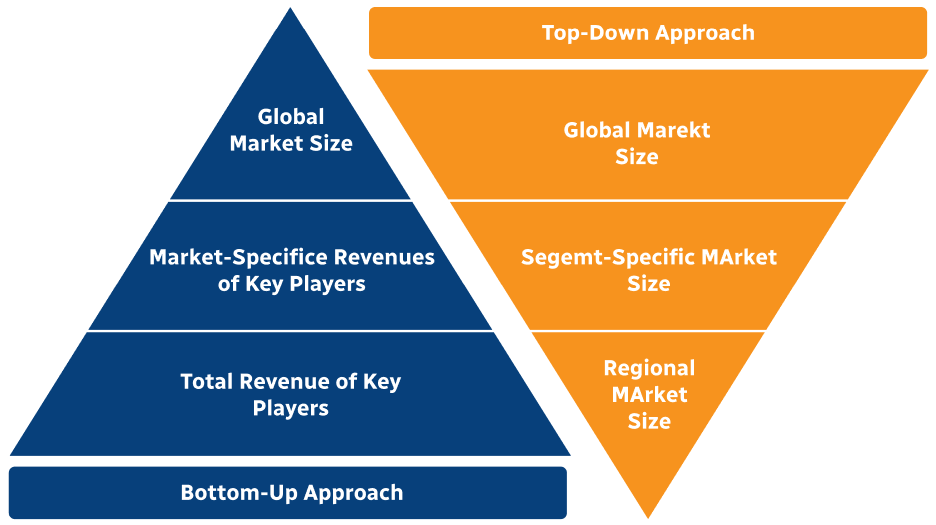
Step 2 - Approaches for Defining Global Market Size (Value, Volume* & Price*)
Note*: In applicable scenarios
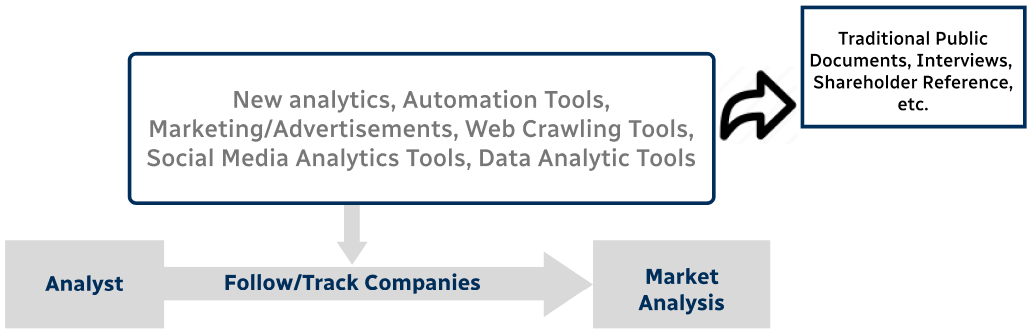
Step 3 - Data Sources
Primary Research
- Web Analytics
- Survey Reports
- Research Institute
- Latest Research Reports
- Opinion Leaders
Secondary Research
- Annual Reports
- White Paper
- Latest Press Release
- Industry Association
- Paid Database
- Investor Presentations
Step 4 - Data Triangulation
Involves using different sources of information in order to increase the validity of a study
These sources are likely to be stakeholders in a program - participants, other researchers, program staff, other community members, and so on.
Then we put all data in single framework & apply various statistical tools to find out the dynamic on the market.
During the analysis stage, feedback from the stakeholder groups would be compared to determine areas of agreement as well as areas of divergence