


Key Insights
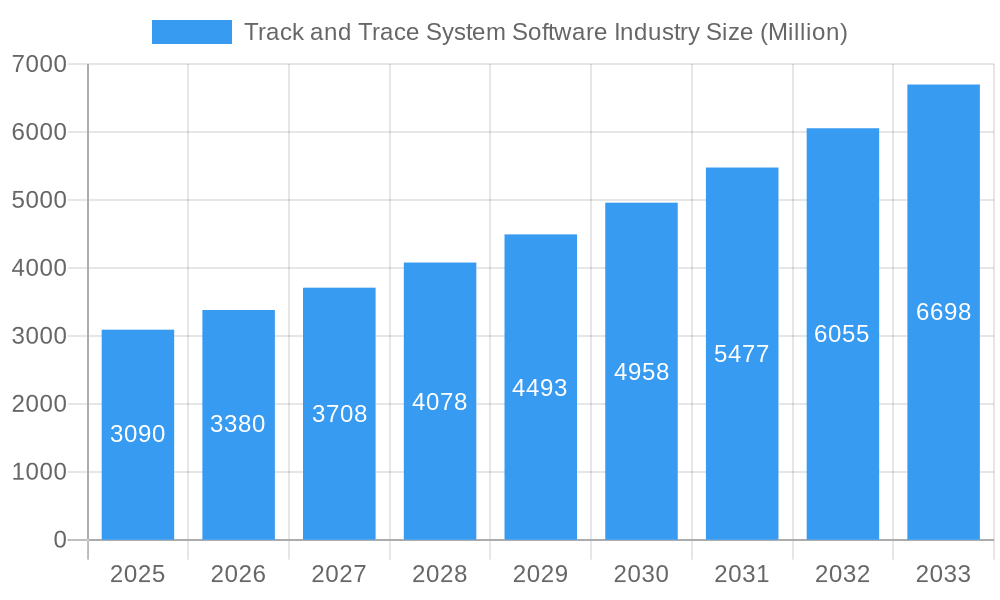
The Track and Trace System Software market, valued at $3.09 billion in 2025, is projected to experience robust growth, driven by increasing regulatory pressures demanding greater product traceability across various industries, particularly pharmaceuticals and medical devices. This necessitates sophisticated software solutions for serialization, aggregation, and data management, boosting demand for advanced Track and Trace systems. The market's expansion is fueled by the rising adoption of technologies like barcode and RFID, facilitating real-time monitoring and efficient supply chain management. Furthermore, the growing need for enhanced counterfeit prevention and improved patient safety are significant drivers. Serialization solutions, allowing unique identification of individual products, are experiencing particularly strong growth. The pharmaceutical industry remains the largest end-user segment, followed closely by medical device manufacturers. Geographic growth is expected across all regions, with North America and Europe maintaining significant market shares due to established regulatory frameworks and higher adoption rates. However, rapidly developing economies in Asia-Pacific are demonstrating significant growth potential, driven by increasing manufacturing and expanding healthcare infrastructure. While initial investment costs can be a restraint, the long-term benefits of improved efficiency, reduced risks, and enhanced brand reputation outweigh these concerns, furthering market expansion.

Track and Trace System Software Industry Market Size (In Billion)

The market's Compound Annual Growth Rate (CAGR) of 9.31% from 2019 to 2024 suggests a continued upward trajectory. This growth is expected to be sustained throughout the forecast period (2025-2033), although the CAGR might slightly fluctuate due to economic factors and technological advancements. Key players are strategically investing in research and development to enhance their software capabilities, incorporating AI and machine learning for predictive analytics and improved traceability. Competition is intense, with both established players and emerging companies vying for market share through innovation and strategic partnerships. The consolidation of smaller companies through acquisitions is also anticipated, contributing to further market concentration. The continuous evolution of regulatory landscapes and the increasing demand for integrated solutions present both opportunities and challenges for industry participants.
Track and Trace System Software Industry Company Market Share
Track and Trace System Software Industry Report: 2019-2033
This comprehensive report provides a detailed analysis of the Track and Trace System Software industry, offering invaluable insights for industry professionals, investors, and strategic decision-makers. The study period covers 2019-2033, with a base year of 2025 and a forecast period of 2025-2033. The report projects a market valued at $XX Million by 2033, revealing significant growth opportunities.
Track and Trace System Software Industry Market Structure & Innovation Trends
This section analyzes the competitive landscape, innovation drivers, and regulatory influences shaping the Track and Trace System Software market. The industry exhibits a moderately concentrated structure, with key players like Mettler-Toledo International Inc, SEIDENADER MASCHINENBAU GMBH (MEDIPAK SYSTEMS), and TraceLink Inc holding significant market share. However, the market also features numerous smaller players and emerging innovators.
- Market Concentration: The top 5 companies account for approximately XX% of the global market share in 2025.
- Innovation Drivers: Stringent regulatory requirements for drug serialization and aggregation are primary drivers. Advancements in barcode, RFID, and data matrix technologies fuel innovation.
- Regulatory Frameworks: Government regulations mandating track and trace capabilities in various industries (pharmaceuticals, medical devices) are crucial market drivers. Variations in regulations across geographies create both opportunities and challenges.
- Product Substitutes: While limited direct substitutes exist, alternative inventory management systems and manual tracking processes represent indirect competition.
- M&A Activities: Significant M&A activity has been observed, such as the acquisition of Adents by Antares Vision in 2021, highlighting consolidation trends and efforts to expand product portfolios and geographical reach. These acquisitions often involved values in the range of $XX Million to $XX Million.
- End-User Demographics: The pharmaceutical and medical device industries are primary end users, with growing adoption in other sectors like food and beverage.
Track and Trace System Software Industry Market Dynamics & Trends
The Track and Trace System Software market is experiencing robust growth, driven by several key factors. The increasing demand for enhanced supply chain visibility and security, coupled with stricter regulatory compliance, is propelling market expansion. Technological advancements, such as the integration of AI and machine learning capabilities into track and trace solutions, are further enhancing efficiency and accuracy. The market is expected to experience a Compound Annual Growth Rate (CAGR) of XX% during the forecast period (2025-2033). Market penetration is also increasing rapidly, with a projected XX% of pharmaceutical companies implementing advanced track and trace systems by 2033. Competitive dynamics are characterized by both intense rivalry among established players and the emergence of innovative startups offering niche solutions.
Dominant Regions & Segments in Track and Trace System Software Industry
North America and Europe currently dominate the Track and Trace System Software market, driven by robust regulatory frameworks and high adoption rates within the pharmaceutical and medical device sectors. However, Asia-Pacific is experiencing rapid growth due to increasing pharmaceutical manufacturing and rising government investments in supply chain infrastructure.
- Leading Region: North America
- Key Drivers for North America: Stringent regulatory compliance, high pharmaceutical industry concentration, and well-established IT infrastructure.
- Key Drivers for Europe: Similar to North America, stringent regulatory compliance and a well-developed healthcare industry.
- Key Drivers for Asia-Pacific: Rapidly growing pharmaceutical manufacturing base, increasing government investment in healthcare infrastructure, and cost advantages.
Leading Segments:
- Technology: Barcode and RFID technologies hold significant market share, with data matrix serialization gaining traction.
- Application: Serialization solutions are the most prevalent, followed by aggregation and other advanced track and trace applications.
- End User: Pharmaceutical companies are the largest segment, closely followed by medical device companies.
Track and Trace System Software Industry Product Innovations
Recent innovations focus on enhancing integration capabilities, improving data analytics, and adding features like AI-powered predictive maintenance. This allows for more efficient and proactive supply chain management. The market is seeing a shift towards cloud-based solutions, offering greater scalability and accessibility. The focus is on improving data security and compliance with increasingly stringent regulations.
Report Scope & Segmentation Analysis
This report segments the market by technology (barcode, RFID), application (serialization, aggregation), and end-user (pharmaceutical, medical device, others). Each segment is analyzed based on historical data (2019-2024), current estimates (2025), and future projections (2025-2033), providing a comprehensive understanding of market size, growth rates, and competitive dynamics within each segment.
Key Drivers of Track and Trace System Software Industry Growth
Key growth drivers include increasing regulatory pressure demanding better supply chain visibility, the growing adoption of advanced technologies (e.g., AI, IoT), and the rising demand for counterfeit drug prevention measures. Furthermore, the need for efficient supply chain management across diverse industries beyond pharmaceuticals is also a significant contributing factor.
Challenges in the Track and Trace System Software Industry Sector
The industry faces challenges such as high initial investment costs for implementing track and trace systems, data security and privacy concerns, and the complexity of integrating various systems across the entire supply chain. These factors can deter smaller companies from adopting such technologies.
Emerging Opportunities in Track and Trace System Software Industry
The industry presents numerous opportunities, including expanding into new sectors, developing integrated solutions combining multiple technologies, and improving data analytics for better decision-making. The increasing use of blockchain technology for enhanced security and transparency represents a significant emerging opportunity.
Leading Players in the Track and Trace System Software Industry Market
- Mettler-Toledo International Inc
- SEIDENADER MASCHINENBAU GMBH (MEDIPAK SYSTEMS)
- Axway
- Sea Vision SRL
- Zetes
- Adents
- TraceLink Inc
- Syntegon Technology GmbH
- ACG
- Optel Group
- ANTARES VISION SpA
- Kezzler AS
- Rfxcel Corporation
- Korber Medipak Systems GmbH
Key Developments in Track and Trace System Software Industry
- February 2021: Antares Vision acquired Adents High Tech International, expanding its software portfolio and international presence.
- January 2021: OPTEL and Bureau Veritas partnered to launch V-TRACE, a traceability solution for COVID-19 vaccine supply chains.
- December 2020: Domino, Gallarus, and SeaVision developed the K600G digital printing solution for pharmaceutical blister packs.
Future Outlook for Track and Trace System Software Industry Market
The Track and Trace System Software market is poised for significant growth, driven by ongoing technological advancements, increasing regulatory scrutiny, and the expanding need for enhanced supply chain security and visibility across multiple industries. The market is predicted to witness continued consolidation and strategic partnerships among existing players as well as the emergence of new innovative solutions. The development of more integrated and intelligent systems will be key for future success.
Track and Trace System Software Industry Segmentation
-
1. Product
-
1.1. Hardware Systems
- 1.1.1. Printing and Marking Solutions
- 1.1.2. Monitoring and Verification Solutions
- 1.1.3. Labeling Solutions
- 1.1.4. Other Hardware Systems
-
1.2. Software Solutions
- 1.2.1. Plant Manager Software
- 1.2.2. Line Controller Software
- 1.2.3. Bundle Tracking Software
- 1.2.4. Other Software Solutions
-
1.1. Hardware Systems
-
2. Technology
- 2.1. Barcode
- 2.2. RFID
-
3. Application
-
3.1. Serialization Solutions
- 3.1.1. Bottle Serialization
- 3.1.2. Label Serialization
- 3.1.3. Carton Serialization
- 3.1.4. Data Matrix Serialization
-
3.2. Aggregation Solutions
- 3.2.1. Bundle Aggregation
- 3.2.2. Case Aggregation
- 3.2.3. Pallet Aggregation
-
3.1. Serialization Solutions
-
4. End User
- 4.1. Pharmaceutical Companies
- 4.2. Medical Device Companies
- 4.3. Other End Users
Track and Trace System Software Industry Segmentation By Geography
-
1. North America
- 1.1. United States
- 1.2. Canada
- 1.3. Mexico
-
2. Europe
- 2.1. Germany
- 2.2. United Kingdom
- 2.3. France
- 2.4. Italy
- 2.5. Spain
- 2.6. Rest of Europe
-
3. Asia Pacific
- 3.1. China
- 3.2. Japan
- 3.3. India
- 3.4. Australia
- 3.5. South Korea
- 3.6. Rest of Asia Pacific
-
4. Middle East and Africa
- 4.1. GCC
- 4.2. South Africa
- 4.3. Rest of Middle East and Africa
-
5. South America
- 5.1. Brazil
- 5.2. Argentina
- 5.3. Rest of South America

Track and Trace System Software Industry Regional Market Share
Geographic Coverage of Track and Trace System Software Industry
Track and Trace System Software Industry REPORT HIGHLIGHTS
| Aspects | Details |
|---|---|
| Study Period | 2020-2034 |
| Base Year | 2025 |
| Estimated Year | 2026 |
| Forecast Period | 2026-2034 |
| Historical Period | 2020-2025 |
| Growth Rate | CAGR of 9.31% from 2020-2034 |
| Segmentation |
|
Table of Contents
- 1. Introduction
- 1.1. Research Scope
- 1.2. Market Segmentation
- 1.3. Research Methodology
- 1.4. Definitions and Assumptions
- 2. Executive Summary
- 2.1. Introduction
- 3. Market Dynamics
- 3.1. Introduction
- 3.2. Market Drivers
- 3.2.1. Growth in the Medical Devices and Pharmaceutical Industries and Increase in Implementation of Serialization; Rise in the Number of Packaging-related Product Recalls; Increasing Number of Counterfeit Drugs
- 3.3. Market Restrains
- 3.3.1. High Costs Associated with Serialization and Aggregation; Lack of Common Standards for Serialization and Aggregation
- 3.4. Market Trends
- 3.4.1. RFID Technology is Expected to Observe a Good Growth in the Track and Trace Solutions Market
- 4. Market Factor Analysis
- 4.1. Porters Five Forces
- 4.2. Supply/Value Chain
- 4.3. PESTEL analysis
- 4.4. Market Entropy
- 4.5. Patent/Trademark Analysis
- 5. Global Track and Trace System Software Industry Analysis, Insights and Forecast, 2020-2032
- 5.1. Market Analysis, Insights and Forecast - by Product
- 5.1.1. Hardware Systems
- 5.1.1.1. Printing and Marking Solutions
- 5.1.1.2. Monitoring and Verification Solutions
- 5.1.1.3. Labeling Solutions
- 5.1.1.4. Other Hardware Systems
- 5.1.2. Software Solutions
- 5.1.2.1. Plant Manager Software
- 5.1.2.2. Line Controller Software
- 5.1.2.3. Bundle Tracking Software
- 5.1.2.4. Other Software Solutions
- 5.1.1. Hardware Systems
- 5.2. Market Analysis, Insights and Forecast - by Technology
- 5.2.1. Barcode
- 5.2.2. RFID
- 5.3. Market Analysis, Insights and Forecast - by Application
- 5.3.1. Serialization Solutions
- 5.3.1.1. Bottle Serialization
- 5.3.1.2. Label Serialization
- 5.3.1.3. Carton Serialization
- 5.3.1.4. Data Matrix Serialization
- 5.3.2. Aggregation Solutions
- 5.3.2.1. Bundle Aggregation
- 5.3.2.2. Case Aggregation
- 5.3.2.3. Pallet Aggregation
- 5.3.1. Serialization Solutions
- 5.4. Market Analysis, Insights and Forecast - by End User
- 5.4.1. Pharmaceutical Companies
- 5.4.2. Medical Device Companies
- 5.4.3. Other End Users
- 5.5. Market Analysis, Insights and Forecast - by Region
- 5.5.1. North America
- 5.5.2. Europe
- 5.5.3. Asia Pacific
- 5.5.4. Middle East and Africa
- 5.5.5. South America
- 5.1. Market Analysis, Insights and Forecast - by Product
- 6. North America Track and Trace System Software Industry Analysis, Insights and Forecast, 2020-2032
- 6.1. Market Analysis, Insights and Forecast - by Product
- 6.1.1. Hardware Systems
- 6.1.1.1. Printing and Marking Solutions
- 6.1.1.2. Monitoring and Verification Solutions
- 6.1.1.3. Labeling Solutions
- 6.1.1.4. Other Hardware Systems
- 6.1.2. Software Solutions
- 6.1.2.1. Plant Manager Software
- 6.1.2.2. Line Controller Software
- 6.1.2.3. Bundle Tracking Software
- 6.1.2.4. Other Software Solutions
- 6.1.1. Hardware Systems
- 6.2. Market Analysis, Insights and Forecast - by Technology
- 6.2.1. Barcode
- 6.2.2. RFID
- 6.3. Market Analysis, Insights and Forecast - by Application
- 6.3.1. Serialization Solutions
- 6.3.1.1. Bottle Serialization
- 6.3.1.2. Label Serialization
- 6.3.1.3. Carton Serialization
- 6.3.1.4. Data Matrix Serialization
- 6.3.2. Aggregation Solutions
- 6.3.2.1. Bundle Aggregation
- 6.3.2.2. Case Aggregation
- 6.3.2.3. Pallet Aggregation
- 6.3.1. Serialization Solutions
- 6.4. Market Analysis, Insights and Forecast - by End User
- 6.4.1. Pharmaceutical Companies
- 6.4.2. Medical Device Companies
- 6.4.3. Other End Users
- 6.1. Market Analysis, Insights and Forecast - by Product
- 7. Europe Track and Trace System Software Industry Analysis, Insights and Forecast, 2020-2032
- 7.1. Market Analysis, Insights and Forecast - by Product
- 7.1.1. Hardware Systems
- 7.1.1.1. Printing and Marking Solutions
- 7.1.1.2. Monitoring and Verification Solutions
- 7.1.1.3. Labeling Solutions
- 7.1.1.4. Other Hardware Systems
- 7.1.2. Software Solutions
- 7.1.2.1. Plant Manager Software
- 7.1.2.2. Line Controller Software
- 7.1.2.3. Bundle Tracking Software
- 7.1.2.4. Other Software Solutions
- 7.1.1. Hardware Systems
- 7.2. Market Analysis, Insights and Forecast - by Technology
- 7.2.1. Barcode
- 7.2.2. RFID
- 7.3. Market Analysis, Insights and Forecast - by Application
- 7.3.1. Serialization Solutions
- 7.3.1.1. Bottle Serialization
- 7.3.1.2. Label Serialization
- 7.3.1.3. Carton Serialization
- 7.3.1.4. Data Matrix Serialization
- 7.3.2. Aggregation Solutions
- 7.3.2.1. Bundle Aggregation
- 7.3.2.2. Case Aggregation
- 7.3.2.3. Pallet Aggregation
- 7.3.1. Serialization Solutions
- 7.4. Market Analysis, Insights and Forecast - by End User
- 7.4.1. Pharmaceutical Companies
- 7.4.2. Medical Device Companies
- 7.4.3. Other End Users
- 7.1. Market Analysis, Insights and Forecast - by Product
- 8. Asia Pacific Track and Trace System Software Industry Analysis, Insights and Forecast, 2020-2032
- 8.1. Market Analysis, Insights and Forecast - by Product
- 8.1.1. Hardware Systems
- 8.1.1.1. Printing and Marking Solutions
- 8.1.1.2. Monitoring and Verification Solutions
- 8.1.1.3. Labeling Solutions
- 8.1.1.4. Other Hardware Systems
- 8.1.2. Software Solutions
- 8.1.2.1. Plant Manager Software
- 8.1.2.2. Line Controller Software
- 8.1.2.3. Bundle Tracking Software
- 8.1.2.4. Other Software Solutions
- 8.1.1. Hardware Systems
- 8.2. Market Analysis, Insights and Forecast - by Technology
- 8.2.1. Barcode
- 8.2.2. RFID
- 8.3. Market Analysis, Insights and Forecast - by Application
- 8.3.1. Serialization Solutions
- 8.3.1.1. Bottle Serialization
- 8.3.1.2. Label Serialization
- 8.3.1.3. Carton Serialization
- 8.3.1.4. Data Matrix Serialization
- 8.3.2. Aggregation Solutions
- 8.3.2.1. Bundle Aggregation
- 8.3.2.2. Case Aggregation
- 8.3.2.3. Pallet Aggregation
- 8.3.1. Serialization Solutions
- 8.4. Market Analysis, Insights and Forecast - by End User
- 8.4.1. Pharmaceutical Companies
- 8.4.2. Medical Device Companies
- 8.4.3. Other End Users
- 8.1. Market Analysis, Insights and Forecast - by Product
- 9. Middle East and Africa Track and Trace System Software Industry Analysis, Insights and Forecast, 2020-2032
- 9.1. Market Analysis, Insights and Forecast - by Product
- 9.1.1. Hardware Systems
- 9.1.1.1. Printing and Marking Solutions
- 9.1.1.2. Monitoring and Verification Solutions
- 9.1.1.3. Labeling Solutions
- 9.1.1.4. Other Hardware Systems
- 9.1.2. Software Solutions
- 9.1.2.1. Plant Manager Software
- 9.1.2.2. Line Controller Software
- 9.1.2.3. Bundle Tracking Software
- 9.1.2.4. Other Software Solutions
- 9.1.1. Hardware Systems
- 9.2. Market Analysis, Insights and Forecast - by Technology
- 9.2.1. Barcode
- 9.2.2. RFID
- 9.3. Market Analysis, Insights and Forecast - by Application
- 9.3.1. Serialization Solutions
- 9.3.1.1. Bottle Serialization
- 9.3.1.2. Label Serialization
- 9.3.1.3. Carton Serialization
- 9.3.1.4. Data Matrix Serialization
- 9.3.2. Aggregation Solutions
- 9.3.2.1. Bundle Aggregation
- 9.3.2.2. Case Aggregation
- 9.3.2.3. Pallet Aggregation
- 9.3.1. Serialization Solutions
- 9.4. Market Analysis, Insights and Forecast - by End User
- 9.4.1. Pharmaceutical Companies
- 9.4.2. Medical Device Companies
- 9.4.3. Other End Users
- 9.1. Market Analysis, Insights and Forecast - by Product
- 10. South America Track and Trace System Software Industry Analysis, Insights and Forecast, 2020-2032
- 10.1. Market Analysis, Insights and Forecast - by Product
- 10.1.1. Hardware Systems
- 10.1.1.1. Printing and Marking Solutions
- 10.1.1.2. Monitoring and Verification Solutions
- 10.1.1.3. Labeling Solutions
- 10.1.1.4. Other Hardware Systems
- 10.1.2. Software Solutions
- 10.1.2.1. Plant Manager Software
- 10.1.2.2. Line Controller Software
- 10.1.2.3. Bundle Tracking Software
- 10.1.2.4. Other Software Solutions
- 10.1.1. Hardware Systems
- 10.2. Market Analysis, Insights and Forecast - by Technology
- 10.2.1. Barcode
- 10.2.2. RFID
- 10.3. Market Analysis, Insights and Forecast - by Application
- 10.3.1. Serialization Solutions
- 10.3.1.1. Bottle Serialization
- 10.3.1.2. Label Serialization
- 10.3.1.3. Carton Serialization
- 10.3.1.4. Data Matrix Serialization
- 10.3.2. Aggregation Solutions
- 10.3.2.1. Bundle Aggregation
- 10.3.2.2. Case Aggregation
- 10.3.2.3. Pallet Aggregation
- 10.3.1. Serialization Solutions
- 10.4. Market Analysis, Insights and Forecast - by End User
- 10.4.1. Pharmaceutical Companies
- 10.4.2. Medical Device Companies
- 10.4.3. Other End Users
- 10.1. Market Analysis, Insights and Forecast - by Product
- 11. Competitive Analysis
- 11.1. Global Market Share Analysis 2025
- 11.2. Company Profiles
- 11.2.1 Mettler-Toledo International Inc
- 11.2.1.1. Overview
- 11.2.1.2. Products
- 11.2.1.3. SWOT Analysis
- 11.2.1.4. Recent Developments
- 11.2.1.5. Financials (Based on Availability)
- 11.2.2 SEIDENADER MASCHINENBAU GMBH (MEDIPAK SYSTEMS)
- 11.2.2.1. Overview
- 11.2.2.2. Products
- 11.2.2.3. SWOT Analysis
- 11.2.2.4. Recent Developments
- 11.2.2.5. Financials (Based on Availability)
- 11.2.3 Axway
- 11.2.3.1. Overview
- 11.2.3.2. Products
- 11.2.3.3. SWOT Analysis
- 11.2.3.4. Recent Developments
- 11.2.3.5. Financials (Based on Availability)
- 11.2.4 Sea Vision SRL
- 11.2.4.1. Overview
- 11.2.4.2. Products
- 11.2.4.3. SWOT Analysis
- 11.2.4.4. Recent Developments
- 11.2.4.5. Financials (Based on Availability)
- 11.2.5 Zetes
- 11.2.5.1. Overview
- 11.2.5.2. Products
- 11.2.5.3. SWOT Analysis
- 11.2.5.4. Recent Developments
- 11.2.5.5. Financials (Based on Availability)
- 11.2.6 Adents
- 11.2.6.1. Overview
- 11.2.6.2. Products
- 11.2.6.3. SWOT Analysis
- 11.2.6.4. Recent Developments
- 11.2.6.5. Financials (Based on Availability)
- 11.2.7 TraceLink Inc
- 11.2.7.1. Overview
- 11.2.7.2. Products
- 11.2.7.3. SWOT Analysis
- 11.2.7.4. Recent Developments
- 11.2.7.5. Financials (Based on Availability)
- 11.2.8 Syntegon Technology GmbH
- 11.2.8.1. Overview
- 11.2.8.2. Products
- 11.2.8.3. SWOT Analysis
- 11.2.8.4. Recent Developments
- 11.2.8.5. Financials (Based on Availability)
- 11.2.9 ACG
- 11.2.9.1. Overview
- 11.2.9.2. Products
- 11.2.9.3. SWOT Analysis
- 11.2.9.4. Recent Developments
- 11.2.9.5. Financials (Based on Availability)
- 11.2.10 Optel Group
- 11.2.10.1. Overview
- 11.2.10.2. Products
- 11.2.10.3. SWOT Analysis
- 11.2.10.4. Recent Developments
- 11.2.10.5. Financials (Based on Availability)
- 11.2.11 ANTARES VISION SpA
- 11.2.11.1. Overview
- 11.2.11.2. Products
- 11.2.11.3. SWOT Analysis
- 11.2.11.4. Recent Developments
- 11.2.11.5. Financials (Based on Availability)
- 11.2.12 Kezzler AS
- 11.2.12.1. Overview
- 11.2.12.2. Products
- 11.2.12.3. SWOT Analysis
- 11.2.12.4. Recent Developments
- 11.2.12.5. Financials (Based on Availability)
- 11.2.13 Rfxcel Corporation
- 11.2.13.1. Overview
- 11.2.13.2. Products
- 11.2.13.3. SWOT Analysis
- 11.2.13.4. Recent Developments
- 11.2.13.5. Financials (Based on Availability)
- 11.2.14 Korber Medipak Systems GmbH*List Not Exhaustive
- 11.2.14.1. Overview
- 11.2.14.2. Products
- 11.2.14.3. SWOT Analysis
- 11.2.14.4. Recent Developments
- 11.2.14.5. Financials (Based on Availability)
- 11.2.1 Mettler-Toledo International Inc
List of Figures
- Figure 1: Global Track and Trace System Software Industry Revenue Breakdown (Million, %) by Region 2025 & 2033
- Figure 2: North America Track and Trace System Software Industry Revenue (Million), by Product 2025 & 2033
- Figure 3: North America Track and Trace System Software Industry Revenue Share (%), by Product 2025 & 2033
- Figure 4: North America Track and Trace System Software Industry Revenue (Million), by Technology 2025 & 2033
- Figure 5: North America Track and Trace System Software Industry Revenue Share (%), by Technology 2025 & 2033
- Figure 6: North America Track and Trace System Software Industry Revenue (Million), by Application 2025 & 2033
- Figure 7: North America Track and Trace System Software Industry Revenue Share (%), by Application 2025 & 2033
- Figure 8: North America Track and Trace System Software Industry Revenue (Million), by End User 2025 & 2033
- Figure 9: North America Track and Trace System Software Industry Revenue Share (%), by End User 2025 & 2033
- Figure 10: North America Track and Trace System Software Industry Revenue (Million), by Country 2025 & 2033
- Figure 11: North America Track and Trace System Software Industry Revenue Share (%), by Country 2025 & 2033
- Figure 12: Europe Track and Trace System Software Industry Revenue (Million), by Product 2025 & 2033
- Figure 13: Europe Track and Trace System Software Industry Revenue Share (%), by Product 2025 & 2033
- Figure 14: Europe Track and Trace System Software Industry Revenue (Million), by Technology 2025 & 2033
- Figure 15: Europe Track and Trace System Software Industry Revenue Share (%), by Technology 2025 & 2033
- Figure 16: Europe Track and Trace System Software Industry Revenue (Million), by Application 2025 & 2033
- Figure 17: Europe Track and Trace System Software Industry Revenue Share (%), by Application 2025 & 2033
- Figure 18: Europe Track and Trace System Software Industry Revenue (Million), by End User 2025 & 2033
- Figure 19: Europe Track and Trace System Software Industry Revenue Share (%), by End User 2025 & 2033
- Figure 20: Europe Track and Trace System Software Industry Revenue (Million), by Country 2025 & 2033
- Figure 21: Europe Track and Trace System Software Industry Revenue Share (%), by Country 2025 & 2033
- Figure 22: Asia Pacific Track and Trace System Software Industry Revenue (Million), by Product 2025 & 2033
- Figure 23: Asia Pacific Track and Trace System Software Industry Revenue Share (%), by Product 2025 & 2033
- Figure 24: Asia Pacific Track and Trace System Software Industry Revenue (Million), by Technology 2025 & 2033
- Figure 25: Asia Pacific Track and Trace System Software Industry Revenue Share (%), by Technology 2025 & 2033
- Figure 26: Asia Pacific Track and Trace System Software Industry Revenue (Million), by Application 2025 & 2033
- Figure 27: Asia Pacific Track and Trace System Software Industry Revenue Share (%), by Application 2025 & 2033
- Figure 28: Asia Pacific Track and Trace System Software Industry Revenue (Million), by End User 2025 & 2033
- Figure 29: Asia Pacific Track and Trace System Software Industry Revenue Share (%), by End User 2025 & 2033
- Figure 30: Asia Pacific Track and Trace System Software Industry Revenue (Million), by Country 2025 & 2033
- Figure 31: Asia Pacific Track and Trace System Software Industry Revenue Share (%), by Country 2025 & 2033
- Figure 32: Middle East and Africa Track and Trace System Software Industry Revenue (Million), by Product 2025 & 2033
- Figure 33: Middle East and Africa Track and Trace System Software Industry Revenue Share (%), by Product 2025 & 2033
- Figure 34: Middle East and Africa Track and Trace System Software Industry Revenue (Million), by Technology 2025 & 2033
- Figure 35: Middle East and Africa Track and Trace System Software Industry Revenue Share (%), by Technology 2025 & 2033
- Figure 36: Middle East and Africa Track and Trace System Software Industry Revenue (Million), by Application 2025 & 2033
- Figure 37: Middle East and Africa Track and Trace System Software Industry Revenue Share (%), by Application 2025 & 2033
- Figure 38: Middle East and Africa Track and Trace System Software Industry Revenue (Million), by End User 2025 & 2033
- Figure 39: Middle East and Africa Track and Trace System Software Industry Revenue Share (%), by End User 2025 & 2033
- Figure 40: Middle East and Africa Track and Trace System Software Industry Revenue (Million), by Country 2025 & 2033
- Figure 41: Middle East and Africa Track and Trace System Software Industry Revenue Share (%), by Country 2025 & 2033
- Figure 42: South America Track and Trace System Software Industry Revenue (Million), by Product 2025 & 2033
- Figure 43: South America Track and Trace System Software Industry Revenue Share (%), by Product 2025 & 2033
- Figure 44: South America Track and Trace System Software Industry Revenue (Million), by Technology 2025 & 2033
- Figure 45: South America Track and Trace System Software Industry Revenue Share (%), by Technology 2025 & 2033
- Figure 46: South America Track and Trace System Software Industry Revenue (Million), by Application 2025 & 2033
- Figure 47: South America Track and Trace System Software Industry Revenue Share (%), by Application 2025 & 2033
- Figure 48: South America Track and Trace System Software Industry Revenue (Million), by End User 2025 & 2033
- Figure 49: South America Track and Trace System Software Industry Revenue Share (%), by End User 2025 & 2033
- Figure 50: South America Track and Trace System Software Industry Revenue (Million), by Country 2025 & 2033
- Figure 51: South America Track and Trace System Software Industry Revenue Share (%), by Country 2025 & 2033
List of Tables
- Table 1: Global Track and Trace System Software Industry Revenue Million Forecast, by Product 2020 & 2033
- Table 2: Global Track and Trace System Software Industry Revenue Million Forecast, by Technology 2020 & 2033
- Table 3: Global Track and Trace System Software Industry Revenue Million Forecast, by Application 2020 & 2033
- Table 4: Global Track and Trace System Software Industry Revenue Million Forecast, by End User 2020 & 2033
- Table 5: Global Track and Trace System Software Industry Revenue Million Forecast, by Region 2020 & 2033
- Table 6: Global Track and Trace System Software Industry Revenue Million Forecast, by Product 2020 & 2033
- Table 7: Global Track and Trace System Software Industry Revenue Million Forecast, by Technology 2020 & 2033
- Table 8: Global Track and Trace System Software Industry Revenue Million Forecast, by Application 2020 & 2033
- Table 9: Global Track and Trace System Software Industry Revenue Million Forecast, by End User 2020 & 2033
- Table 10: Global Track and Trace System Software Industry Revenue Million Forecast, by Country 2020 & 2033
- Table 11: United States Track and Trace System Software Industry Revenue (Million) Forecast, by Application 2020 & 2033
- Table 12: Canada Track and Trace System Software Industry Revenue (Million) Forecast, by Application 2020 & 2033
- Table 13: Mexico Track and Trace System Software Industry Revenue (Million) Forecast, by Application 2020 & 2033
- Table 14: Global Track and Trace System Software Industry Revenue Million Forecast, by Product 2020 & 2033
- Table 15: Global Track and Trace System Software Industry Revenue Million Forecast, by Technology 2020 & 2033
- Table 16: Global Track and Trace System Software Industry Revenue Million Forecast, by Application 2020 & 2033
- Table 17: Global Track and Trace System Software Industry Revenue Million Forecast, by End User 2020 & 2033
- Table 18: Global Track and Trace System Software Industry Revenue Million Forecast, by Country 2020 & 2033
- Table 19: Germany Track and Trace System Software Industry Revenue (Million) Forecast, by Application 2020 & 2033
- Table 20: United Kingdom Track and Trace System Software Industry Revenue (Million) Forecast, by Application 2020 & 2033
- Table 21: France Track and Trace System Software Industry Revenue (Million) Forecast, by Application 2020 & 2033
- Table 22: Italy Track and Trace System Software Industry Revenue (Million) Forecast, by Application 2020 & 2033
- Table 23: Spain Track and Trace System Software Industry Revenue (Million) Forecast, by Application 2020 & 2033
- Table 24: Rest of Europe Track and Trace System Software Industry Revenue (Million) Forecast, by Application 2020 & 2033
- Table 25: Global Track and Trace System Software Industry Revenue Million Forecast, by Product 2020 & 2033
- Table 26: Global Track and Trace System Software Industry Revenue Million Forecast, by Technology 2020 & 2033
- Table 27: Global Track and Trace System Software Industry Revenue Million Forecast, by Application 2020 & 2033
- Table 28: Global Track and Trace System Software Industry Revenue Million Forecast, by End User 2020 & 2033
- Table 29: Global Track and Trace System Software Industry Revenue Million Forecast, by Country 2020 & 2033
- Table 30: China Track and Trace System Software Industry Revenue (Million) Forecast, by Application 2020 & 2033
- Table 31: Japan Track and Trace System Software Industry Revenue (Million) Forecast, by Application 2020 & 2033
- Table 32: India Track and Trace System Software Industry Revenue (Million) Forecast, by Application 2020 & 2033
- Table 33: Australia Track and Trace System Software Industry Revenue (Million) Forecast, by Application 2020 & 2033
- Table 34: South Korea Track and Trace System Software Industry Revenue (Million) Forecast, by Application 2020 & 2033
- Table 35: Rest of Asia Pacific Track and Trace System Software Industry Revenue (Million) Forecast, by Application 2020 & 2033
- Table 36: Global Track and Trace System Software Industry Revenue Million Forecast, by Product 2020 & 2033
- Table 37: Global Track and Trace System Software Industry Revenue Million Forecast, by Technology 2020 & 2033
- Table 38: Global Track and Trace System Software Industry Revenue Million Forecast, by Application 2020 & 2033
- Table 39: Global Track and Trace System Software Industry Revenue Million Forecast, by End User 2020 & 2033
- Table 40: Global Track and Trace System Software Industry Revenue Million Forecast, by Country 2020 & 2033
- Table 41: GCC Track and Trace System Software Industry Revenue (Million) Forecast, by Application 2020 & 2033
- Table 42: South Africa Track and Trace System Software Industry Revenue (Million) Forecast, by Application 2020 & 2033
- Table 43: Rest of Middle East and Africa Track and Trace System Software Industry Revenue (Million) Forecast, by Application 2020 & 2033
- Table 44: Global Track and Trace System Software Industry Revenue Million Forecast, by Product 2020 & 2033
- Table 45: Global Track and Trace System Software Industry Revenue Million Forecast, by Technology 2020 & 2033
- Table 46: Global Track and Trace System Software Industry Revenue Million Forecast, by Application 2020 & 2033
- Table 47: Global Track and Trace System Software Industry Revenue Million Forecast, by End User 2020 & 2033
- Table 48: Global Track and Trace System Software Industry Revenue Million Forecast, by Country 2020 & 2033
- Table 49: Brazil Track and Trace System Software Industry Revenue (Million) Forecast, by Application 2020 & 2033
- Table 50: Argentina Track and Trace System Software Industry Revenue (Million) Forecast, by Application 2020 & 2033
- Table 51: Rest of South America Track and Trace System Software Industry Revenue (Million) Forecast, by Application 2020 & 2033
Frequently Asked Questions
1. What is the projected Compound Annual Growth Rate (CAGR) of the Track and Trace System Software Industry?
The projected CAGR is approximately 9.31%.
2. Which companies are prominent players in the Track and Trace System Software Industry?
Key companies in the market include Mettler-Toledo International Inc, SEIDENADER MASCHINENBAU GMBH (MEDIPAK SYSTEMS), Axway, Sea Vision SRL, Zetes, Adents, TraceLink Inc, Syntegon Technology GmbH, ACG, Optel Group, ANTARES VISION SpA, Kezzler AS, Rfxcel Corporation, Korber Medipak Systems GmbH*List Not Exhaustive.
3. What are the main segments of the Track and Trace System Software Industry?
The market segments include Product, Technology, Application, End User.
4. Can you provide details about the market size?
The market size is estimated to be USD 3.09 Million as of 2022.
5. What are some drivers contributing to market growth?
Growth in the Medical Devices and Pharmaceutical Industries and Increase in Implementation of Serialization; Rise in the Number of Packaging-related Product Recalls; Increasing Number of Counterfeit Drugs.
6. What are the notable trends driving market growth?
RFID Technology is Expected to Observe a Good Growth in the Track and Trace Solutions Market.
7. Are there any restraints impacting market growth?
High Costs Associated with Serialization and Aggregation; Lack of Common Standards for Serialization and Aggregation.
8. Can you provide examples of recent developments in the market?
In February 2021, Anatres Vision acquired Adents High Tech International. Through this acquisition, the company expanded its portfolio of software solutions capable of tracing and tracking the entire end-to-end supply chain. The acquisition also helped in the strengthening of Anatres Vision's international presence, especially in France.
9. What pricing options are available for accessing the report?
Pricing options include single-user, multi-user, and enterprise licenses priced at USD 4750, USD 5250, and USD 8750 respectively.
10. Is the market size provided in terms of value or volume?
The market size is provided in terms of value, measured in Million.
11. Are there any specific market keywords associated with the report?
Yes, the market keyword associated with the report is "Track and Trace System Software Industry," which aids in identifying and referencing the specific market segment covered.
12. How do I determine which pricing option suits my needs best?
The pricing options vary based on user requirements and access needs. Individual users may opt for single-user licenses, while businesses requiring broader access may choose multi-user or enterprise licenses for cost-effective access to the report.
13. Are there any additional resources or data provided in the Track and Trace System Software Industry report?
While the report offers comprehensive insights, it's advisable to review the specific contents or supplementary materials provided to ascertain if additional resources or data are available.
14. How can I stay updated on further developments or reports in the Track and Trace System Software Industry?
To stay informed about further developments, trends, and reports in the Track and Trace System Software Industry, consider subscribing to industry newsletters, following relevant companies and organizations, or regularly checking reputable industry news sources and publications.
Methodology
Step 1 - Identification of Relevant Samples Size from Population Database


Step 2 - Approaches for Defining Global Market Size (Value, Volume* & Price*)

Note*: In applicable scenarios
Step 3 - Data Sources
Primary Research
- Web Analytics
- Survey Reports
- Research Institute
- Latest Research Reports
- Opinion Leaders
Secondary Research
- Annual Reports
- White Paper
- Latest Press Release
- Industry Association
- Paid Database
- Investor Presentations

Step 4 - Data Triangulation
Involves using different sources of information in order to increase the validity of a study
These sources are likely to be stakeholders in a program - participants, other researchers, program staff, other community members, and so on.
Then we put all data in single framework & apply various statistical tools to find out the dynamic on the market.
During the analysis stage, feedback from the stakeholder groups would be compared to determine areas of agreement as well as areas of divergence