
Key Insights
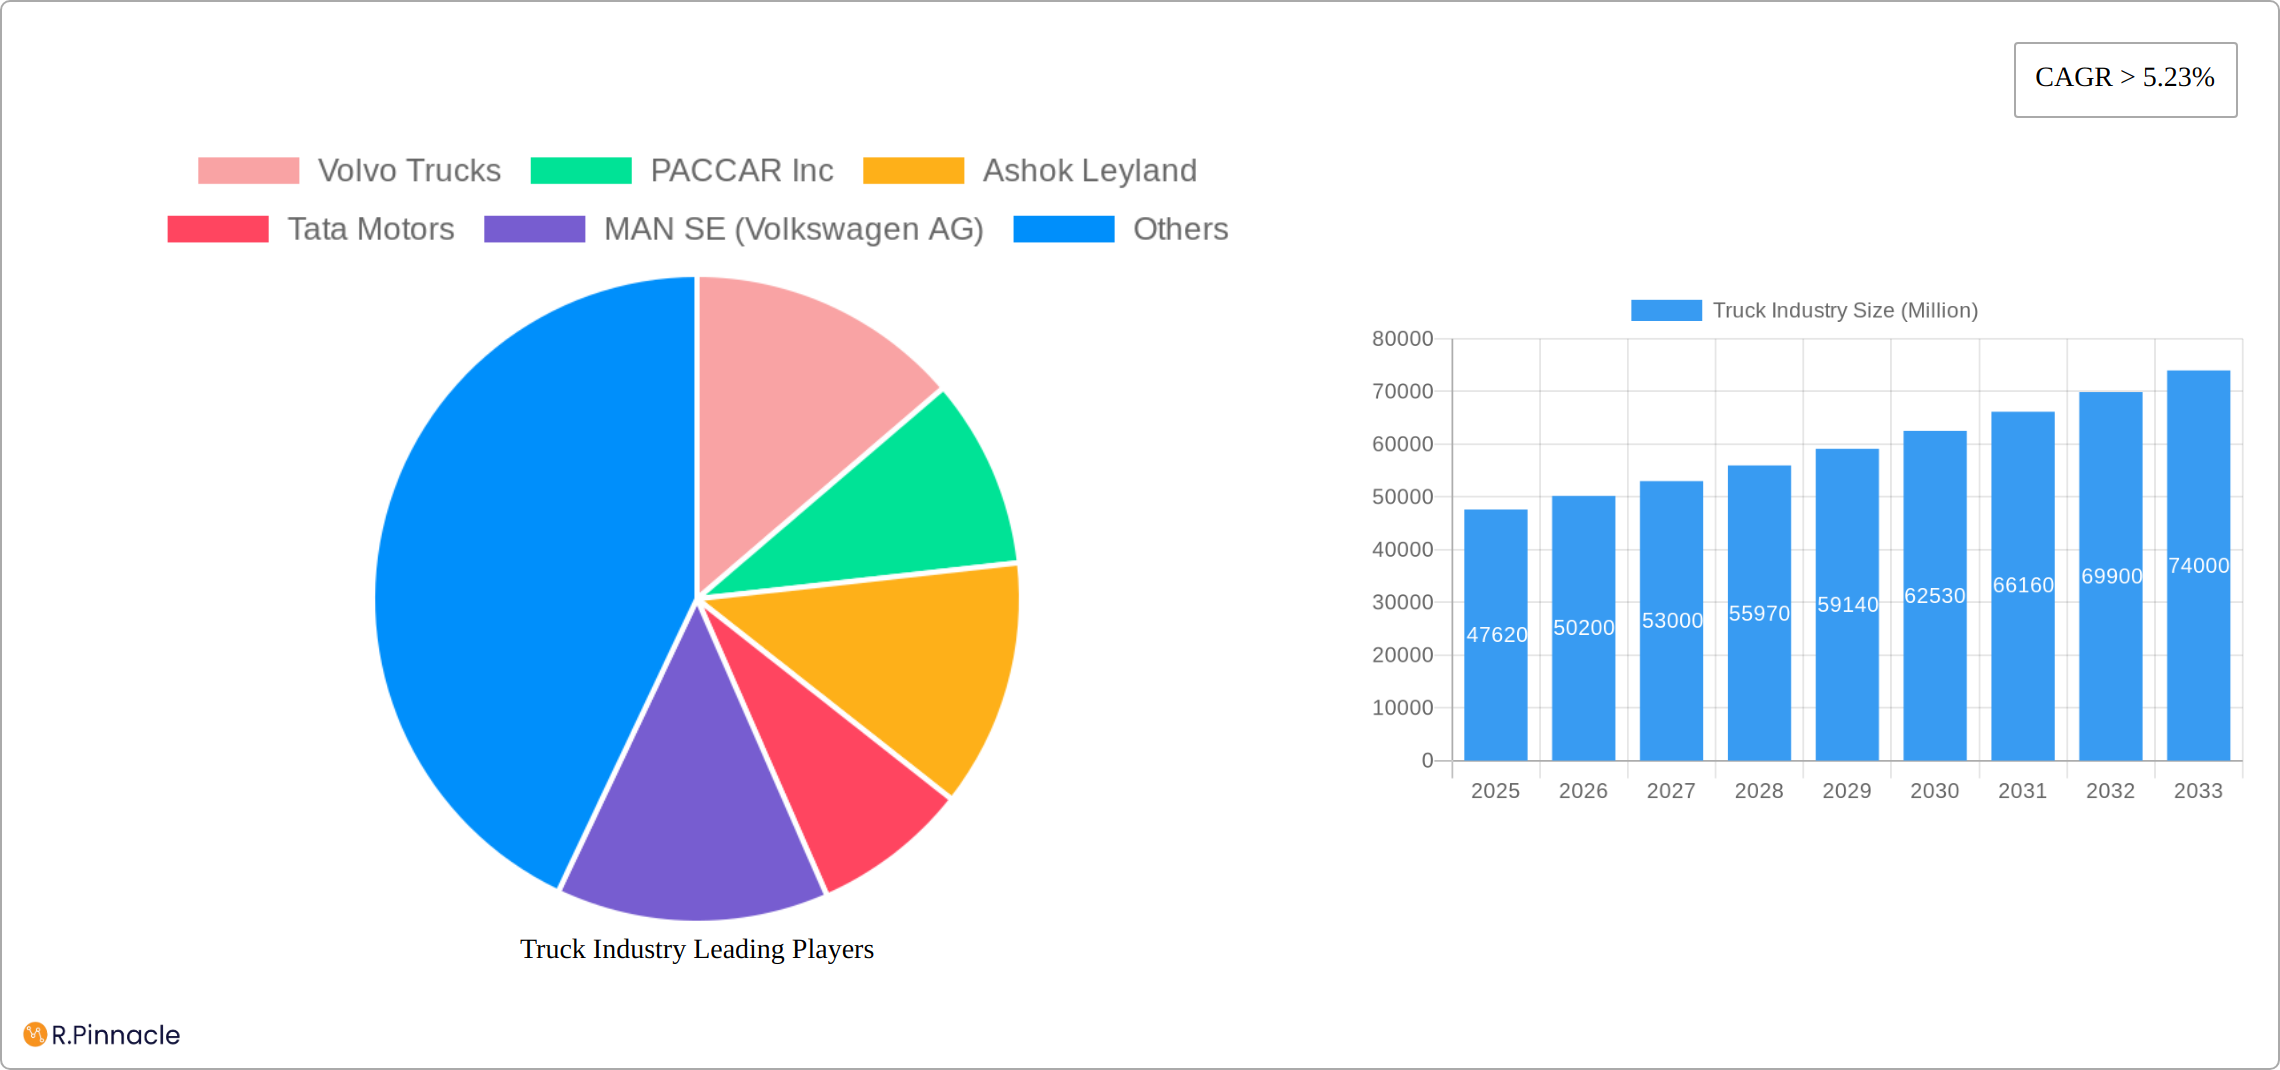
The global used truck market, valued at $47.62 billion in 2025, is projected to experience robust growth, exceeding a 5.23% CAGR from 2025 to 2033. This expansion is fueled by several key factors. The increasing demand for efficient logistics solutions across various sectors, including e-commerce and manufacturing, is driving the need for reliable used trucks. Furthermore, the rising costs of new trucks are pushing businesses towards more cost-effective used truck options. Technological advancements, such as improved telematics and engine performance in older models, are also contributing to the market's growth. The market is segmented by vehicle type (light, medium, and heavy-duty trucks), sales channel (independent, franchised dealers, and peer-to-peer), and geographic region. North America, Europe, and Asia-Pacific are currently the dominant regions, with the US, Germany, China, and India as key markets. However, emerging economies in regions like South America and Africa present significant untapped potential for future growth. Competitive dynamics are shaped by major players like Volvo Trucks, PACCAR, and Daimler, alongside regional manufacturers such as Ashok Leyland and Tata Motors. The rise of online marketplaces and rental services is also transforming the sales landscape, adding another layer of complexity and opportunity to this dynamic industry.
The market's growth trajectory is, however, subject to certain restraints. Fluctuations in fuel prices, economic downturns impacting freight demand, and stringent emission regulations affecting older truck models pose challenges. The availability of certified pre-owned trucks and ensuring their quality and reliability will remain critical to sustaining consumer confidence. Furthermore, the growth of the used truck market is intertwined with the overall health of the commercial vehicle sector, making it sensitive to global economic conditions. Successfully navigating these challenges will require manufacturers and dealers to focus on providing value-added services, such as comprehensive warranties and maintenance packages, to bolster customer confidence and drive sales. Addressing concerns regarding environmental sustainability through the promotion of fuel-efficient models and responsible disposal methods will also be crucial for long-term market success.
Truck Industry Market Report: 2019-2033
This comprehensive report provides an in-depth analysis of the global truck industry, covering market size, segmentation, competitive landscape, and future growth prospects from 2019 to 2033. The report leverages robust data analysis to offer actionable insights for industry professionals, investors, and stakeholders. With a base year of 2025 and a forecast period spanning 2025-2033, this report is an essential resource for understanding the evolving dynamics of this multi-billion dollar market. Key players analyzed include Volvo Trucks, PACCAR Inc, Ashok Leyland, Tata Motors, MAN SE, Scania AB, Navistar International Corporation, Eicher, Renault SA, Mascus, Daimler AG, Enterprise Truck Rental, and AmeriQuest Used Truck.
Truck Industry Market Structure & Innovation Trends
The global truck industry, valued at $xx Million in 2024, exhibits a moderately concentrated market structure. Key players such as Volvo Trucks, Daimler AG, and PACCAR Inc. hold significant market share, though smaller players and regional manufacturers contribute substantially. Innovation is driven by factors like stringent emission regulations (e.g., Bharat Stage VI in India), the increasing adoption of telematics and autonomous driving technologies, and the growing demand for fuel-efficient and sustainable vehicles. The regulatory landscape is continuously evolving, impacting design, manufacturing, and operation. Product substitutes, primarily alternative transportation modes such as railways and shipping, pose a competitive threat. The industry witnesses continuous M&A activity, with recent deals exceeding $xx Million in value, reflecting strategic expansion and consolidation efforts. End-user demographics are largely influenced by the growth of e-commerce and the expansion of logistics and transportation networks.
- Market Concentration: Moderately concentrated with top players holding approximately xx% market share.
- Innovation Drivers: Emission regulations, telematics, autonomous driving, fuel efficiency.
- M&A Activity: Significant activity, with total deal value exceeding $xx Million in the last five years.
- Regulatory Frameworks: Stringent emission standards, safety regulations driving innovation and consolidation.

Truck Industry Market Dynamics & Trends
The global truck industry is experiencing robust growth, with a CAGR of xx% projected from 2025 to 2033. Key growth drivers include increasing infrastructure development globally, particularly in emerging economies, expansion of e-commerce logistics, and the ongoing replacement of aging truck fleets. Technological disruptions, such as the adoption of electric and alternative fuel trucks, are reshaping the industry landscape. Consumer preferences are shifting towards fuel-efficient, technologically advanced, and safe trucks. Intense competition among established players and the emergence of new entrants are driving innovation and price competitiveness. Market penetration of advanced technologies like ADAS (Advanced Driver-Assistance Systems) is increasing steadily.
Dominant Regions & Segments in Truck Industry
The North American and European regions are currently the dominant markets for heavy-duty trucks, driven by robust economic growth, efficient infrastructure, and established logistics networks. Within vehicle types, heavy-duty trucks hold the largest market share due to their critical role in long-haul transportation and construction. Franchised dealers continue to hold a strong position in the sales channel, benefiting from established relationships with OEMs and strong service networks. However, the peer-to-peer market is rapidly expanding, driven by online platforms and the growing preference for direct-to-consumer sales.
- Key Drivers for Heavy-Duty Trucks: Strong logistics demand, infrastructure development, government support for infrastructure projects.
- Key Drivers for Franchised Dealers: Established OEM relationships, strong after-sales service capabilities.
- Key Drivers for Peer-to-Peer Sales: Online platforms, increasing customer preference for direct-to-consumer purchasing.
Truck Industry Product Innovations
Recent innovations focus on improving fuel efficiency, safety, and driver comfort. Advanced driver-assistance systems (ADAS), electric and hybrid powertrains, and telematics solutions are becoming increasingly integrated into new truck models. These improvements enhance operational efficiency, reduce environmental impact, and meet evolving regulatory requirements. The market is also witnessing increased adoption of connected vehicles and data analytics for fleet management optimization.
Report Scope & Segmentation Analysis
This report segments the truck industry based on vehicle type (light, medium, and heavy-duty trucks) and sales channel (independent dealers, franchised dealers, and peer-to-peer). Growth projections for each segment are provided. The competitive dynamics within each segment are also analyzed, providing a detailed understanding of market share, competitive pressures, and innovation trends.
- Light Trucks: xx Million units in 2025, growing at xx% CAGR.
- Medium-duty Trucks: xx Million units in 2025, growing at xx% CAGR.
- Heavy-duty Trucks: xx Million units in 2025, growing at xx% CAGR.
- Independent Dealers: xx% market share in 2025, facing increased competition.
- Franchised Dealers: xx% market share in 2025, maintaining a strong presence.
- Peer-to-Peer: xx% market share in 2025, experiencing rapid growth.
Key Drivers of Truck Industry Growth
Several factors fuel truck industry growth. These include increasing global trade and e-commerce, expanding infrastructure development particularly in emerging markets, and a growing demand for efficient and sustainable transportation solutions. Government regulations promoting fuel efficiency and reducing emissions are also a significant driver.
Challenges in the Truck Industry Sector
The industry faces challenges like rising raw material costs, supply chain disruptions impacting production timelines, and intense competition. Stringent emission regulations necessitate substantial investments in new technologies, increasing production costs. Furthermore, fluctuations in fuel prices and economic downturns can significantly impact demand.
Emerging Opportunities in Truck Industry
Emerging opportunities lie in the growth of electric and alternative fuel trucks, advancements in autonomous driving technologies, and expansion into new markets with growing logistics needs. The increasing adoption of telematics and data analytics for fleet management presents significant opportunities for service providers.
Leading Players in the Truck Industry Market
- Volvo Trucks
- PACCAR Inc
- Ashok Leyland
- Tata Motors
- MAN SE (Volkswagen AG)
- Scania AB (Traton SE)
- Navistar International Corporation
- Eicher
- Renault SA
- Mascus
- Daimler AG (SelecTrucks)
- Enterprise Truck Rental
- AmeriQuest Used Truck
Key Developments in Truck Industry
- August 2023: Ashok Leyland launched its e-marketplace 'Re-AL' for used trucks, facilitating vehicle exchange and upgrades. This significantly impacts the used truck market and enhances customer experience.
- June 2023: Daimler introduced the "Bharat Benz Certified" platform for pre-owned trucks with an AMC, boosting customer trust and sustainability within the used truck segment.
Future Outlook for Truck Industry Market
The truck industry is poised for continued growth, driven by technological advancements, infrastructure development, and the increasing demand for efficient transportation solutions. The adoption of electric and autonomous vehicles will significantly reshape the market landscape, presenting both challenges and opportunities for established and emerging players. Strategic partnerships and investments in innovative technologies will be crucial for success in the years to come.
Truck Industry Segmentation
-
1. Vehicle Type
- 1.1. Light Trucks
- 1.2. Medium-duty Trucks
- 1.3. Heavy-duty Trucks
-
2. Sales Channel
- 2.1. Independent Dealer
- 2.2. Franchised Dealer
- 2.3. Peer-to-peer
Truck Industry Segmentation By Geography
-
1. North America
- 1.1. United States
- 1.2. Canada
- 1.3. Rest of North America
-
2. Europe
- 2.1. Germany
- 2.2. United Kingdom
- 2.3. France
- 2.4. Russia
- 2.5. Italy
- 2.6. Rest of Europe
-
3. Asia Pacific
- 3.1. China
- 3.2. Japan
- 3.3. India
- 3.4. South Korea
- 3.5. Rest of Asia Pacific
-
4. Rest of the World
- 4.1. Brazil
- 4.2. South Africa
- 4.3. Other Countries

Truck Industry REPORT HIGHLIGHTS
| Aspects | Details |
|---|---|
| Study Period | 2019-2033 |
| Base Year | 2024 |
| Estimated Year | 2025 |
| Forecast Period | 2025-2033 |
| Historical Period | 2019-2024 |
| Growth Rate | CAGR of > 5.23% from 2019-2033 |
| Segmentation |
|
Table of Contents
- 1. Introduction
- 1.1. Research Scope
- 1.2. Market Segmentation
- 1.3. Research Methodology
- 1.4. Definitions and Assumptions
- 2. Executive Summary
- 2.1. Introduction
- 3. Market Dynamics
- 3.1. Introduction
- 3.2. Market Drivers
- 3.2.1. Increasing Infrastructure and Growing Construction Activities are Driving the Demand for Used Trucks; Cost Effectiveness and Affordability are Fueling the Demand for Used Trucks
- 3.3. Market Restrains
- 3.3.1. Stringent Emission and Safety Standards Present Challenges for the Market
- 3.4. Market Trends
- 3.4.1. Heavy-duty Trucks Will be the Leading Segment
- 4. Market Factor Analysis
- 4.1. Porters Five Forces
- 4.2. Supply/Value Chain
- 4.3. PESTEL analysis
- 4.4. Market Entropy
- 4.5. Patent/Trademark Analysis
- 5. Global Truck Industry Analysis, Insights and Forecast, 2019-2031
- 5.1. Market Analysis, Insights and Forecast - by Vehicle Type
- 5.1.1. Light Trucks
- 5.1.2. Medium-duty Trucks
- 5.1.3. Heavy-duty Trucks
- 5.2. Market Analysis, Insights and Forecast - by Sales Channel
- 5.2.1. Independent Dealer
- 5.2.2. Franchised Dealer
- 5.2.3. Peer-to-peer
- 5.3. Market Analysis, Insights and Forecast - by Region
- 5.3.1. North America
- 5.3.2. Europe
- 5.3.3. Asia Pacific
- 5.3.4. Rest of the World
- 5.1. Market Analysis, Insights and Forecast - by Vehicle Type
- 6. North America Truck Industry Analysis, Insights and Forecast, 2019-2031
- 6.1. Market Analysis, Insights and Forecast - by Vehicle Type
- 6.1.1. Light Trucks
- 6.1.2. Medium-duty Trucks
- 6.1.3. Heavy-duty Trucks
- 6.2. Market Analysis, Insights and Forecast - by Sales Channel
- 6.2.1. Independent Dealer
- 6.2.2. Franchised Dealer
- 6.2.3. Peer-to-peer
- 6.1. Market Analysis, Insights and Forecast - by Vehicle Type
- 7. Europe Truck Industry Analysis, Insights and Forecast, 2019-2031
- 7.1. Market Analysis, Insights and Forecast - by Vehicle Type
- 7.1.1. Light Trucks
- 7.1.2. Medium-duty Trucks
- 7.1.3. Heavy-duty Trucks
- 7.2. Market Analysis, Insights and Forecast - by Sales Channel
- 7.2.1. Independent Dealer
- 7.2.2. Franchised Dealer
- 7.2.3. Peer-to-peer
- 7.1. Market Analysis, Insights and Forecast - by Vehicle Type
- 8. Asia Pacific Truck Industry Analysis, Insights and Forecast, 2019-2031
- 8.1. Market Analysis, Insights and Forecast - by Vehicle Type
- 8.1.1. Light Trucks
- 8.1.2. Medium-duty Trucks
- 8.1.3. Heavy-duty Trucks
- 8.2. Market Analysis, Insights and Forecast - by Sales Channel
- 8.2.1. Independent Dealer
- 8.2.2. Franchised Dealer
- 8.2.3. Peer-to-peer
- 8.1. Market Analysis, Insights and Forecast - by Vehicle Type
- 9. Rest of the World Truck Industry Analysis, Insights and Forecast, 2019-2031
- 9.1. Market Analysis, Insights and Forecast - by Vehicle Type
- 9.1.1. Light Trucks
- 9.1.2. Medium-duty Trucks
- 9.1.3. Heavy-duty Trucks
- 9.2. Market Analysis, Insights and Forecast - by Sales Channel
- 9.2.1. Independent Dealer
- 9.2.2. Franchised Dealer
- 9.2.3. Peer-to-peer
- 9.1. Market Analysis, Insights and Forecast - by Vehicle Type
- 10. North America Truck Industry Analysis, Insights and Forecast, 2019-2031
- 10.1. Market Analysis, Insights and Forecast - By Country/Sub-region
- 10.1.1 United States
- 10.1.2 Canada
- 10.1.3 Rest of North America
- 11. Europe Truck Industry Analysis, Insights and Forecast, 2019-2031
- 11.1. Market Analysis, Insights and Forecast - By Country/Sub-region
- 11.1.1 Germany
- 11.1.2 United Kingdom
- 11.1.3 France
- 11.1.4 Russia
- 11.1.5 Italy
- 11.1.6 Rest of Europe
- 12. Asia Pacific Truck Industry Analysis, Insights and Forecast, 2019-2031
- 12.1. Market Analysis, Insights and Forecast - By Country/Sub-region
- 12.1.1 China
- 12.1.2 Japan
- 12.1.3 India
- 12.1.4 South Korea
- 12.1.5 Rest of Asia Pacific
- 13. Rest of the World Truck Industry Analysis, Insights and Forecast, 2019-2031
- 13.1. Market Analysis, Insights and Forecast - By Country/Sub-region
- 13.1.1 Brazil
- 13.1.2 South Africa
- 13.1.3 Other Countries
- 14. Competitive Analysis
- 14.1. Global Market Share Analysis 2024
- 14.2. Company Profiles
- 14.2.1 Volvo Trucks
- 14.2.1.1. Overview
- 14.2.1.2. Products
- 14.2.1.3. SWOT Analysis
- 14.2.1.4. Recent Developments
- 14.2.1.5. Financials (Based on Availability)
- 14.2.2 PACCAR Inc
- 14.2.2.1. Overview
- 14.2.2.2. Products
- 14.2.2.3. SWOT Analysis
- 14.2.2.4. Recent Developments
- 14.2.2.5. Financials (Based on Availability)
- 14.2.3 Ashok Leyland
- 14.2.3.1. Overview
- 14.2.3.2. Products
- 14.2.3.3. SWOT Analysis
- 14.2.3.4. Recent Developments
- 14.2.3.5. Financials (Based on Availability)
- 14.2.4 Tata Motors
- 14.2.4.1. Overview
- 14.2.4.2. Products
- 14.2.4.3. SWOT Analysis
- 14.2.4.4. Recent Developments
- 14.2.4.5. Financials (Based on Availability)
- 14.2.5 MAN SE (Volkswagen AG)
- 14.2.5.1. Overview
- 14.2.5.2. Products
- 14.2.5.3. SWOT Analysis
- 14.2.5.4. Recent Developments
- 14.2.5.5. Financials (Based on Availability)
- 14.2.6 Scania AB ( Traton SE)
- 14.2.6.1. Overview
- 14.2.6.2. Products
- 14.2.6.3. SWOT Analysis
- 14.2.6.4. Recent Developments
- 14.2.6.5. Financials (Based on Availability)
- 14.2.7 Navistar International Corporation
- 14.2.7.1. Overview
- 14.2.7.2. Products
- 14.2.7.3. SWOT Analysis
- 14.2.7.4. Recent Developments
- 14.2.7.5. Financials (Based on Availability)
- 14.2.8 Eicher
- 14.2.8.1. Overview
- 14.2.8.2. Products
- 14.2.8.3. SWOT Analysis
- 14.2.8.4. Recent Developments
- 14.2.8.5. Financials (Based on Availability)
- 14.2.9 Renault SA
- 14.2.9.1. Overview
- 14.2.9.2. Products
- 14.2.9.3. SWOT Analysis
- 14.2.9.4. Recent Developments
- 14.2.9.5. Financials (Based on Availability)
- 14.2.10 Mascus
- 14.2.10.1. Overview
- 14.2.10.2. Products
- 14.2.10.3. SWOT Analysis
- 14.2.10.4. Recent Developments
- 14.2.10.5. Financials (Based on Availability)
- 14.2.11 Daimler AG (SelecTrucks)
- 14.2.11.1. Overview
- 14.2.11.2. Products
- 14.2.11.3. SWOT Analysis
- 14.2.11.4. Recent Developments
- 14.2.11.5. Financials (Based on Availability)
- 14.2.12 Enterprise Truck Rental
- 14.2.12.1. Overview
- 14.2.12.2. Products
- 14.2.12.3. SWOT Analysis
- 14.2.12.4. Recent Developments
- 14.2.12.5. Financials (Based on Availability)
- 14.2.13 AmeriQuest Used Truck
- 14.2.13.1. Overview
- 14.2.13.2. Products
- 14.2.13.3. SWOT Analysis
- 14.2.13.4. Recent Developments
- 14.2.13.5. Financials (Based on Availability)
- 14.2.1 Volvo Trucks
List of Figures
- Figure 1: Global Truck Industry Revenue Breakdown (Million, %) by Region 2024 & 2032
- Figure 2: North America Truck Industry Revenue (Million), by Country 2024 & 2032
- Figure 3: North America Truck Industry Revenue Share (%), by Country 2024 & 2032
- Figure 4: Europe Truck Industry Revenue (Million), by Country 2024 & 2032
- Figure 5: Europe Truck Industry Revenue Share (%), by Country 2024 & 2032
- Figure 6: Asia Pacific Truck Industry Revenue (Million), by Country 2024 & 2032
- Figure 7: Asia Pacific Truck Industry Revenue Share (%), by Country 2024 & 2032
- Figure 8: Rest of the World Truck Industry Revenue (Million), by Country 2024 & 2032
- Figure 9: Rest of the World Truck Industry Revenue Share (%), by Country 2024 & 2032
- Figure 10: North America Truck Industry Revenue (Million), by Vehicle Type 2024 & 2032
- Figure 11: North America Truck Industry Revenue Share (%), by Vehicle Type 2024 & 2032
- Figure 12: North America Truck Industry Revenue (Million), by Sales Channel 2024 & 2032
- Figure 13: North America Truck Industry Revenue Share (%), by Sales Channel 2024 & 2032
- Figure 14: North America Truck Industry Revenue (Million), by Country 2024 & 2032
- Figure 15: North America Truck Industry Revenue Share (%), by Country 2024 & 2032
- Figure 16: Europe Truck Industry Revenue (Million), by Vehicle Type 2024 & 2032
- Figure 17: Europe Truck Industry Revenue Share (%), by Vehicle Type 2024 & 2032
- Figure 18: Europe Truck Industry Revenue (Million), by Sales Channel 2024 & 2032
- Figure 19: Europe Truck Industry Revenue Share (%), by Sales Channel 2024 & 2032
- Figure 20: Europe Truck Industry Revenue (Million), by Country 2024 & 2032
- Figure 21: Europe Truck Industry Revenue Share (%), by Country 2024 & 2032
- Figure 22: Asia Pacific Truck Industry Revenue (Million), by Vehicle Type 2024 & 2032
- Figure 23: Asia Pacific Truck Industry Revenue Share (%), by Vehicle Type 2024 & 2032
- Figure 24: Asia Pacific Truck Industry Revenue (Million), by Sales Channel 2024 & 2032
- Figure 25: Asia Pacific Truck Industry Revenue Share (%), by Sales Channel 2024 & 2032
- Figure 26: Asia Pacific Truck Industry Revenue (Million), by Country 2024 & 2032
- Figure 27: Asia Pacific Truck Industry Revenue Share (%), by Country 2024 & 2032
- Figure 28: Rest of the World Truck Industry Revenue (Million), by Vehicle Type 2024 & 2032
- Figure 29: Rest of the World Truck Industry Revenue Share (%), by Vehicle Type 2024 & 2032
- Figure 30: Rest of the World Truck Industry Revenue (Million), by Sales Channel 2024 & 2032
- Figure 31: Rest of the World Truck Industry Revenue Share (%), by Sales Channel 2024 & 2032
- Figure 32: Rest of the World Truck Industry Revenue (Million), by Country 2024 & 2032
- Figure 33: Rest of the World Truck Industry Revenue Share (%), by Country 2024 & 2032
List of Tables
- Table 1: Global Truck Industry Revenue Million Forecast, by Region 2019 & 2032
- Table 2: Global Truck Industry Revenue Million Forecast, by Vehicle Type 2019 & 2032
- Table 3: Global Truck Industry Revenue Million Forecast, by Sales Channel 2019 & 2032
- Table 4: Global Truck Industry Revenue Million Forecast, by Region 2019 & 2032
- Table 5: Global Truck Industry Revenue Million Forecast, by Country 2019 & 2032
- Table 6: United States Truck Industry Revenue (Million) Forecast, by Application 2019 & 2032
- Table 7: Canada Truck Industry Revenue (Million) Forecast, by Application 2019 & 2032
- Table 8: Rest of North America Truck Industry Revenue (Million) Forecast, by Application 2019 & 2032
- Table 9: Global Truck Industry Revenue Million Forecast, by Country 2019 & 2032
- Table 10: Germany Truck Industry Revenue (Million) Forecast, by Application 2019 & 2032
- Table 11: United Kingdom Truck Industry Revenue (Million) Forecast, by Application 2019 & 2032
- Table 12: France Truck Industry Revenue (Million) Forecast, by Application 2019 & 2032
- Table 13: Russia Truck Industry Revenue (Million) Forecast, by Application 2019 & 2032
- Table 14: Italy Truck Industry Revenue (Million) Forecast, by Application 2019 & 2032
- Table 15: Rest of Europe Truck Industry Revenue (Million) Forecast, by Application 2019 & 2032
- Table 16: Global Truck Industry Revenue Million Forecast, by Country 2019 & 2032
- Table 17: China Truck Industry Revenue (Million) Forecast, by Application 2019 & 2032
- Table 18: Japan Truck Industry Revenue (Million) Forecast, by Application 2019 & 2032
- Table 19: India Truck Industry Revenue (Million) Forecast, by Application 2019 & 2032
- Table 20: South Korea Truck Industry Revenue (Million) Forecast, by Application 2019 & 2032
- Table 21: Rest of Asia Pacific Truck Industry Revenue (Million) Forecast, by Application 2019 & 2032
- Table 22: Global Truck Industry Revenue Million Forecast, by Country 2019 & 2032
- Table 23: Brazil Truck Industry Revenue (Million) Forecast, by Application 2019 & 2032
- Table 24: South Africa Truck Industry Revenue (Million) Forecast, by Application 2019 & 2032
- Table 25: Other Countries Truck Industry Revenue (Million) Forecast, by Application 2019 & 2032
- Table 26: Global Truck Industry Revenue Million Forecast, by Vehicle Type 2019 & 2032
- Table 27: Global Truck Industry Revenue Million Forecast, by Sales Channel 2019 & 2032
- Table 28: Global Truck Industry Revenue Million Forecast, by Country 2019 & 2032
- Table 29: United States Truck Industry Revenue (Million) Forecast, by Application 2019 & 2032
- Table 30: Canada Truck Industry Revenue (Million) Forecast, by Application 2019 & 2032
- Table 31: Rest of North America Truck Industry Revenue (Million) Forecast, by Application 2019 & 2032
- Table 32: Global Truck Industry Revenue Million Forecast, by Vehicle Type 2019 & 2032
- Table 33: Global Truck Industry Revenue Million Forecast, by Sales Channel 2019 & 2032
- Table 34: Global Truck Industry Revenue Million Forecast, by Country 2019 & 2032
- Table 35: Germany Truck Industry Revenue (Million) Forecast, by Application 2019 & 2032
- Table 36: United Kingdom Truck Industry Revenue (Million) Forecast, by Application 2019 & 2032
- Table 37: France Truck Industry Revenue (Million) Forecast, by Application 2019 & 2032
- Table 38: Russia Truck Industry Revenue (Million) Forecast, by Application 2019 & 2032
- Table 39: Italy Truck Industry Revenue (Million) Forecast, by Application 2019 & 2032
- Table 40: Rest of Europe Truck Industry Revenue (Million) Forecast, by Application 2019 & 2032
- Table 41: Global Truck Industry Revenue Million Forecast, by Vehicle Type 2019 & 2032
- Table 42: Global Truck Industry Revenue Million Forecast, by Sales Channel 2019 & 2032
- Table 43: Global Truck Industry Revenue Million Forecast, by Country 2019 & 2032
- Table 44: China Truck Industry Revenue (Million) Forecast, by Application 2019 & 2032
- Table 45: Japan Truck Industry Revenue (Million) Forecast, by Application 2019 & 2032
- Table 46: India Truck Industry Revenue (Million) Forecast, by Application 2019 & 2032
- Table 47: South Korea Truck Industry Revenue (Million) Forecast, by Application 2019 & 2032
- Table 48: Rest of Asia Pacific Truck Industry Revenue (Million) Forecast, by Application 2019 & 2032
- Table 49: Global Truck Industry Revenue Million Forecast, by Vehicle Type 2019 & 2032
- Table 50: Global Truck Industry Revenue Million Forecast, by Sales Channel 2019 & 2032
- Table 51: Global Truck Industry Revenue Million Forecast, by Country 2019 & 2032
- Table 52: Brazil Truck Industry Revenue (Million) Forecast, by Application 2019 & 2032
- Table 53: South Africa Truck Industry Revenue (Million) Forecast, by Application 2019 & 2032
- Table 54: Other Countries Truck Industry Revenue (Million) Forecast, by Application 2019 & 2032
Frequently Asked Questions
1. What is the projected Compound Annual Growth Rate (CAGR) of the Truck Industry?
The projected CAGR is approximately > 5.23%.
2. Which companies are prominent players in the Truck Industry?
Key companies in the market include Volvo Trucks, PACCAR Inc, Ashok Leyland, Tata Motors, MAN SE (Volkswagen AG), Scania AB ( Traton SE), Navistar International Corporation, Eicher, Renault SA, Mascus, Daimler AG (SelecTrucks), Enterprise Truck Rental, AmeriQuest Used Truck.
3. What are the main segments of the Truck Industry?
The market segments include Vehicle Type, Sales Channel.
4. Can you provide details about the market size?
The market size is estimated to be USD 47.62 Million as of 2022.
5. What are some drivers contributing to market growth?
Increasing Infrastructure and Growing Construction Activities are Driving the Demand for Used Trucks; Cost Effectiveness and Affordability are Fueling the Demand for Used Trucks.
6. What are the notable trends driving market growth?
Heavy-duty Trucks Will be the Leading Segment.
7. Are there any restraints impacting market growth?
Stringent Emission and Safety Standards Present Challenges for the Market.
8. Can you provide examples of recent developments in the market?
August 2023: Ashok Leyland introduced its e-marketplace 'Re-AL', dedicated to the sale of used trucks. The platform enables customers to exchange their existing commercial vehicles and upgrade to new Ashok Leyland trucks and buses. The e-marketplace provides customers with various features to help them easily locate vehicles of their choice, including verified images of the vehicles, validated documents, and evaluation reports.
9. What pricing options are available for accessing the report?
Pricing options include single-user, multi-user, and enterprise licenses priced at USD 4750, USD 5250, and USD 8750 respectively.
10. Is the market size provided in terms of value or volume?
The market size is provided in terms of value, measured in Million.
11. Are there any specific market keywords associated with the report?
Yes, the market keyword associated with the report is "Truck Industry," which aids in identifying and referencing the specific market segment covered.
12. How do I determine which pricing option suits my needs best?
The pricing options vary based on user requirements and access needs. Individual users may opt for single-user licenses, while businesses requiring broader access may choose multi-user or enterprise licenses for cost-effective access to the report.
13. Are there any additional resources or data provided in the Truck Industry report?
While the report offers comprehensive insights, it's advisable to review the specific contents or supplementary materials provided to ascertain if additional resources or data are available.
14. How can I stay updated on further developments or reports in the Truck Industry?
To stay informed about further developments, trends, and reports in the Truck Industry, consider subscribing to industry newsletters, following relevant companies and organizations, or regularly checking reputable industry news sources and publications.
Methodology
Step 1 - Identification of Relevant Samples Size from Population Database


Step 2 - Approaches for Defining Global Market Size (Value, Volume* & Price*)

Note*: In applicable scenarios
Step 3 - Data Sources
Primary Research
- Web Analytics
- Survey Reports
- Research Institute
- Latest Research Reports
- Opinion Leaders
Secondary Research
- Annual Reports
- White Paper
- Latest Press Release
- Industry Association
- Paid Database
- Investor Presentations

Step 4 - Data Triangulation
Involves using different sources of information in order to increase the validity of a study
These sources are likely to be stakeholders in a program - participants, other researchers, program staff, other community members, and so on.
Then we put all data in single framework & apply various statistical tools to find out the dynamic on the market.
During the analysis stage, feedback from the stakeholder groups would be compared to determine areas of agreement as well as areas of divergence


