

Key Insights
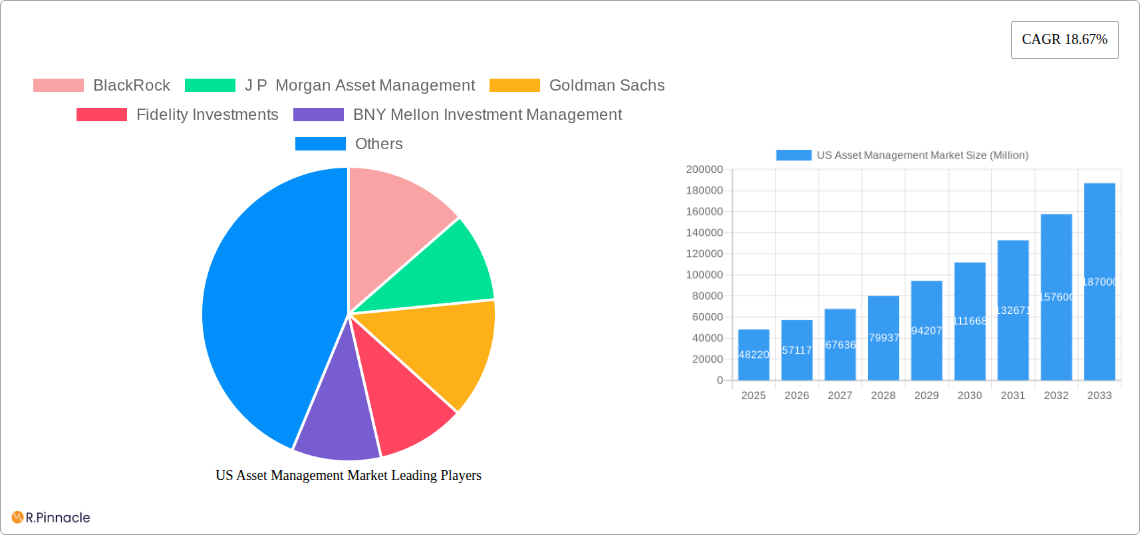
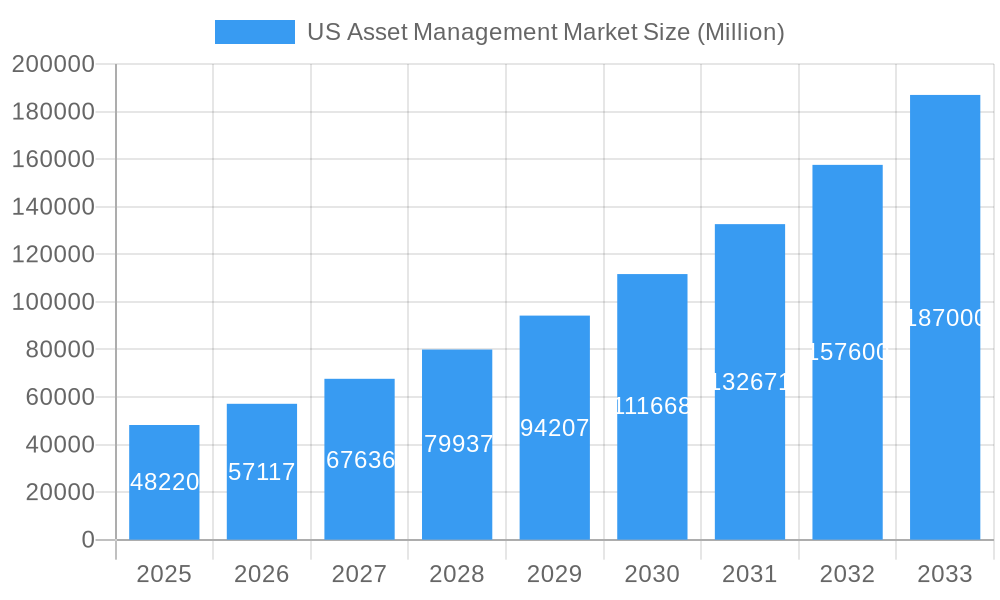
The US asset management market, valued at $48.22 billion in 2025, is projected to experience robust growth, exhibiting a compound annual growth rate (CAGR) of 18.67% from 2025 to 2033. This expansion is fueled by several key factors. The increasing prevalence of retirement savings plans, such as 401(k)s and IRAs, necessitates professional asset management services, driving demand. Furthermore, the growing sophistication of investors, particularly among high-net-worth individuals and institutional investors, is creating a need for specialized investment strategies and tailored portfolio management. Technological advancements, such as the rise of robo-advisors and algorithmic trading, are also contributing to market growth by enhancing efficiency and accessibility. However, regulatory scrutiny and potential market volatility pose challenges to sustained growth. Competition among established giants like BlackRock, JPMorgan Asset Management, and Fidelity Investments, alongside the emergence of smaller, specialized firms, intensifies the need for continuous innovation and strategic adaptation within the sector.
US Asset Management Market Market Size (In Billion)
The market segmentation, while not explicitly detailed, likely reflects diverse investment strategies (e.g., equity, fixed income, alternative investments) and client demographics (institutional vs. retail investors). Geographic distribution within the US is also a key factor influencing market dynamics; coastal regions with high concentrations of wealth and financial institutions will likely show stronger growth than less developed areas. Over the forecast period (2025-2033), the continued adoption of sustainable and responsible investing (SRI) practices will be a significant driver, as investors increasingly prioritize environmental, social, and governance (ESG) factors. This will likely reshape the competitive landscape, rewarding firms demonstrating commitment to ESG principles. The robust growth trajectory suggests significant opportunities for both established players and new entrants, but the need for robust risk management and adaptation to evolving regulatory requirements is crucial for long-term success.
US Asset Management Market Company Market Share
US Asset Management Market Report: 2019-2033
This comprehensive report provides an in-depth analysis of the US Asset Management Market, covering the period from 2019 to 2033. It offers actionable insights for industry professionals, investors, and strategic decision-makers. The report leverages rigorous data analysis and expert commentary to forecast market trends and identify key opportunities. The estimated market size in 2025 is xx Million, with a projected Compound Annual Growth Rate (CAGR) of xx% from 2025 to 2033.
US Asset Management Market Market Structure & Innovation Trends
This section provides a comprehensive analysis of the competitive landscape within the US asset management market. We delve into market concentration, dissecting the dominance of key players and the evolving market share dynamics. The report highlights the pivotal role of technological advancements and emerging business models as significant drivers of innovation, alongside an examination of the intricate regulatory frameworks that shape the industry's operations and foster investor confidence. Furthermore, we scrutinize merger and acquisition (M&A) activity, identifying strategic consolidations and their impact on market structure. The report details the market share held by leading firms such as BlackRock, J.P. Morgan Asset Management, Goldman Sachs Asset Management, Fidelity Investments, BNY Mellon Investment Management, The Vanguard Group, State Street Global Advisors, Pacific Investment Management Company LLC (PIMCO), Franklin Templeton Investments, and Wellington Management Company LLC, among others.
- Market Concentration: The US asset management market is characterized by a notable degree of concentration. The top 10 firms collectively commanded an estimated [Insert Specific Percentage]% of the market in 2024, underscoring the significant influence of established players. The report provides granular market share data for each key firm, offering a clear picture of the competitive intensity and strategic positioning within the industry.
- Innovation Drivers: Technological innovation is a paramount driver, with advancements in Artificial Intelligence (AI), machine learning, big data analytics, and the proliferation of sophisticated robo-advisor platforms redefining investment strategies and client engagement. The robust regulatory environment, while demanding, inadvertently spurs innovation by mandating greater transparency and prioritizing investor protection, encouraging firms to develop more sophisticated and compliant solutions.
- Regulatory Frameworks: The Securities and Exchange Commission (SEC) and other federal and state regulatory bodies exert a profound influence on the market's structure and operational efficiency. This section thoroughly investigates the multifaceted impact of these regulations, including their implications for compliance costs, operational adaptations, and the overall pace of innovation, all while safeguarding investor interests.
- Product Substitutes & Emerging Threats: The burgeoning fintech sector, coupled with the increasing appeal of alternative investment strategies (e.g., private equity, venture capital, hedge funds), presents both formidable challenges and lucrative opportunities for traditional asset managers. The report meticulously analyzes the disruptive potential of these evolving product substitutes on established market shares and the overarching competitive dynamics.
- End-User Demographics & Evolving Investor Needs: This segment offers in-depth insights into the changing demographics of the investor base. It details shifts in age, wealth distribution, investment preferences (e.g., ESG considerations, thematic investing), and risk tolerance, providing a crucial understanding of how asset managers must adapt their offerings to meet the demands of a diverse and dynamic clientele.
- M&A Activity: The report provides a detailed analysis of significant M&A transactions executed within the specified period, including their financial valuations and their direct impact on market concentration. For instance, BlackRock's strategic acquisition of Kreos in 2023 is examined for its contribution to expanding its capabilities and market presence within the burgeoning private markets segment. The aggregate value of M&A deals recorded between 2019 and 2024 is estimated at approximately [Insert Specific Monetary Value] Million.
US Asset Management Market Market Dynamics & Trends
This section provides a deep dive into the critical growth drivers and prevailing challenges shaping the US asset management market. We meticulously examine the key catalysts propelling market expansion, the transformative impact of technological disruptions, evolving consumer preferences, and the intricate web of competitive dynamics. Specific performance indicators, such as Compound Annual Growth Rate (CAGR) and market penetration rates, are presented to vividly illustrate the market's evolutionary trajectory. The analysis comprehensively integrates the influence of macroeconomic factors, prevailing investor sentiment, and the ever-changing regulatory landscapes. Furthermore, the section elaborates on the pervasive influence of technological innovations, particularly the accelerating adoption of AI-powered investment strategies, and their profound effect on market growth, operational efficiency, and the creation of alpha. The report also scrutinizes the palpable impact of shifting investor inclinations, including the surging demand for sustainable, responsible, and impact investing (SRI) products. Finally, we conduct a thorough analysis of competitive forces, encompassing escalating pricing pressures, the strategic entry of new and agile players, and the ongoing consolidation trends within the industry.
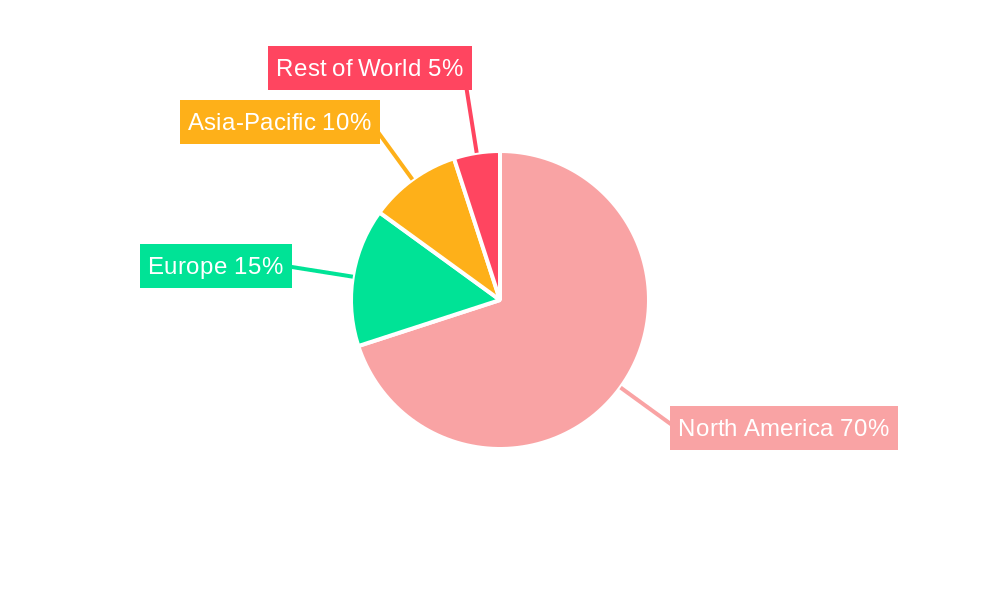
Dominant Regions & Segments in US Asset Management Market
This section pinpoints the leading regions and segments within the US asset management market, providing in-depth analysis of their dominance.
- Key Drivers of Dominance:
- Strong economic growth
- Developed financial infrastructure
- Favorable regulatory environment
- High concentration of high-net-worth individuals and institutional investors
The detailed analysis examines factors contributing to the dominance of specific regions and segments.
US Asset Management Market Product Innovations
This section summarizes recent product developments, applications, and competitive advantages within the US asset management market. Technological trends such as the integration of AI and machine learning in portfolio management, algorithmic trading, and risk management are highlighted, along with their impact on market fit and competitiveness. The report emphasizes new product offerings such as ESG funds, impact investing products, and personalized investment solutions that cater to the evolving demands of investors.
Report Scope & Segmentation Analysis
This comprehensive report meticulously segments the US asset management market across several key dimensions to offer a granular understanding of its structure and future potential. The segmentation includes: Asset Class (e.g., Equities, Fixed Income, Alternatives, Real Assets, Money Market Instruments), Client Type (e.g., Institutional Investors like pension funds, endowments, foundations, sovereign wealth funds; and Retail Investors), and Service Type (e.g., Active Management, Passive Management/Index Funds, Exchange-Traded Funds (ETFs), separately managed accounts). For each defined segment, the report delivers detailed growth projections for the forecast period (2025-2033), current and projected market size (expressed in millions of US dollars), and a nuanced analysis of the competitive landscape. This granular approach provides stakeholders with actionable insights into specific market niches and their respective growth trajectories.
Key Drivers of US Asset Management Market Growth
Key drivers of growth include the increasing adoption of technology, favorable economic conditions, and evolving regulatory landscapes. Specifically, the growth of digital wealth management platforms, rising demand for sustainable and responsible investments, and government initiatives promoting financial inclusion are highlighted.
Challenges in the US Asset Management Market Sector
The US asset management sector faces a confluence of significant challenges that impact its profitability and strategic direction. These include intensifying regulatory scrutiny, which necessitates substantial investments in compliance and robust risk management frameworks. The market is also characterized by fierce and ever-increasing competition, not only from established players but also from agile new entrants and alternative investment platforms. Furthermore, evolving investor expectations, driven by factors like the demand for greater transparency, personalized services, and a growing emphasis on Environmental, Social, and Governance (ESG) principles, require asset managers to continuously adapt their product offerings and communication strategies. The report quantifies the tangible impacts of these challenges, such as the escalation of compliance costs, downward pressure on management fees, and the erosion of profit margins, providing a clear understanding of the operational and financial headwinds faced by firms.
Emerging Opportunities in US Asset Management Market
Emerging opportunities encompass the growing demand for personalized investment solutions, the expansion of alternative investment strategies, and the integration of advanced technologies. The potential of these opportunities for market expansion and revenue generation is explored.
Leading Players in the US Asset Management Market Market
Key Developments in US Asset Management Market Industry
- August 2023: BlackRock, a global leader in investment management, significantly bolstered its private markets capabilities with the strategic acquisition of Kreos, a prominent provider of specialized lending solutions. This move aims to expand BlackRock's alternative asset offerings and capture greater market share in the rapidly growing private credit space.
- January 2023: Fidelity Investments, a diversified financial services company, further enhanced its technological infrastructure and client service capabilities through the acquisition of Shoobx, a company specializing in automating and streamlining business operations for startups and venture-backed companies. This acquisition underscores Fidelity's commitment to leveraging technology to provide comprehensive solutions for its diverse client base.
Future Outlook for US Asset Management Market Market
The US asset management market is poised for continued growth, driven by technological advancements, evolving investor preferences, and the expansion of alternative investment strategies. Strategic opportunities exist for firms that can adapt to the changing landscape and leverage technology to enhance efficiency and client service. The forecast period (2025-2033) presents substantial potential for market expansion and revenue generation for key players.
US Asset Management Market Segmentation
-
1. Client Type
- 1.1. Retail
- 1.2. Pension Fund
- 1.3. Insurance Companies
- 1.4. Banks
- 1.5. Other Client Types
-
2. Asset Class
- 2.1. Equity
- 2.2. Fixed Income
- 2.3. Cash/Money Market
- 2.4. Alternative Investments
- 2.5. Other Asset Classes
US Asset Management Market Segmentation By Geography
-
1. North America
- 1.1. United States
- 1.2. Canada
- 1.3. Mexico
-
2. South America
- 2.1. Brazil
- 2.2. Argentina
- 2.3. Rest of South America
-
3. Europe
- 3.1. United Kingdom
- 3.2. Germany
- 3.3. France
- 3.4. Italy
- 3.5. Spain
- 3.6. Russia
- 3.7. Benelux
- 3.8. Nordics
- 3.9. Rest of Europe
-
4. Middle East & Africa
- 4.1. Turkey
- 4.2. Israel
- 4.3. GCC
- 4.4. North Africa
- 4.5. South Africa
- 4.6. Rest of Middle East & Africa
-
5. Asia Pacific
- 5.1. China
- 5.2. India
- 5.3. Japan
- 5.4. South Korea
- 5.5. ASEAN
- 5.6. Oceania
- 5.7. Rest of Asia Pacific
US Asset Management Market Regional Market Share
Geographic Coverage of US Asset Management Market
US Asset Management Market REPORT HIGHLIGHTS
| Aspects | Details |
|---|---|
| Study Period | 2020-2034 |
| Base Year | 2025 |
| Estimated Year | 2026 |
| Forecast Period | 2026-2034 |
| Historical Period | 2020-2025 |
| Growth Rate | CAGR of 18.67% from 2020-2034 |
| Segmentation |
|
Table of Contents
- 1. Introduction
- 1.1. Research Scope
- 1.2. Market Segmentation
- 1.3. Research Objective
- 1.4. Definitions and Assumptions
- 2. Executive Summary
- 2.1. Market Snapshot
- 3. Market Dynamics
- 3.1. Market Drivers
- 3.2. Market Restrains
- 3.3. Market Trends
- 3.4. Market Opportunities
- 4. Market Factor Analysis
- 4.1. Porters Five Forces
- 4.1.1. Bargaining Power of Suppliers
- 4.1.2. Bargaining Power of Buyers
- 4.1.3. Threat of New Entrants
- 4.1.4. Threat of Substitutes
- 4.1.5. Competitive Rivalry
- 4.2. PESTEL analysis
- 4.3. BCG Analysis
- 4.3.1. Stars (High Growth, High Market Share)
- 4.3.2. Cash Cows (Low Growth, High Market Share)
- 4.3.3. Question Mark (High Growth, Low Market Share)
- 4.3.4. Dogs (Low Growth, Low Market Share)
- 4.4. Ansoff Matrix Analysis
- 4.5. Supply Chain Analysis
- 4.6. Regulatory Landscape
- 4.7. Current Market Potential and Opportunity Assessment (TAM–SAM–SOM Framework)
- 4.8. PRI Analyst Note
- 4.1. Porters Five Forces
- 5. Market Analysis, Insights and Forecast 2021-2033
- 5.1. Market Analysis, Insights and Forecast - by Client Type
- 5.1.1. Retail
- 5.1.2. Pension Fund
- 5.1.3. Insurance Companies
- 5.1.4. Banks
- 5.1.5. Other Client Types
- 5.2. Market Analysis, Insights and Forecast - by Asset Class
- 5.2.1. Equity
- 5.2.2. Fixed Income
- 5.2.3. Cash/Money Market
- 5.2.4. Alternative Investments
- 5.2.5. Other Asset Classes
- 5.3. Market Analysis, Insights and Forecast - by Region
- 5.3.1. North America
- 5.3.2. South America
- 5.3.3. Europe
- 5.3.4. Middle East & Africa
- 5.3.5. Asia Pacific
- 5.1. Market Analysis, Insights and Forecast - by Client Type
- 6. Global US Asset Management Market Analysis, Insights and Forecast, 2021-2033
- 6.1. Market Analysis, Insights and Forecast - by Client Type
- 6.1.1. Retail
- 6.1.2. Pension Fund
- 6.1.3. Insurance Companies
- 6.1.4. Banks
- 6.1.5. Other Client Types
- 6.2. Market Analysis, Insights and Forecast - by Asset Class
- 6.2.1. Equity
- 6.2.2. Fixed Income
- 6.2.3. Cash/Money Market
- 6.2.4. Alternative Investments
- 6.2.5. Other Asset Classes
- 6.1. Market Analysis, Insights and Forecast - by Client Type
- 7. North America US Asset Management Market Analysis, Insights and Forecast, 2020-2032
- 7.1. Market Analysis, Insights and Forecast - by Client Type
- 7.1.1. Retail
- 7.1.2. Pension Fund
- 7.1.3. Insurance Companies
- 7.1.4. Banks
- 7.1.5. Other Client Types
- 7.2. Market Analysis, Insights and Forecast - by Asset Class
- 7.2.1. Equity
- 7.2.2. Fixed Income
- 7.2.3. Cash/Money Market
- 7.2.4. Alternative Investments
- 7.2.5. Other Asset Classes
- 7.1. Market Analysis, Insights and Forecast - by Client Type
- 8. South America US Asset Management Market Analysis, Insights and Forecast, 2020-2032
- 8.1. Market Analysis, Insights and Forecast - by Client Type
- 8.1.1. Retail
- 8.1.2. Pension Fund
- 8.1.3. Insurance Companies
- 8.1.4. Banks
- 8.1.5. Other Client Types
- 8.2. Market Analysis, Insights and Forecast - by Asset Class
- 8.2.1. Equity
- 8.2.2. Fixed Income
- 8.2.3. Cash/Money Market
- 8.2.4. Alternative Investments
- 8.2.5. Other Asset Classes
- 8.1. Market Analysis, Insights and Forecast - by Client Type
- 9. Europe US Asset Management Market Analysis, Insights and Forecast, 2020-2032
- 9.1. Market Analysis, Insights and Forecast - by Client Type
- 9.1.1. Retail
- 9.1.2. Pension Fund
- 9.1.3. Insurance Companies
- 9.1.4. Banks
- 9.1.5. Other Client Types
- 9.2. Market Analysis, Insights and Forecast - by Asset Class
- 9.2.1. Equity
- 9.2.2. Fixed Income
- 9.2.3. Cash/Money Market
- 9.2.4. Alternative Investments
- 9.2.5. Other Asset Classes
- 9.1. Market Analysis, Insights and Forecast - by Client Type
- 10. Middle East & Africa US Asset Management Market Analysis, Insights and Forecast, 2020-2032
- 10.1. Market Analysis, Insights and Forecast - by Client Type
- 10.1.1. Retail
- 10.1.2. Pension Fund
- 10.1.3. Insurance Companies
- 10.1.4. Banks
- 10.1.5. Other Client Types
- 10.2. Market Analysis, Insights and Forecast - by Asset Class
- 10.2.1. Equity
- 10.2.2. Fixed Income
- 10.2.3. Cash/Money Market
- 10.2.4. Alternative Investments
- 10.2.5. Other Asset Classes
- 10.1. Market Analysis, Insights and Forecast - by Client Type
- 11. Asia Pacific US Asset Management Market Analysis, Insights and Forecast, 2020-2032
- 11.1. Market Analysis, Insights and Forecast - by Client Type
- 11.1.1. Retail
- 11.1.2. Pension Fund
- 11.1.3. Insurance Companies
- 11.1.4. Banks
- 11.1.5. Other Client Types
- 11.2. Market Analysis, Insights and Forecast - by Asset Class
- 11.2.1. Equity
- 11.2.2. Fixed Income
- 11.2.3. Cash/Money Market
- 11.2.4. Alternative Investments
- 11.2.5. Other Asset Classes
- 11.1. Market Analysis, Insights and Forecast - by Client Type
- 12. Competitive Analysis
- 12.1. Company Profiles
- 12.1.1 BlackRock
- 12.1.1.1. Company Overview
- 12.1.1.2. Products
- 12.1.1.3. Company Financials
- 12.1.1.4. SWOT Analysis
- 12.1.2 J P Morgan Asset Management
- 12.1.2.1. Company Overview
- 12.1.2.2. Products
- 12.1.2.3. Company Financials
- 12.1.2.4. SWOT Analysis
- 12.1.3 Goldman Sachs
- 12.1.3.1. Company Overview
- 12.1.3.2. Products
- 12.1.3.3. Company Financials
- 12.1.3.4. SWOT Analysis
- 12.1.4 Fidelity Investments
- 12.1.4.1. Company Overview
- 12.1.4.2. Products
- 12.1.4.3. Company Financials
- 12.1.4.4. SWOT Analysis
- 12.1.5 BNY Mellon Investment Management
- 12.1.5.1. Company Overview
- 12.1.5.2. Products
- 12.1.5.3. Company Financials
- 12.1.5.4. SWOT Analysis
- 12.1.6 The Vanguard Group
- 12.1.6.1. Company Overview
- 12.1.6.2. Products
- 12.1.6.3. Company Financials
- 12.1.6.4. SWOT Analysis
- 12.1.7 State Street Global Advisors
- 12.1.7.1. Company Overview
- 12.1.7.2. Products
- 12.1.7.3. Company Financials
- 12.1.7.4. SWOT Analysis
- 12.1.8 Pacific Investment Management Company LLC
- 12.1.8.1. Company Overview
- 12.1.8.2. Products
- 12.1.8.3. Company Financials
- 12.1.8.4. SWOT Analysis
- 12.1.9 Franklin Templeton Investments
- 12.1.9.1. Company Overview
- 12.1.9.2. Products
- 12.1.9.3. Company Financials
- 12.1.9.4. SWOT Analysis
- 12.1.10 Wellington Management Company LLC**List Not Exhaustive
- 12.1.10.1. Company Overview
- 12.1.10.2. Products
- 12.1.10.3. Company Financials
- 12.1.10.4. SWOT Analysis
- 12.1.1 BlackRock
- 12.2. Market Entropy
- 12.2.1 Company's Key Areas Served
- 12.2.2 Recent Developments
- 12.3. Company Market Share Analysis 2025
- 12.3.1 Top 5 Companies Market Share Analysis
- 12.3.2 Top 3 Companies Market Share Analysis
- 12.4. List of Potential Customers
- 13. Research Methodology
List of Figures
- Figure 1: Global US Asset Management Market Revenue Breakdown (Million, %) by Region 2025 & 2033
- Figure 2: Global US Asset Management Market Volume Breakdown (Trillion, %) by Region 2025 & 2033
- Figure 3: North America US Asset Management Market Revenue (Million), by Client Type 2025 & 2033
- Figure 4: North America US Asset Management Market Volume (Trillion), by Client Type 2025 & 2033
- Figure 5: North America US Asset Management Market Revenue Share (%), by Client Type 2025 & 2033
- Figure 6: North America US Asset Management Market Volume Share (%), by Client Type 2025 & 2033
- Figure 7: North America US Asset Management Market Revenue (Million), by Asset Class 2025 & 2033
- Figure 8: North America US Asset Management Market Volume (Trillion), by Asset Class 2025 & 2033
- Figure 9: North America US Asset Management Market Revenue Share (%), by Asset Class 2025 & 2033
- Figure 10: North America US Asset Management Market Volume Share (%), by Asset Class 2025 & 2033
- Figure 11: North America US Asset Management Market Revenue (Million), by Country 2025 & 2033
- Figure 12: North America US Asset Management Market Volume (Trillion), by Country 2025 & 2033
- Figure 13: North America US Asset Management Market Revenue Share (%), by Country 2025 & 2033
- Figure 14: North America US Asset Management Market Volume Share (%), by Country 2025 & 2033
- Figure 15: South America US Asset Management Market Revenue (Million), by Client Type 2025 & 2033
- Figure 16: South America US Asset Management Market Volume (Trillion), by Client Type 2025 & 2033
- Figure 17: South America US Asset Management Market Revenue Share (%), by Client Type 2025 & 2033
- Figure 18: South America US Asset Management Market Volume Share (%), by Client Type 2025 & 2033
- Figure 19: South America US Asset Management Market Revenue (Million), by Asset Class 2025 & 2033
- Figure 20: South America US Asset Management Market Volume (Trillion), by Asset Class 2025 & 2033
- Figure 21: South America US Asset Management Market Revenue Share (%), by Asset Class 2025 & 2033
- Figure 22: South America US Asset Management Market Volume Share (%), by Asset Class 2025 & 2033
- Figure 23: South America US Asset Management Market Revenue (Million), by Country 2025 & 2033
- Figure 24: South America US Asset Management Market Volume (Trillion), by Country 2025 & 2033
- Figure 25: South America US Asset Management Market Revenue Share (%), by Country 2025 & 2033
- Figure 26: South America US Asset Management Market Volume Share (%), by Country 2025 & 2033
- Figure 27: Europe US Asset Management Market Revenue (Million), by Client Type 2025 & 2033
- Figure 28: Europe US Asset Management Market Volume (Trillion), by Client Type 2025 & 2033
- Figure 29: Europe US Asset Management Market Revenue Share (%), by Client Type 2025 & 2033
- Figure 30: Europe US Asset Management Market Volume Share (%), by Client Type 2025 & 2033
- Figure 31: Europe US Asset Management Market Revenue (Million), by Asset Class 2025 & 2033
- Figure 32: Europe US Asset Management Market Volume (Trillion), by Asset Class 2025 & 2033
- Figure 33: Europe US Asset Management Market Revenue Share (%), by Asset Class 2025 & 2033
- Figure 34: Europe US Asset Management Market Volume Share (%), by Asset Class 2025 & 2033
- Figure 35: Europe US Asset Management Market Revenue (Million), by Country 2025 & 2033
- Figure 36: Europe US Asset Management Market Volume (Trillion), by Country 2025 & 2033
- Figure 37: Europe US Asset Management Market Revenue Share (%), by Country 2025 & 2033
- Figure 38: Europe US Asset Management Market Volume Share (%), by Country 2025 & 2033
- Figure 39: Middle East & Africa US Asset Management Market Revenue (Million), by Client Type 2025 & 2033
- Figure 40: Middle East & Africa US Asset Management Market Volume (Trillion), by Client Type 2025 & 2033
- Figure 41: Middle East & Africa US Asset Management Market Revenue Share (%), by Client Type 2025 & 2033
- Figure 42: Middle East & Africa US Asset Management Market Volume Share (%), by Client Type 2025 & 2033
- Figure 43: Middle East & Africa US Asset Management Market Revenue (Million), by Asset Class 2025 & 2033
- Figure 44: Middle East & Africa US Asset Management Market Volume (Trillion), by Asset Class 2025 & 2033
- Figure 45: Middle East & Africa US Asset Management Market Revenue Share (%), by Asset Class 2025 & 2033
- Figure 46: Middle East & Africa US Asset Management Market Volume Share (%), by Asset Class 2025 & 2033
- Figure 47: Middle East & Africa US Asset Management Market Revenue (Million), by Country 2025 & 2033
- Figure 48: Middle East & Africa US Asset Management Market Volume (Trillion), by Country 2025 & 2033
- Figure 49: Middle East & Africa US Asset Management Market Revenue Share (%), by Country 2025 & 2033
- Figure 50: Middle East & Africa US Asset Management Market Volume Share (%), by Country 2025 & 2033
- Figure 51: Asia Pacific US Asset Management Market Revenue (Million), by Client Type 2025 & 2033
- Figure 52: Asia Pacific US Asset Management Market Volume (Trillion), by Client Type 2025 & 2033
- Figure 53: Asia Pacific US Asset Management Market Revenue Share (%), by Client Type 2025 & 2033
- Figure 54: Asia Pacific US Asset Management Market Volume Share (%), by Client Type 2025 & 2033
- Figure 55: Asia Pacific US Asset Management Market Revenue (Million), by Asset Class 2025 & 2033
- Figure 56: Asia Pacific US Asset Management Market Volume (Trillion), by Asset Class 2025 & 2033
- Figure 57: Asia Pacific US Asset Management Market Revenue Share (%), by Asset Class 2025 & 2033
- Figure 58: Asia Pacific US Asset Management Market Volume Share (%), by Asset Class 2025 & 2033
- Figure 59: Asia Pacific US Asset Management Market Revenue (Million), by Country 2025 & 2033
- Figure 60: Asia Pacific US Asset Management Market Volume (Trillion), by Country 2025 & 2033
- Figure 61: Asia Pacific US Asset Management Market Revenue Share (%), by Country 2025 & 2033
- Figure 62: Asia Pacific US Asset Management Market Volume Share (%), by Country 2025 & 2033
List of Tables
- Table 1: Global US Asset Management Market Revenue Million Forecast, by Client Type 2020 & 2033
- Table 2: Global US Asset Management Market Volume Trillion Forecast, by Client Type 2020 & 2033
- Table 3: Global US Asset Management Market Revenue Million Forecast, by Asset Class 2020 & 2033
- Table 4: Global US Asset Management Market Volume Trillion Forecast, by Asset Class 2020 & 2033
- Table 5: Global US Asset Management Market Revenue Million Forecast, by Region 2020 & 2033
- Table 6: Global US Asset Management Market Volume Trillion Forecast, by Region 2020 & 2033
- Table 7: Global US Asset Management Market Revenue Million Forecast, by Client Type 2020 & 2033
- Table 8: Global US Asset Management Market Volume Trillion Forecast, by Client Type 2020 & 2033
- Table 9: Global US Asset Management Market Revenue Million Forecast, by Asset Class 2020 & 2033
- Table 10: Global US Asset Management Market Volume Trillion Forecast, by Asset Class 2020 & 2033
- Table 11: Global US Asset Management Market Revenue Million Forecast, by Country 2020 & 2033
- Table 12: Global US Asset Management Market Volume Trillion Forecast, by Country 2020 & 2033
- Table 13: United States US Asset Management Market Revenue (Million) Forecast, by Application 2020 & 2033
- Table 14: United States US Asset Management Market Volume (Trillion) Forecast, by Application 2020 & 2033
- Table 15: Canada US Asset Management Market Revenue (Million) Forecast, by Application 2020 & 2033
- Table 16: Canada US Asset Management Market Volume (Trillion) Forecast, by Application 2020 & 2033
- Table 17: Mexico US Asset Management Market Revenue (Million) Forecast, by Application 2020 & 2033
- Table 18: Mexico US Asset Management Market Volume (Trillion) Forecast, by Application 2020 & 2033
- Table 19: Global US Asset Management Market Revenue Million Forecast, by Client Type 2020 & 2033
- Table 20: Global US Asset Management Market Volume Trillion Forecast, by Client Type 2020 & 2033
- Table 21: Global US Asset Management Market Revenue Million Forecast, by Asset Class 2020 & 2033
- Table 22: Global US Asset Management Market Volume Trillion Forecast, by Asset Class 2020 & 2033
- Table 23: Global US Asset Management Market Revenue Million Forecast, by Country 2020 & 2033
- Table 24: Global US Asset Management Market Volume Trillion Forecast, by Country 2020 & 2033
- Table 25: Brazil US Asset Management Market Revenue (Million) Forecast, by Application 2020 & 2033
- Table 26: Brazil US Asset Management Market Volume (Trillion) Forecast, by Application 2020 & 2033
- Table 27: Argentina US Asset Management Market Revenue (Million) Forecast, by Application 2020 & 2033
- Table 28: Argentina US Asset Management Market Volume (Trillion) Forecast, by Application 2020 & 2033
- Table 29: Rest of South America US Asset Management Market Revenue (Million) Forecast, by Application 2020 & 2033
- Table 30: Rest of South America US Asset Management Market Volume (Trillion) Forecast, by Application 2020 & 2033
- Table 31: Global US Asset Management Market Revenue Million Forecast, by Client Type 2020 & 2033
- Table 32: Global US Asset Management Market Volume Trillion Forecast, by Client Type 2020 & 2033
- Table 33: Global US Asset Management Market Revenue Million Forecast, by Asset Class 2020 & 2033
- Table 34: Global US Asset Management Market Volume Trillion Forecast, by Asset Class 2020 & 2033
- Table 35: Global US Asset Management Market Revenue Million Forecast, by Country 2020 & 2033
- Table 36: Global US Asset Management Market Volume Trillion Forecast, by Country 2020 & 2033
- Table 37: United Kingdom US Asset Management Market Revenue (Million) Forecast, by Application 2020 & 2033
- Table 38: United Kingdom US Asset Management Market Volume (Trillion) Forecast, by Application 2020 & 2033
- Table 39: Germany US Asset Management Market Revenue (Million) Forecast, by Application 2020 & 2033
- Table 40: Germany US Asset Management Market Volume (Trillion) Forecast, by Application 2020 & 2033
- Table 41: France US Asset Management Market Revenue (Million) Forecast, by Application 2020 & 2033
- Table 42: France US Asset Management Market Volume (Trillion) Forecast, by Application 2020 & 2033
- Table 43: Italy US Asset Management Market Revenue (Million) Forecast, by Application 2020 & 2033
- Table 44: Italy US Asset Management Market Volume (Trillion) Forecast, by Application 2020 & 2033
- Table 45: Spain US Asset Management Market Revenue (Million) Forecast, by Application 2020 & 2033
- Table 46: Spain US Asset Management Market Volume (Trillion) Forecast, by Application 2020 & 2033
- Table 47: Russia US Asset Management Market Revenue (Million) Forecast, by Application 2020 & 2033
- Table 48: Russia US Asset Management Market Volume (Trillion) Forecast, by Application 2020 & 2033
- Table 49: Benelux US Asset Management Market Revenue (Million) Forecast, by Application 2020 & 2033
- Table 50: Benelux US Asset Management Market Volume (Trillion) Forecast, by Application 2020 & 2033
- Table 51: Nordics US Asset Management Market Revenue (Million) Forecast, by Application 2020 & 2033
- Table 52: Nordics US Asset Management Market Volume (Trillion) Forecast, by Application 2020 & 2033
- Table 53: Rest of Europe US Asset Management Market Revenue (Million) Forecast, by Application 2020 & 2033
- Table 54: Rest of Europe US Asset Management Market Volume (Trillion) Forecast, by Application 2020 & 2033
- Table 55: Global US Asset Management Market Revenue Million Forecast, by Client Type 2020 & 2033
- Table 56: Global US Asset Management Market Volume Trillion Forecast, by Client Type 2020 & 2033
- Table 57: Global US Asset Management Market Revenue Million Forecast, by Asset Class 2020 & 2033
- Table 58: Global US Asset Management Market Volume Trillion Forecast, by Asset Class 2020 & 2033
- Table 59: Global US Asset Management Market Revenue Million Forecast, by Country 2020 & 2033
- Table 60: Global US Asset Management Market Volume Trillion Forecast, by Country 2020 & 2033
- Table 61: Turkey US Asset Management Market Revenue (Million) Forecast, by Application 2020 & 2033
- Table 62: Turkey US Asset Management Market Volume (Trillion) Forecast, by Application 2020 & 2033
- Table 63: Israel US Asset Management Market Revenue (Million) Forecast, by Application 2020 & 2033
- Table 64: Israel US Asset Management Market Volume (Trillion) Forecast, by Application 2020 & 2033
- Table 65: GCC US Asset Management Market Revenue (Million) Forecast, by Application 2020 & 2033
- Table 66: GCC US Asset Management Market Volume (Trillion) Forecast, by Application 2020 & 2033
- Table 67: North Africa US Asset Management Market Revenue (Million) Forecast, by Application 2020 & 2033
- Table 68: North Africa US Asset Management Market Volume (Trillion) Forecast, by Application 2020 & 2033
- Table 69: South Africa US Asset Management Market Revenue (Million) Forecast, by Application 2020 & 2033
- Table 70: South Africa US Asset Management Market Volume (Trillion) Forecast, by Application 2020 & 2033
- Table 71: Rest of Middle East & Africa US Asset Management Market Revenue (Million) Forecast, by Application 2020 & 2033
- Table 72: Rest of Middle East & Africa US Asset Management Market Volume (Trillion) Forecast, by Application 2020 & 2033
- Table 73: Global US Asset Management Market Revenue Million Forecast, by Client Type 2020 & 2033
- Table 74: Global US Asset Management Market Volume Trillion Forecast, by Client Type 2020 & 2033
- Table 75: Global US Asset Management Market Revenue Million Forecast, by Asset Class 2020 & 2033
- Table 76: Global US Asset Management Market Volume Trillion Forecast, by Asset Class 2020 & 2033
- Table 77: Global US Asset Management Market Revenue Million Forecast, by Country 2020 & 2033
- Table 78: Global US Asset Management Market Volume Trillion Forecast, by Country 2020 & 2033
- Table 79: China US Asset Management Market Revenue (Million) Forecast, by Application 2020 & 2033
- Table 80: China US Asset Management Market Volume (Trillion) Forecast, by Application 2020 & 2033
- Table 81: India US Asset Management Market Revenue (Million) Forecast, by Application 2020 & 2033
- Table 82: India US Asset Management Market Volume (Trillion) Forecast, by Application 2020 & 2033
- Table 83: Japan US Asset Management Market Revenue (Million) Forecast, by Application 2020 & 2033
- Table 84: Japan US Asset Management Market Volume (Trillion) Forecast, by Application 2020 & 2033
- Table 85: South Korea US Asset Management Market Revenue (Million) Forecast, by Application 2020 & 2033
- Table 86: South Korea US Asset Management Market Volume (Trillion) Forecast, by Application 2020 & 2033
- Table 87: ASEAN US Asset Management Market Revenue (Million) Forecast, by Application 2020 & 2033
- Table 88: ASEAN US Asset Management Market Volume (Trillion) Forecast, by Application 2020 & 2033
- Table 89: Oceania US Asset Management Market Revenue (Million) Forecast, by Application 2020 & 2033
- Table 90: Oceania US Asset Management Market Volume (Trillion) Forecast, by Application 2020 & 2033
- Table 91: Rest of Asia Pacific US Asset Management Market Revenue (Million) Forecast, by Application 2020 & 2033
- Table 92: Rest of Asia Pacific US Asset Management Market Volume (Trillion) Forecast, by Application 2020 & 2033
Frequently Asked Questions
1. What is the projected Compound Annual Growth Rate (CAGR) of the US Asset Management Market?
The projected CAGR is approximately 18.67%.
2. Which companies are prominent players in the US Asset Management Market?
Key companies in the market include BlackRock, J P Morgan Asset Management, Goldman Sachs, Fidelity Investments, BNY Mellon Investment Management, The Vanguard Group, State Street Global Advisors, Pacific Investment Management Company LLC, Franklin Templeton Investments, Wellington Management Company LLC**List Not Exhaustive.
3. What are the main segments of the US Asset Management Market?
The market segments include Client Type, Asset Class.
4. Can you provide details about the market size?
The market size is estimated to be USD 48.22 Million as of 2022.
5. What are some drivers contributing to market growth?
Rapid Growth in Advanced Technologies such as AI. IoT. Etc.. ; Increase in Wealth of HNI's is Driving the Market.
6. What are the notable trends driving market growth?
US Portfolio Management Systems Market Set for Robust Growth.
7. Are there any restraints impacting market growth?
Rapid Growth in Advanced Technologies such as AI. IoT. Etc.. ; Increase in Wealth of HNI's is Driving the Market.
8. Can you provide examples of recent developments in the market?
In August 2023, BlackRock Inc., a prominent international credit asset manager, acquired Kreos. Kreos, renowned for its specialization in growth and risk-based financing for technology and healthcare enterprises, enhances BlackRock's market presence. This acquisition aligns with BlackRock's strategic objective of broadening its private-market investment portfolio.
9. What pricing options are available for accessing the report?
Pricing options include single-user, multi-user, and enterprise licenses priced at USD 3800, USD 4500, and USD 5800 respectively.
10. Is the market size provided in terms of value or volume?
The market size is provided in terms of value, measured in Million and volume, measured in Trillion.
11. Are there any specific market keywords associated with the report?
Yes, the market keyword associated with the report is "US Asset Management Market," which aids in identifying and referencing the specific market segment covered.
12. How do I determine which pricing option suits my needs best?
The pricing options vary based on user requirements and access needs. Individual users may opt for single-user licenses, while businesses requiring broader access may choose multi-user or enterprise licenses for cost-effective access to the report.
13. Are there any additional resources or data provided in the US Asset Management Market report?
While the report offers comprehensive insights, it's advisable to review the specific contents or supplementary materials provided to ascertain if additional resources or data are available.
14. How can I stay updated on further developments or reports in the US Asset Management Market?
To stay informed about further developments, trends, and reports in the US Asset Management Market, consider subscribing to industry newsletters, following relevant companies and organizations, or regularly checking reputable industry news sources and publications.
Methodology
Step 1 - Identification of Relevant Samples Size from Population Database


Step 2 - Approaches for Defining Global Market Size (Value, Volume* & Price*)

Note*: In applicable scenarios
Step 3 - Data Sources
Primary Research
- Web Analytics
- Survey Reports
- Research Institute
- Latest Research Reports
- Opinion Leaders
Secondary Research
- Annual Reports
- White Paper
- Latest Press Release
- Industry Association
- Paid Database
- Investor Presentations

Step 4 - Data Triangulation
Involves using different sources of information in order to increase the validity of a study
These sources are likely to be stakeholders in a program - participants, other researchers, program staff, other community members, and so on.
Then we put all data in single framework & apply various statistical tools to find out the dynamic on the market.
During the analysis stage, feedback from the stakeholder groups would be compared to determine areas of agreement as well as areas of divergence