

Key Insights
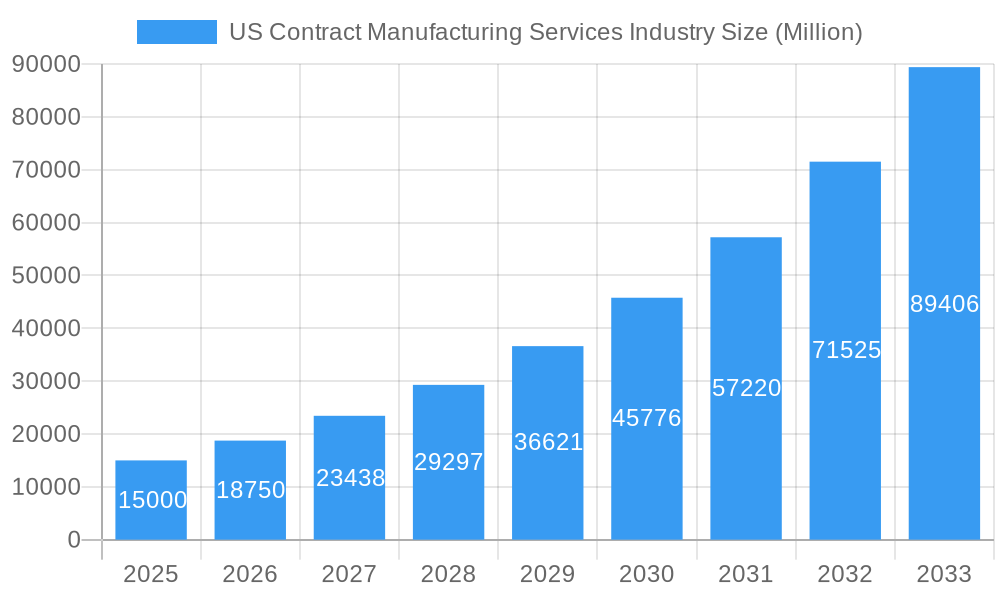
The US contract manufacturing services (CMS) industry is experiencing robust growth, fueled by increasing demand for outsourced manufacturing and a rising focus on core competencies among brand owners. With a projected Compound Annual Growth Rate (CAGR) of 25.10% from 2025-2033, the market is poised for significant expansion. This growth is driven by several factors, including the rising complexity of product development, the need for greater manufacturing flexibility to adapt to changing consumer demands, and the cost advantages associated with outsourcing non-core business functions. The industry caters to diverse sectors, including food and beverage, cosmetics, pharmaceuticals, and others, each contributing to the overall market expansion. Key players like Catalent, Lonza, and Jublilant are leveraging their expertise and scale to capture market share. However, challenges such as maintaining consistent quality across various manufacturers, managing supply chain complexities, and navigating regulatory hurdles remain crucial considerations for both CMS providers and their clients. The competitive landscape is dynamic, characterized by both large multinational corporations and smaller, specialized firms, each offering unique strengths and capabilities. The fragmentation of the market presents opportunities for strategic acquisitions and partnerships, driving further consolidation within the industry.

US Contract Manufacturing Services Industry Market Size (In Billion)
The forecast period (2025-2033) anticipates continued strong growth, driven by increasing investments in automation and technological advancements within the CMS sector. This technological adoption enhances efficiency, precision, and scalability, further benefiting both CMS providers and their clients. The ongoing trend of personalized products and smaller batch sizes will necessitate a flexible and adaptable manufacturing system, an area where CMS providers are well-positioned to excel. Furthermore, a growing emphasis on sustainable and ethical manufacturing practices presents both opportunities and challenges, as companies strive to meet evolving consumer expectations and environmental regulations. Effective risk management and robust quality control systems will be critical in maintaining trust and securing long-term contracts in this competitive and ever-evolving market. The long-term outlook remains positive, suggesting substantial potential for growth and innovation within the US contract manufacturing services landscape.
US Contract Manufacturing Services Industry Company Market Share
US Contract Manufacturing Services Industry Report: 2019-2033
This comprehensive report provides a detailed analysis of the US Contract Manufacturing Services industry, offering invaluable insights for industry professionals, investors, and strategic decision-makers. Covering the period from 2019 to 2033, with a base year of 2025 and a forecast period of 2025-2033, this report leverages extensive market research and data analysis to present a clear and actionable understanding of this dynamic sector. The US Contract Manufacturing Services market is projected to reach xx Million by 2033, exhibiting a CAGR of xx% during the forecast period.
US Contract Manufacturing Services Industry Market Structure & Innovation Trends
The US Contract Manufacturing Services industry exhibits a moderately concentrated market structure, with several large players holding significant market share. Catalent Inc, Lonza Group, and Jubliant are among the key players, each commanding a substantial portion (estimated at xx%, xx%, and xx%, respectively) of the overall market. However, a significant number of smaller, specialized contract manufacturers also contribute to the market's vibrancy. Innovation is driven by advancements in technology, particularly in areas such as automation, digitalization, and sustainable manufacturing practices. Stringent regulatory frameworks, particularly within the pharmaceutical and food & beverage sectors, heavily influence operations. Product substitutes, though limited in some segments, exist in the form of in-house manufacturing for larger companies. The end-user demographics span diverse industries including pharmaceuticals, food & beverage, cosmetics, and consumer goods. M&A activity within the sector has been notable, with deal values exceeding xx Million in recent years, reflecting a trend towards consolidation and expansion.
- Market Concentration: Moderately concentrated, with top 3 players holding xx% combined market share.
- Innovation Drivers: Technological advancements (automation, digitalization, sustainability), regulatory pressures.
- Regulatory Frameworks: Stringent regulations in pharmaceuticals and food & beverage.
- M&A Activity: Significant activity with deal values exceeding xx Million in recent years.
US Contract Manufacturing Services Industry Market Dynamics & Trends
The US Contract Manufacturing Services market is demonstrating significant and sustained growth, fueled by a confluence of strategic business decisions and evolving industry landscapes. A primary catalyst remains the increasing propensity for companies across diverse sectors to outsource their manufacturing operations. This trend is largely driven by a strategic imperative to achieve optimized cost structures, enhance operational efficiencies, and gain access to specialized expertise and advanced technologies that may not be available in-house. Furthermore, the relentless pace of technological disruption is profoundly reshaping the industry. The integration of cutting-edge manufacturing technologies, including artificial intelligence (AI) for predictive maintenance and process optimization, advanced robotics for enhanced precision and speed, and the Internet of Things (IoT) for real-time data monitoring and analysis, is fundamentally elevating productivity levels and elevating the standard of product quality. Concurrently, dynamic shifts in consumer preferences are exerting a considerable influence on the market. The burgeoning demand for highly customized products, tailored to individual needs and specifications, alongside a growing emphasis on sustainable manufacturing practices and environmentally responsible production, are compelling contract manufacturers to innovate and adapt their offerings. The competitive terrain within the US contract manufacturing sector is characterized by a high degree of intensity, with prominent players often engaging in fierce competition. This dynamic environment can lead to significant price pressures but also serves as a powerful impetus for continuous innovation and differentiation. The adoption rate of advanced manufacturing technologies, while generally on the rise, exhibits notable variation across different industry segments. For instance, the pharmaceutical manufacturing sector typically demonstrates a higher penetration of sophisticated technologies compared to some other segments, reflecting the unique demands and regulatory requirements of that industry. Looking ahead, the market is anticipated to maintain a robust and steady growth trajectory. Projections indicate a Compound Annual Growth Rate (CAGR) of approximately [Insert specific XX% here, or a range if preferred] from 2025 to 2033, underscoring the sector's long-term viability and expansion potential.
Dominant Regions & Segments in US Contract Manufacturing Services Industry
The dominant region within the US Contract Manufacturing Services industry is the [Insert Dominant Region, e.g., Northeast], driven by a combination of factors.
- Key Drivers (Northeast Region, Example):
- High concentration of pharmaceutical and biotech companies.
- Well-developed infrastructure and logistics networks.
- Access to skilled labor.
- Supportive government policies.
The dominance of this region is a result of its established manufacturing infrastructure, robust supply chains, and concentration of major end-user industries. Other regions, such as the South and West, are also witnessing significant growth, although at a slower pace compared to the [Insert Dominant Region]. Similarly, the pharmaceutical and food & beverage segments dominate the market, reflecting high outsourcing rates in these sectors.
US Contract Manufacturing Services Industry Product Innovations
Product innovations within the US Contract Manufacturing Services industry are predominantly focused on achieving multifaceted improvements, including bolstering operational efficiency, driving down production costs, and elevating the overall quality and performance of manufactured goods. A significant area of advancement lies in the realm of automation, with particular emphasis on the integration of sophisticated robotics and AI-powered systems. These technologies are instrumental in optimizing complex production processes, from assembly and quality control to material handling, leading to increased throughput and reduced human error. The widespread adoption of Industry 4.0 principles is a transformative force, fostering a data-centric approach to manufacturing. This enables enhanced decision-making through real-time data analytics, predictive modeling, and intelligent automation, thereby significantly improving supply chain visibility, resilience, and management. These innovations collectively contribute to a superior market fit by enabling contract manufacturers to deliver products of higher quality, accelerate turnaround times for product development and delivery, and provide more cost-effective solutions to their clients. Ultimately, these advancements are crucial for clients to enhance their own market competitiveness and respond effectively to evolving market demands.
Report Scope & Segmentation Analysis
This report segments the US Contract Manufacturing Services market across various parameters. By Service Type: This includes pharmaceutical, food & beverage, cosmetics, and other segments, each displaying unique growth dynamics and competitive landscapes. By Manufacturing Process: This segment differentiates between different production processes impacting costs and scalability. By Geography: Regional variations are analyzed based on factors such as manufacturing hubs, market demand, and regulatory frameworks. Each segment offers distinct market size projections and growth forecasts for the forecast period.
Key Drivers of US Contract Manufacturing Services Industry Growth
The sustained and robust growth of the US Contract Manufacturing Services industry is propelled by a synergistic interplay of several critical factors. A primary and enduring driver is the increasing strategic decision of companies across a broad spectrum of industries to outsource their manufacturing operations. This outsourcing strategy is predominantly motivated by the pursuit of significant cost efficiencies, which can be achieved through economies of scale and specialized operational expertise offered by contract manufacturers. Furthermore, it grants companies access to specialized skills, advanced technologies, and state-of-the-art facilities that might be prohibitively expensive or impractical to develop in-house. The escalating demand for highly customized products, requiring intricate designs and specific functionalities, necessitates the agility and specialized capabilities that contract manufacturers are well-equipped to provide. Coupled with this is the imperative for faster time-to-market, as companies strive to introduce innovative products and respond swiftly to dynamic market trends. Technological advancements, particularly in automation, digital manufacturing, and advanced materials, are continuously enhancing productivity, improving product quality, and enabling more complex manufacturing processes. Moreover, supportive government initiatives aimed at promoting domestic manufacturing, bolstering supply chain resilience, and encouraging technological adoption are providing a favorable environment and further stimulating growth within the sector.
Challenges in the US Contract Manufacturing Services Industry Sector
Despite its robust growth, the US Contract Manufacturing Services industry confronts a number of significant challenges that can impact its operational fluidity and profitability. Stringent and ever-evolving regulatory compliance requirements, particularly in highly regulated sectors like pharmaceuticals and medical devices, impose substantial operational burdens and necessitate continuous investment in quality management systems. Fluctuating raw material costs, driven by global supply and demand dynamics, geopolitical events, and commodity price volatility, present a constant challenge for cost management and pricing strategies. Disruptions within global supply chains, exacerbated by factors such as trade disputes, natural disasters, and public health crises, can lead to delays, increased costs, and difficulties in sourcing critical components. Global economic uncertainties and potential recessions can also dampen demand from client industries. Furthermore, the industry is characterized by intense competition, with numerous players vying for market share. This often translates into significant price pressures, making it challenging for manufacturers to maintain healthy profit margins, especially for commoditized services. Navigating these multifaceted challenges requires strategic planning, operational agility, and a strong focus on risk mitigation.
Emerging Opportunities in US Contract Manufacturing Services Industry
Emerging opportunities exist within the industry. The increasing demand for sustainable and environmentally friendly manufacturing practices is creating new avenues for growth. The adoption of advanced technologies like AI and robotics is opening up potential for improved efficiency and customized products. Expanding into niche markets and catering to specific customer requirements offers further avenues for growth and differentiation.
Leading Players in the US Contract Manufacturing Services Industry Market
- Catalent Inc
- Jubilant
- Lonza Group
- Aenova Group
- Amerilab Technologies Inc
- Bernet Food & Beverage
- Big Brands LLC
- Delamaine Fine Foods Limited
- Brooklyn Bottling
- CSD Co-Packers
- Southeast Bottling & Beverages
- G3 Enterprises
- Western Innovations
- Niagara Bottling and Robinsons Breweries
- KIK Custom Products
- Sensible Organics
- Colep
- Cosmetic Essence LLC
- Formula Cap
Key Developments in US Contract Manufacturing Services Industry
- July 2021: Catalent Inc launched GPEx lightning, a next-generation cell lighting technology, shortening drug development timelines by three months.
- May 2022: Lonza and Israel Biotech Fund collaborated on a framework agreement to support biologics and small molecule development and manufacturing, facilitating Lonza's access to the Israeli market.
Future Outlook for US Contract Manufacturing Services Industry Market
The future trajectory of the US Contract Manufacturing Services industry is decidedly optimistic, projecting continued and potentially accelerated growth. This positive outlook is underpinned by several powerful, reinforcing trends. Ongoing and rapid technological advancements, including the expanding applications of AI, advanced automation, additive manufacturing (3D printing), and digital twin technologies, will continue to redefine production capabilities, drive efficiency gains, and enable the manufacturing of increasingly complex and customized products. The persistent trend of outsourcing by companies seeking to leverage specialized expertise, optimize costs, and focus on core competencies will remain a significant demand driver. The burgeoning demand for highly specialized manufacturing services, particularly in high-growth sectors like advanced electronics, biotechnology, and sustainable energy solutions, will create new opportunities. Strategic partnerships and collaborations between contract manufacturers and their clients, as well as amongst manufacturers themselves, will become increasingly vital for innovation and market expansion. Significant investments in research and development, coupled with the adoption of cutting-edge technologies, will be critical success factors for companies aiming to stay ahead of the competitive curve. Furthermore, the industry's future will be increasingly shaped by a strong emphasis on sustainability, including the adoption of green manufacturing processes, ethical sourcing, and circular economy principles, as well as an unwavering focus on delivering highly tailored and customized solutions to meet the diverse and evolving needs of clients.
US Contract Manufacturing Services Industry Segmentation
-
1. pharmaceutical
- 1.1. Current Market Scenario and growth influencers
- 1.2. Market B
-
1.3. Active P
- 1.3.1. Small molecule
- 1.3.2. Large Molecule
- 1.3.3. High Potency API (HPAPI)
-
1.4. Finished
- 1.4.1. Solid Dose Formulation
- 1.4.2. Liquid Dose Formulation
- 1.4.3. Injectable Dose Formulation
- 1.5. Secondary Packaging
-
2. Food processing & manufacturing
- 2.1. Market Breakdown - by Service Type
- 2.2. Current Market Scenario and growth influencers
-
2.3. Food Manufacturing Services
- 2.3.1. Convenience Foods
- 2.3.2. Bakery Products
- 2.3.3. Confectionary Products
- 2.3.4. Dairy Products
- 2.3.5. Research & Development
- 2.3.6. Food Packaging Services
-
3. Beverage
- 3.1. Current Market Scenario and growth influencers
-
3.2. Market B
- 3.2.1. Beer
- 3.2.2. Carbonated Drinks & Fruit-based Beverages
- 3.2.3. Bottled Water
- 3.2.4. Others (Sport Drinks)
-
4. Personal Care
- 4.1. Current Market Scenario and growth influencers
-
4.2. Market Breakdown - by Type
- 4.2.1. Skin Care
- 4.2.2. Hair Care
- 4.2.3. Make up & Color Cosmetics
- 4.2.4. Others
US Contract Manufacturing Services Industry Segmentation By Geography
-
1. North America
- 1.1. United States
- 1.2. Canada
- 1.3. Mexico
-
2. South America
- 2.1. Brazil
- 2.2. Argentina
- 2.3. Rest of South America
-
3. Europe
- 3.1. United Kingdom
- 3.2. Germany
- 3.3. France
- 3.4. Italy
- 3.5. Spain
- 3.6. Russia
- 3.7. Benelux
- 3.8. Nordics
- 3.9. Rest of Europe
-
4. Middle East & Africa
- 4.1. Turkey
- 4.2. Israel
- 4.3. GCC
- 4.4. North Africa
- 4.5. South Africa
- 4.6. Rest of Middle East & Africa
-
5. Asia Pacific
- 5.1. China
- 5.2. India
- 5.3. Japan
- 5.4. South Korea
- 5.5. ASEAN
- 5.6. Oceania
- 5.7. Rest of Asia Pacific
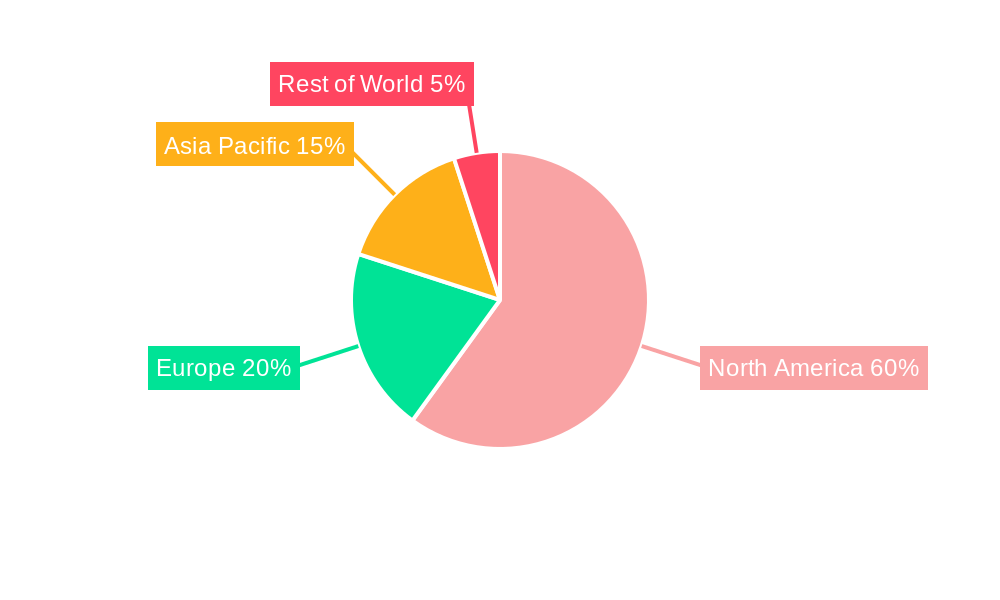
US Contract Manufacturing Services Industry Regional Market Share
Geographic Coverage of US Contract Manufacturing Services Industry
US Contract Manufacturing Services Industry REPORT HIGHLIGHTS
| Aspects | Details |
|---|---|
| Study Period | 2020-2034 |
| Base Year | 2025 |
| Estimated Year | 2026 |
| Forecast Period | 2026-2034 |
| Historical Period | 2020-2025 |
| Growth Rate | CAGR of 6.8% from 2020-2034 |
| Segmentation |
|
Table of Contents
- 1. Introduction
- 1.1. Research Scope
- 1.2. Market Segmentation
- 1.3. Research Objective
- 1.4. Definitions and Assumptions
- 2. Executive Summary
- 2.1. Market Snapshot
- 3. Market Dynamics
- 3.1. Market Drivers
- 3.2. Market Restrains
- 3.3. Market Trends
- 3.4. Market Opportunities
- 4. Market Factor Analysis
- 4.1. Porters Five Forces
- 4.1.1. Bargaining Power of Suppliers
- 4.1.2. Bargaining Power of Buyers
- 4.1.3. Threat of New Entrants
- 4.1.4. Threat of Substitutes
- 4.1.5. Competitive Rivalry
- 4.2. PESTEL analysis
- 4.3. BCG Analysis
- 4.3.1. Stars (High Growth, High Market Share)
- 4.3.2. Cash Cows (Low Growth, High Market Share)
- 4.3.3. Question Mark (High Growth, Low Market Share)
- 4.3.4. Dogs (Low Growth, Low Market Share)
- 4.4. Ansoff Matrix Analysis
- 4.5. Supply Chain Analysis
- 4.6. Regulatory Landscape
- 4.7. Current Market Potential and Opportunity Assessment (TAM–SAM–SOM Framework)
- 4.8. PRI Analyst Note
- 4.1. Porters Five Forces
- 5. Market Analysis, Insights and Forecast 2021-2033
- 5.1. Market Analysis, Insights and Forecast - by pharmaceutical
- 5.1.1. Current Market Scenario and growth influencers
- 5.1.2. Market B
- 5.1.3. Active P
- 5.1.3.1. Small molecule
- 5.1.3.2. Large Molecule
- 5.1.3.3. High Potency API (HPAPI)
- 5.1.4. Finished
- 5.1.4.1. Solid Dose Formulation
- 5.1.4.2. Liquid Dose Formulation
- 5.1.4.3. Injectable Dose Formulation
- 5.1.5. Secondary Packaging
- 5.2. Market Analysis, Insights and Forecast - by Food processing & manufacturing
- 5.2.1. Market Breakdown - by Service Type
- 5.2.2. Current Market Scenario and growth influencers
- 5.2.3. Food Manufacturing Services
- 5.2.3.1. Convenience Foods
- 5.2.3.2. Bakery Products
- 5.2.3.3. Confectionary Products
- 5.2.3.4. Dairy Products
- 5.2.3.5. Research & Development
- 5.2.3.6. Food Packaging Services
- 5.3. Market Analysis, Insights and Forecast - by Beverage
- 5.3.1. Current Market Scenario and growth influencers
- 5.3.2. Market B
- 5.3.2.1. Beer
- 5.3.2.2. Carbonated Drinks & Fruit-based Beverages
- 5.3.2.3. Bottled Water
- 5.3.2.4. Others (Sport Drinks)
- 5.4. Market Analysis, Insights and Forecast - by Personal Care
- 5.4.1. Current Market Scenario and growth influencers
- 5.4.2. Market Breakdown - by Type
- 5.4.2.1. Skin Care
- 5.4.2.2. Hair Care
- 5.4.2.3. Make up & Color Cosmetics
- 5.4.2.4. Others
- 5.5. Market Analysis, Insights and Forecast - by Region
- 5.5.1. North America
- 5.5.2. South America
- 5.5.3. Europe
- 5.5.4. Middle East & Africa
- 5.5.5. Asia Pacific
- 5.1. Market Analysis, Insights and Forecast - by pharmaceutical
- 6. Global US Contract Manufacturing Services Industry Analysis, Insights and Forecast, 2021-2033
- 6.1. Market Analysis, Insights and Forecast - by pharmaceutical
- 6.1.1. Current Market Scenario and growth influencers
- 6.1.2. Market B
- 6.1.3. Active P
- 6.1.3.1. Small molecule
- 6.1.3.2. Large Molecule
- 6.1.3.3. High Potency API (HPAPI)
- 6.1.4. Finished
- 6.1.4.1. Solid Dose Formulation
- 6.1.4.2. Liquid Dose Formulation
- 6.1.4.3. Injectable Dose Formulation
- 6.1.5. Secondary Packaging
- 6.2. Market Analysis, Insights and Forecast - by Food processing & manufacturing
- 6.2.1. Market Breakdown - by Service Type
- 6.2.2. Current Market Scenario and growth influencers
- 6.2.3. Food Manufacturing Services
- 6.2.3.1. Convenience Foods
- 6.2.3.2. Bakery Products
- 6.2.3.3. Confectionary Products
- 6.2.3.4. Dairy Products
- 6.2.3.5. Research & Development
- 6.2.3.6. Food Packaging Services
- 6.3. Market Analysis, Insights and Forecast - by Beverage
- 6.3.1. Current Market Scenario and growth influencers
- 6.3.2. Market B
- 6.3.2.1. Beer
- 6.3.2.2. Carbonated Drinks & Fruit-based Beverages
- 6.3.2.3. Bottled Water
- 6.3.2.4. Others (Sport Drinks)
- 6.4. Market Analysis, Insights and Forecast - by Personal Care
- 6.4.1. Current Market Scenario and growth influencers
- 6.4.2. Market Breakdown - by Type
- 6.4.2.1. Skin Care
- 6.4.2.2. Hair Care
- 6.4.2.3. Make up & Color Cosmetics
- 6.4.2.4. Others
- 6.1. Market Analysis, Insights and Forecast - by pharmaceutical
- 7. North America US Contract Manufacturing Services Industry Analysis, Insights and Forecast, 2020-2032
- 7.1. Market Analysis, Insights and Forecast - by pharmaceutical
- 7.1.1. Current Market Scenario and growth influencers
- 7.1.2. Market B
- 7.1.3. Active P
- 7.1.3.1. Small molecule
- 7.1.3.2. Large Molecule
- 7.1.3.3. High Potency API (HPAPI)
- 7.1.4. Finished
- 7.1.4.1. Solid Dose Formulation
- 7.1.4.2. Liquid Dose Formulation
- 7.1.4.3. Injectable Dose Formulation
- 7.1.5. Secondary Packaging
- 7.2. Market Analysis, Insights and Forecast - by Food processing & manufacturing
- 7.2.1. Market Breakdown - by Service Type
- 7.2.2. Current Market Scenario and growth influencers
- 7.2.3. Food Manufacturing Services
- 7.2.3.1. Convenience Foods
- 7.2.3.2. Bakery Products
- 7.2.3.3. Confectionary Products
- 7.2.3.4. Dairy Products
- 7.2.3.5. Research & Development
- 7.2.3.6. Food Packaging Services
- 7.3. Market Analysis, Insights and Forecast - by Beverage
- 7.3.1. Current Market Scenario and growth influencers
- 7.3.2. Market B
- 7.3.2.1. Beer
- 7.3.2.2. Carbonated Drinks & Fruit-based Beverages
- 7.3.2.3. Bottled Water
- 7.3.2.4. Others (Sport Drinks)
- 7.4. Market Analysis, Insights and Forecast - by Personal Care
- 7.4.1. Current Market Scenario and growth influencers
- 7.4.2. Market Breakdown - by Type
- 7.4.2.1. Skin Care
- 7.4.2.2. Hair Care
- 7.4.2.3. Make up & Color Cosmetics
- 7.4.2.4. Others
- 7.1. Market Analysis, Insights and Forecast - by pharmaceutical
- 8. South America US Contract Manufacturing Services Industry Analysis, Insights and Forecast, 2020-2032
- 8.1. Market Analysis, Insights and Forecast - by pharmaceutical
- 8.1.1. Current Market Scenario and growth influencers
- 8.1.2. Market B
- 8.1.3. Active P
- 8.1.3.1. Small molecule
- 8.1.3.2. Large Molecule
- 8.1.3.3. High Potency API (HPAPI)
- 8.1.4. Finished
- 8.1.4.1. Solid Dose Formulation
- 8.1.4.2. Liquid Dose Formulation
- 8.1.4.3. Injectable Dose Formulation
- 8.1.5. Secondary Packaging
- 8.2. Market Analysis, Insights and Forecast - by Food processing & manufacturing
- 8.2.1. Market Breakdown - by Service Type
- 8.2.2. Current Market Scenario and growth influencers
- 8.2.3. Food Manufacturing Services
- 8.2.3.1. Convenience Foods
- 8.2.3.2. Bakery Products
- 8.2.3.3. Confectionary Products
- 8.2.3.4. Dairy Products
- 8.2.3.5. Research & Development
- 8.2.3.6. Food Packaging Services
- 8.3. Market Analysis, Insights and Forecast - by Beverage
- 8.3.1. Current Market Scenario and growth influencers
- 8.3.2. Market B
- 8.3.2.1. Beer
- 8.3.2.2. Carbonated Drinks & Fruit-based Beverages
- 8.3.2.3. Bottled Water
- 8.3.2.4. Others (Sport Drinks)
- 8.4. Market Analysis, Insights and Forecast - by Personal Care
- 8.4.1. Current Market Scenario and growth influencers
- 8.4.2. Market Breakdown - by Type
- 8.4.2.1. Skin Care
- 8.4.2.2. Hair Care
- 8.4.2.3. Make up & Color Cosmetics
- 8.4.2.4. Others
- 8.1. Market Analysis, Insights and Forecast - by pharmaceutical
- 9. Europe US Contract Manufacturing Services Industry Analysis, Insights and Forecast, 2020-2032
- 9.1. Market Analysis, Insights and Forecast - by pharmaceutical
- 9.1.1. Current Market Scenario and growth influencers
- 9.1.2. Market B
- 9.1.3. Active P
- 9.1.3.1. Small molecule
- 9.1.3.2. Large Molecule
- 9.1.3.3. High Potency API (HPAPI)
- 9.1.4. Finished
- 9.1.4.1. Solid Dose Formulation
- 9.1.4.2. Liquid Dose Formulation
- 9.1.4.3. Injectable Dose Formulation
- 9.1.5. Secondary Packaging
- 9.2. Market Analysis, Insights and Forecast - by Food processing & manufacturing
- 9.2.1. Market Breakdown - by Service Type
- 9.2.2. Current Market Scenario and growth influencers
- 9.2.3. Food Manufacturing Services
- 9.2.3.1. Convenience Foods
- 9.2.3.2. Bakery Products
- 9.2.3.3. Confectionary Products
- 9.2.3.4. Dairy Products
- 9.2.3.5. Research & Development
- 9.2.3.6. Food Packaging Services
- 9.3. Market Analysis, Insights and Forecast - by Beverage
- 9.3.1. Current Market Scenario and growth influencers
- 9.3.2. Market B
- 9.3.2.1. Beer
- 9.3.2.2. Carbonated Drinks & Fruit-based Beverages
- 9.3.2.3. Bottled Water
- 9.3.2.4. Others (Sport Drinks)
- 9.4. Market Analysis, Insights and Forecast - by Personal Care
- 9.4.1. Current Market Scenario and growth influencers
- 9.4.2. Market Breakdown - by Type
- 9.4.2.1. Skin Care
- 9.4.2.2. Hair Care
- 9.4.2.3. Make up & Color Cosmetics
- 9.4.2.4. Others
- 9.1. Market Analysis, Insights and Forecast - by pharmaceutical
- 10. Middle East & Africa US Contract Manufacturing Services Industry Analysis, Insights and Forecast, 2020-2032
- 10.1. Market Analysis, Insights and Forecast - by pharmaceutical
- 10.1.1. Current Market Scenario and growth influencers
- 10.1.2. Market B
- 10.1.3. Active P
- 10.1.3.1. Small molecule
- 10.1.3.2. Large Molecule
- 10.1.3.3. High Potency API (HPAPI)
- 10.1.4. Finished
- 10.1.4.1. Solid Dose Formulation
- 10.1.4.2. Liquid Dose Formulation
- 10.1.4.3. Injectable Dose Formulation
- 10.1.5. Secondary Packaging
- 10.2. Market Analysis, Insights and Forecast - by Food processing & manufacturing
- 10.2.1. Market Breakdown - by Service Type
- 10.2.2. Current Market Scenario and growth influencers
- 10.2.3. Food Manufacturing Services
- 10.2.3.1. Convenience Foods
- 10.2.3.2. Bakery Products
- 10.2.3.3. Confectionary Products
- 10.2.3.4. Dairy Products
- 10.2.3.5. Research & Development
- 10.2.3.6. Food Packaging Services
- 10.3. Market Analysis, Insights and Forecast - by Beverage
- 10.3.1. Current Market Scenario and growth influencers
- 10.3.2. Market B
- 10.3.2.1. Beer
- 10.3.2.2. Carbonated Drinks & Fruit-based Beverages
- 10.3.2.3. Bottled Water
- 10.3.2.4. Others (Sport Drinks)
- 10.4. Market Analysis, Insights and Forecast - by Personal Care
- 10.4.1. Current Market Scenario and growth influencers
- 10.4.2. Market Breakdown - by Type
- 10.4.2.1. Skin Care
- 10.4.2.2. Hair Care
- 10.4.2.3. Make up & Color Cosmetics
- 10.4.2.4. Others
- 10.1. Market Analysis, Insights and Forecast - by pharmaceutical
- 11. Asia Pacific US Contract Manufacturing Services Industry Analysis, Insights and Forecast, 2020-2032
- 11.1. Market Analysis, Insights and Forecast - by pharmaceutical
- 11.1.1. Current Market Scenario and growth influencers
- 11.1.2. Market B
- 11.1.3. Active P
- 11.1.3.1. Small molecule
- 11.1.3.2. Large Molecule
- 11.1.3.3. High Potency API (HPAPI)
- 11.1.4. Finished
- 11.1.4.1. Solid Dose Formulation
- 11.1.4.2. Liquid Dose Formulation
- 11.1.4.3. Injectable Dose Formulation
- 11.1.5. Secondary Packaging
- 11.2. Market Analysis, Insights and Forecast - by Food processing & manufacturing
- 11.2.1. Market Breakdown - by Service Type
- 11.2.2. Current Market Scenario and growth influencers
- 11.2.3. Food Manufacturing Services
- 11.2.3.1. Convenience Foods
- 11.2.3.2. Bakery Products
- 11.2.3.3. Confectionary Products
- 11.2.3.4. Dairy Products
- 11.2.3.5. Research & Development
- 11.2.3.6. Food Packaging Services
- 11.3. Market Analysis, Insights and Forecast - by Beverage
- 11.3.1. Current Market Scenario and growth influencers
- 11.3.2. Market B
- 11.3.2.1. Beer
- 11.3.2.2. Carbonated Drinks & Fruit-based Beverages
- 11.3.2.3. Bottled Water
- 11.3.2.4. Others (Sport Drinks)
- 11.4. Market Analysis, Insights and Forecast - by Personal Care
- 11.4.1. Current Market Scenario and growth influencers
- 11.4.2. Market Breakdown - by Type
- 11.4.2.1. Skin Care
- 11.4.2.2. Hair Care
- 11.4.2.3. Make up & Color Cosmetics
- 11.4.2.4. Others
- 11.1. Market Analysis, Insights and Forecast - by pharmaceutical
- 12. Competitive Analysis
- 12.1. Company Profiles
- 12.1.1 Catalent Inc
- 12.1.1.1. Company Overview
- 12.1.1.2. Products
- 12.1.1.3. Company Financials
- 12.1.1.4. SWOT Analysis
- 12.1.2 Jubilant
- 12.1.2.1. Company Overview
- 12.1.2.2. Products
- 12.1.2.3. Company Financials
- 12.1.2.4. SWOT Analysis
- 12.1.3 Lonza Group
- 12.1.3.1. Company Overview
- 12.1.3.2. Products
- 12.1.3.3. Company Financials
- 12.1.3.4. SWOT Analysis
- 12.1.4 Aenova Group
- 12.1.4.1. Company Overview
- 12.1.4.2. Products
- 12.1.4.3. Company Financials
- 12.1.4.4. SWOT Analysis
- 12.1.5 Amerilab Technologies Inc
- 12.1.5.1. Company Overview
- 12.1.5.2. Products
- 12.1.5.3. Company Financials
- 12.1.5.4. SWOT Analysis
- 12.1.6 Bernet Food & Beverage
- 12.1.6.1. Company Overview
- 12.1.6.2. Products
- 12.1.6.3. Company Financials
- 12.1.6.4. SWOT Analysis
- 12.1.7 Big Brands LLC
- 12.1.7.1. Company Overview
- 12.1.7.2. Products
- 12.1.7.3. Company Financials
- 12.1.7.4. SWOT Analysis
- 12.1.8 Delamaine Fine Foods Limited
- 12.1.8.1. Company Overview
- 12.1.8.2. Products
- 12.1.8.3. Company Financials
- 12.1.8.4. SWOT Analysis
- 12.1.9 Brooklyn Bottling
- 12.1.9.1. Company Overview
- 12.1.9.2. Products
- 12.1.9.3. Company Financials
- 12.1.9.4. SWOT Analysis
- 12.1.10 CSD Co-Packers
- 12.1.10.1. Company Overview
- 12.1.10.2. Products
- 12.1.10.3. Company Financials
- 12.1.10.4. SWOT Analysis
- 12.1.11 Southeast Bottling & Beverages
- 12.1.11.1. Company Overview
- 12.1.11.2. Products
- 12.1.11.3. Company Financials
- 12.1.11.4. SWOT Analysis
- 12.1.12 G3 Enterprises
- 12.1.12.1. Company Overview
- 12.1.12.2. Products
- 12.1.12.3. Company Financials
- 12.1.12.4. SWOT Analysis
- 12.1.13 Western Innovations
- 12.1.13.1. Company Overview
- 12.1.13.2. Products
- 12.1.13.3. Company Financials
- 12.1.13.4. SWOT Analysis
- 12.1.14 Niagara Bottling and Robinsons Breweries
- 12.1.14.1. Company Overview
- 12.1.14.2. Products
- 12.1.14.3. Company Financials
- 12.1.14.4. SWOT Analysis
- 12.1.15 KIK Custom Products
- 12.1.15.1. Company Overview
- 12.1.15.2. Products
- 12.1.15.3. Company Financials
- 12.1.15.4. SWOT Analysis
- 12.1.16 Sensible Organics
- 12.1.16.1. Company Overview
- 12.1.16.2. Products
- 12.1.16.3. Company Financials
- 12.1.16.4. SWOT Analysis
- 12.1.17 Colep
- 12.1.17.1. Company Overview
- 12.1.17.2. Products
- 12.1.17.3. Company Financials
- 12.1.17.4. SWOT Analysis
- 12.1.18 Cosmetic Essence LLC
- 12.1.18.1. Company Overview
- 12.1.18.2. Products
- 12.1.18.3. Company Financials
- 12.1.18.4. SWOT Analysis
- 12.1.19 Formula Cap*List Not Exhaustive
- 12.1.19.1. Company Overview
- 12.1.19.2. Products
- 12.1.19.3. Company Financials
- 12.1.19.4. SWOT Analysis
- 12.1.1 Catalent Inc
- 12.2. Market Entropy
- 12.2.1 Company's Key Areas Served
- 12.2.2 Recent Developments
- 12.3. Company Market Share Analysis 2025
- 12.3.1 Top 5 Companies Market Share Analysis
- 12.3.2 Top 3 Companies Market Share Analysis
- 12.4. List of Potential Customers
- 13. Research Methodology
List of Figures
- Figure 1: Global US Contract Manufacturing Services Industry Revenue Breakdown (billion, %) by Region 2025 & 2033
- Figure 2: North America US Contract Manufacturing Services Industry Revenue (billion), by pharmaceutical 2025 & 2033
- Figure 3: North America US Contract Manufacturing Services Industry Revenue Share (%), by pharmaceutical 2025 & 2033
- Figure 4: North America US Contract Manufacturing Services Industry Revenue (billion), by Food processing & manufacturing 2025 & 2033
- Figure 5: North America US Contract Manufacturing Services Industry Revenue Share (%), by Food processing & manufacturing 2025 & 2033
- Figure 6: North America US Contract Manufacturing Services Industry Revenue (billion), by Beverage 2025 & 2033
- Figure 7: North America US Contract Manufacturing Services Industry Revenue Share (%), by Beverage 2025 & 2033
- Figure 8: North America US Contract Manufacturing Services Industry Revenue (billion), by Personal Care 2025 & 2033
- Figure 9: North America US Contract Manufacturing Services Industry Revenue Share (%), by Personal Care 2025 & 2033
- Figure 10: North America US Contract Manufacturing Services Industry Revenue (billion), by Country 2025 & 2033
- Figure 11: North America US Contract Manufacturing Services Industry Revenue Share (%), by Country 2025 & 2033
- Figure 12: South America US Contract Manufacturing Services Industry Revenue (billion), by pharmaceutical 2025 & 2033
- Figure 13: South America US Contract Manufacturing Services Industry Revenue Share (%), by pharmaceutical 2025 & 2033
- Figure 14: South America US Contract Manufacturing Services Industry Revenue (billion), by Food processing & manufacturing 2025 & 2033
- Figure 15: South America US Contract Manufacturing Services Industry Revenue Share (%), by Food processing & manufacturing 2025 & 2033
- Figure 16: South America US Contract Manufacturing Services Industry Revenue (billion), by Beverage 2025 & 2033
- Figure 17: South America US Contract Manufacturing Services Industry Revenue Share (%), by Beverage 2025 & 2033
- Figure 18: South America US Contract Manufacturing Services Industry Revenue (billion), by Personal Care 2025 & 2033
- Figure 19: South America US Contract Manufacturing Services Industry Revenue Share (%), by Personal Care 2025 & 2033
- Figure 20: South America US Contract Manufacturing Services Industry Revenue (billion), by Country 2025 & 2033
- Figure 21: South America US Contract Manufacturing Services Industry Revenue Share (%), by Country 2025 & 2033
- Figure 22: Europe US Contract Manufacturing Services Industry Revenue (billion), by pharmaceutical 2025 & 2033
- Figure 23: Europe US Contract Manufacturing Services Industry Revenue Share (%), by pharmaceutical 2025 & 2033
- Figure 24: Europe US Contract Manufacturing Services Industry Revenue (billion), by Food processing & manufacturing 2025 & 2033
- Figure 25: Europe US Contract Manufacturing Services Industry Revenue Share (%), by Food processing & manufacturing 2025 & 2033
- Figure 26: Europe US Contract Manufacturing Services Industry Revenue (billion), by Beverage 2025 & 2033
- Figure 27: Europe US Contract Manufacturing Services Industry Revenue Share (%), by Beverage 2025 & 2033
- Figure 28: Europe US Contract Manufacturing Services Industry Revenue (billion), by Personal Care 2025 & 2033
- Figure 29: Europe US Contract Manufacturing Services Industry Revenue Share (%), by Personal Care 2025 & 2033
- Figure 30: Europe US Contract Manufacturing Services Industry Revenue (billion), by Country 2025 & 2033
- Figure 31: Europe US Contract Manufacturing Services Industry Revenue Share (%), by Country 2025 & 2033
- Figure 32: Middle East & Africa US Contract Manufacturing Services Industry Revenue (billion), by pharmaceutical 2025 & 2033
- Figure 33: Middle East & Africa US Contract Manufacturing Services Industry Revenue Share (%), by pharmaceutical 2025 & 2033
- Figure 34: Middle East & Africa US Contract Manufacturing Services Industry Revenue (billion), by Food processing & manufacturing 2025 & 2033
- Figure 35: Middle East & Africa US Contract Manufacturing Services Industry Revenue Share (%), by Food processing & manufacturing 2025 & 2033
- Figure 36: Middle East & Africa US Contract Manufacturing Services Industry Revenue (billion), by Beverage 2025 & 2033
- Figure 37: Middle East & Africa US Contract Manufacturing Services Industry Revenue Share (%), by Beverage 2025 & 2033
- Figure 38: Middle East & Africa US Contract Manufacturing Services Industry Revenue (billion), by Personal Care 2025 & 2033
- Figure 39: Middle East & Africa US Contract Manufacturing Services Industry Revenue Share (%), by Personal Care 2025 & 2033
- Figure 40: Middle East & Africa US Contract Manufacturing Services Industry Revenue (billion), by Country 2025 & 2033
- Figure 41: Middle East & Africa US Contract Manufacturing Services Industry Revenue Share (%), by Country 2025 & 2033
- Figure 42: Asia Pacific US Contract Manufacturing Services Industry Revenue (billion), by pharmaceutical 2025 & 2033
- Figure 43: Asia Pacific US Contract Manufacturing Services Industry Revenue Share (%), by pharmaceutical 2025 & 2033
- Figure 44: Asia Pacific US Contract Manufacturing Services Industry Revenue (billion), by Food processing & manufacturing 2025 & 2033
- Figure 45: Asia Pacific US Contract Manufacturing Services Industry Revenue Share (%), by Food processing & manufacturing 2025 & 2033
- Figure 46: Asia Pacific US Contract Manufacturing Services Industry Revenue (billion), by Beverage 2025 & 2033
- Figure 47: Asia Pacific US Contract Manufacturing Services Industry Revenue Share (%), by Beverage 2025 & 2033
- Figure 48: Asia Pacific US Contract Manufacturing Services Industry Revenue (billion), by Personal Care 2025 & 2033
- Figure 49: Asia Pacific US Contract Manufacturing Services Industry Revenue Share (%), by Personal Care 2025 & 2033
- Figure 50: Asia Pacific US Contract Manufacturing Services Industry Revenue (billion), by Country 2025 & 2033
- Figure 51: Asia Pacific US Contract Manufacturing Services Industry Revenue Share (%), by Country 2025 & 2033
List of Tables
- Table 1: Global US Contract Manufacturing Services Industry Revenue billion Forecast, by pharmaceutical 2020 & 2033
- Table 2: Global US Contract Manufacturing Services Industry Revenue billion Forecast, by Food processing & manufacturing 2020 & 2033
- Table 3: Global US Contract Manufacturing Services Industry Revenue billion Forecast, by Beverage 2020 & 2033
- Table 4: Global US Contract Manufacturing Services Industry Revenue billion Forecast, by Personal Care 2020 & 2033
- Table 5: Global US Contract Manufacturing Services Industry Revenue billion Forecast, by Region 2020 & 2033
- Table 6: Global US Contract Manufacturing Services Industry Revenue billion Forecast, by pharmaceutical 2020 & 2033
- Table 7: Global US Contract Manufacturing Services Industry Revenue billion Forecast, by Food processing & manufacturing 2020 & 2033
- Table 8: Global US Contract Manufacturing Services Industry Revenue billion Forecast, by Beverage 2020 & 2033
- Table 9: Global US Contract Manufacturing Services Industry Revenue billion Forecast, by Personal Care 2020 & 2033
- Table 10: Global US Contract Manufacturing Services Industry Revenue billion Forecast, by Country 2020 & 2033
- Table 11: United States US Contract Manufacturing Services Industry Revenue (billion) Forecast, by Application 2020 & 2033
- Table 12: Canada US Contract Manufacturing Services Industry Revenue (billion) Forecast, by Application 2020 & 2033
- Table 13: Mexico US Contract Manufacturing Services Industry Revenue (billion) Forecast, by Application 2020 & 2033
- Table 14: Global US Contract Manufacturing Services Industry Revenue billion Forecast, by pharmaceutical 2020 & 2033
- Table 15: Global US Contract Manufacturing Services Industry Revenue billion Forecast, by Food processing & manufacturing 2020 & 2033
- Table 16: Global US Contract Manufacturing Services Industry Revenue billion Forecast, by Beverage 2020 & 2033
- Table 17: Global US Contract Manufacturing Services Industry Revenue billion Forecast, by Personal Care 2020 & 2033
- Table 18: Global US Contract Manufacturing Services Industry Revenue billion Forecast, by Country 2020 & 2033
- Table 19: Brazil US Contract Manufacturing Services Industry Revenue (billion) Forecast, by Application 2020 & 2033
- Table 20: Argentina US Contract Manufacturing Services Industry Revenue (billion) Forecast, by Application 2020 & 2033
- Table 21: Rest of South America US Contract Manufacturing Services Industry Revenue (billion) Forecast, by Application 2020 & 2033
- Table 22: Global US Contract Manufacturing Services Industry Revenue billion Forecast, by pharmaceutical 2020 & 2033
- Table 23: Global US Contract Manufacturing Services Industry Revenue billion Forecast, by Food processing & manufacturing 2020 & 2033
- Table 24: Global US Contract Manufacturing Services Industry Revenue billion Forecast, by Beverage 2020 & 2033
- Table 25: Global US Contract Manufacturing Services Industry Revenue billion Forecast, by Personal Care 2020 & 2033
- Table 26: Global US Contract Manufacturing Services Industry Revenue billion Forecast, by Country 2020 & 2033
- Table 27: United Kingdom US Contract Manufacturing Services Industry Revenue (billion) Forecast, by Application 2020 & 2033
- Table 28: Germany US Contract Manufacturing Services Industry Revenue (billion) Forecast, by Application 2020 & 2033
- Table 29: France US Contract Manufacturing Services Industry Revenue (billion) Forecast, by Application 2020 & 2033
- Table 30: Italy US Contract Manufacturing Services Industry Revenue (billion) Forecast, by Application 2020 & 2033
- Table 31: Spain US Contract Manufacturing Services Industry Revenue (billion) Forecast, by Application 2020 & 2033
- Table 32: Russia US Contract Manufacturing Services Industry Revenue (billion) Forecast, by Application 2020 & 2033
- Table 33: Benelux US Contract Manufacturing Services Industry Revenue (billion) Forecast, by Application 2020 & 2033
- Table 34: Nordics US Contract Manufacturing Services Industry Revenue (billion) Forecast, by Application 2020 & 2033
- Table 35: Rest of Europe US Contract Manufacturing Services Industry Revenue (billion) Forecast, by Application 2020 & 2033
- Table 36: Global US Contract Manufacturing Services Industry Revenue billion Forecast, by pharmaceutical 2020 & 2033
- Table 37: Global US Contract Manufacturing Services Industry Revenue billion Forecast, by Food processing & manufacturing 2020 & 2033
- Table 38: Global US Contract Manufacturing Services Industry Revenue billion Forecast, by Beverage 2020 & 2033
- Table 39: Global US Contract Manufacturing Services Industry Revenue billion Forecast, by Personal Care 2020 & 2033
- Table 40: Global US Contract Manufacturing Services Industry Revenue billion Forecast, by Country 2020 & 2033
- Table 41: Turkey US Contract Manufacturing Services Industry Revenue (billion) Forecast, by Application 2020 & 2033
- Table 42: Israel US Contract Manufacturing Services Industry Revenue (billion) Forecast, by Application 2020 & 2033
- Table 43: GCC US Contract Manufacturing Services Industry Revenue (billion) Forecast, by Application 2020 & 2033
- Table 44: North Africa US Contract Manufacturing Services Industry Revenue (billion) Forecast, by Application 2020 & 2033
- Table 45: South Africa US Contract Manufacturing Services Industry Revenue (billion) Forecast, by Application 2020 & 2033
- Table 46: Rest of Middle East & Africa US Contract Manufacturing Services Industry Revenue (billion) Forecast, by Application 2020 & 2033
- Table 47: Global US Contract Manufacturing Services Industry Revenue billion Forecast, by pharmaceutical 2020 & 2033
- Table 48: Global US Contract Manufacturing Services Industry Revenue billion Forecast, by Food processing & manufacturing 2020 & 2033
- Table 49: Global US Contract Manufacturing Services Industry Revenue billion Forecast, by Beverage 2020 & 2033
- Table 50: Global US Contract Manufacturing Services Industry Revenue billion Forecast, by Personal Care 2020 & 2033
- Table 51: Global US Contract Manufacturing Services Industry Revenue billion Forecast, by Country 2020 & 2033
- Table 52: China US Contract Manufacturing Services Industry Revenue (billion) Forecast, by Application 2020 & 2033
- Table 53: India US Contract Manufacturing Services Industry Revenue (billion) Forecast, by Application 2020 & 2033
- Table 54: Japan US Contract Manufacturing Services Industry Revenue (billion) Forecast, by Application 2020 & 2033
- Table 55: South Korea US Contract Manufacturing Services Industry Revenue (billion) Forecast, by Application 2020 & 2033
- Table 56: ASEAN US Contract Manufacturing Services Industry Revenue (billion) Forecast, by Application 2020 & 2033
- Table 57: Oceania US Contract Manufacturing Services Industry Revenue (billion) Forecast, by Application 2020 & 2033
- Table 58: Rest of Asia Pacific US Contract Manufacturing Services Industry Revenue (billion) Forecast, by Application 2020 & 2033
Frequently Asked Questions
1. What is the projected Compound Annual Growth Rate (CAGR) of the US Contract Manufacturing Services Industry?
The projected CAGR is approximately 6.8%.
2. Which companies are prominent players in the US Contract Manufacturing Services Industry?
Key companies in the market include Catalent Inc, Jubilant, Lonza Group, Aenova Group, Amerilab Technologies Inc, Bernet Food & Beverage, Big Brands LLC, Delamaine Fine Foods Limited, Brooklyn Bottling, CSD Co-Packers, Southeast Bottling & Beverages, G3 Enterprises, Western Innovations, Niagara Bottling and Robinsons Breweries, KIK Custom Products, Sensible Organics, Colep, Cosmetic Essence LLC, Formula Cap*List Not Exhaustive.
3. What are the main segments of the US Contract Manufacturing Services Industry?
The market segments include pharmaceutical, Food processing & manufacturing, Beverage, Personal Care.
4. Can you provide details about the market size?
The market size is estimated to be USD 101.6 billion as of 2022.
5. What are some drivers contributing to market growth?
Evolution of service offerings has enabled organizations to increasingly rely on contract manufacturers for their production needs; Challenges due to outsourcing of manufacturing to Asian countries has played a key role in prompting organizations to rely on local contract manufacturers.
6. What are the notable trends driving market growth?
Growth of Evolution of service offerings has enabled organizations to increasingly rely on contract manufacturers for their production needs.
7. Are there any restraints impacting market growth?
Evolution of service offerings has enabled organizations to increasingly rely on contract manufacturers for their production needs; Challenges due to outsourcing of manufacturing to Asian countries has played a key role in prompting organizations to rely on local contract manufacturers.
8. Can you provide examples of recent developments in the market?
May 2022 - Lonza and Israel Biotech Fund Collaborated Framework Agreement to Support Biologics and Small Molecules Development and Manufacture for Portfolio Companies which Facilitate Access to Israeli Market for Lonza.
9. What pricing options are available for accessing the report?
Pricing options include single-user, multi-user, and enterprise licenses priced at USD 3800, USD 4500, and USD 5800 respectively.
10. Is the market size provided in terms of value or volume?
The market size is provided in terms of value, measured in billion.
11. Are there any specific market keywords associated with the report?
Yes, the market keyword associated with the report is "US Contract Manufacturing Services Industry," which aids in identifying and referencing the specific market segment covered.
12. How do I determine which pricing option suits my needs best?
The pricing options vary based on user requirements and access needs. Individual users may opt for single-user licenses, while businesses requiring broader access may choose multi-user or enterprise licenses for cost-effective access to the report.
13. Are there any additional resources or data provided in the US Contract Manufacturing Services Industry report?
While the report offers comprehensive insights, it's advisable to review the specific contents or supplementary materials provided to ascertain if additional resources or data are available.
14. How can I stay updated on further developments or reports in the US Contract Manufacturing Services Industry?
To stay informed about further developments, trends, and reports in the US Contract Manufacturing Services Industry, consider subscribing to industry newsletters, following relevant companies and organizations, or regularly checking reputable industry news sources and publications.
Methodology
Step 1 - Identification of Relevant Samples Size from Population Database


Step 2 - Approaches for Defining Global Market Size (Value, Volume* & Price*)

Note*: In applicable scenarios
Step 3 - Data Sources
Primary Research
- Web Analytics
- Survey Reports
- Research Institute
- Latest Research Reports
- Opinion Leaders
Secondary Research
- Annual Reports
- White Paper
- Latest Press Release
- Industry Association
- Paid Database
- Investor Presentations

Step 4 - Data Triangulation
Involves using different sources of information in order to increase the validity of a study
These sources are likely to be stakeholders in a program - participants, other researchers, program staff, other community members, and so on.
Then we put all data in single framework & apply various statistical tools to find out the dynamic on the market.
During the analysis stage, feedback from the stakeholder groups would be compared to determine areas of agreement as well as areas of divergence