

Key Insights
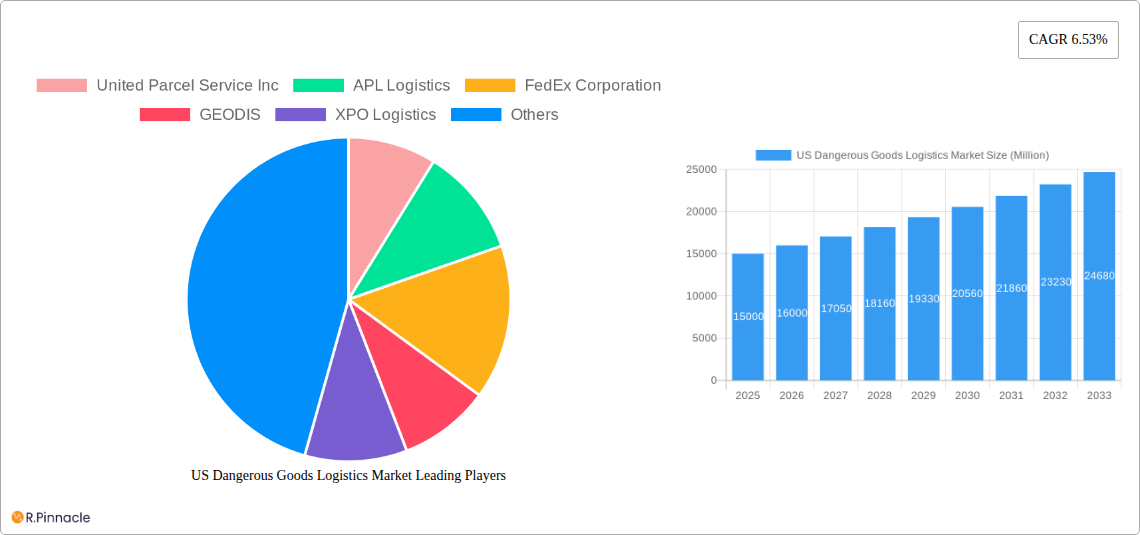
The United States dangerous goods logistics market is experiencing significant expansion, driven by escalating volumes of hazardous materials transportation. E-commerce growth, especially in pharmaceuticals and chemicals, is a key demand catalyst. Stringent government regulations mandate specialized logistics solutions, fostering opportunities for compliant service providers. Technological advancements, including real-time tracking and data analytics, are enhancing operational efficiency and safety, thereby contributing to market growth. The market is segmented by function (transportation, warehousing & distribution, value-added services) and destination (domestic, international). Leading players include UPS, FedEx, and DHL, alongside specialized hazardous materials handlers. The competitive environment is marked by consolidation and a strong emphasis on technological innovation to secure market share and deliver superior, compliant services. While regulatory compliance poses a challenge, it simultaneously drives market demand. The projected Compound Annual Growth Rate (CAGR) of 7.6% from 2025 to 2033 signifies robust future expansion, particularly in industrially active regions like the Northeast and West Coast. The market size in 2025 is estimated at $251.13 billion.
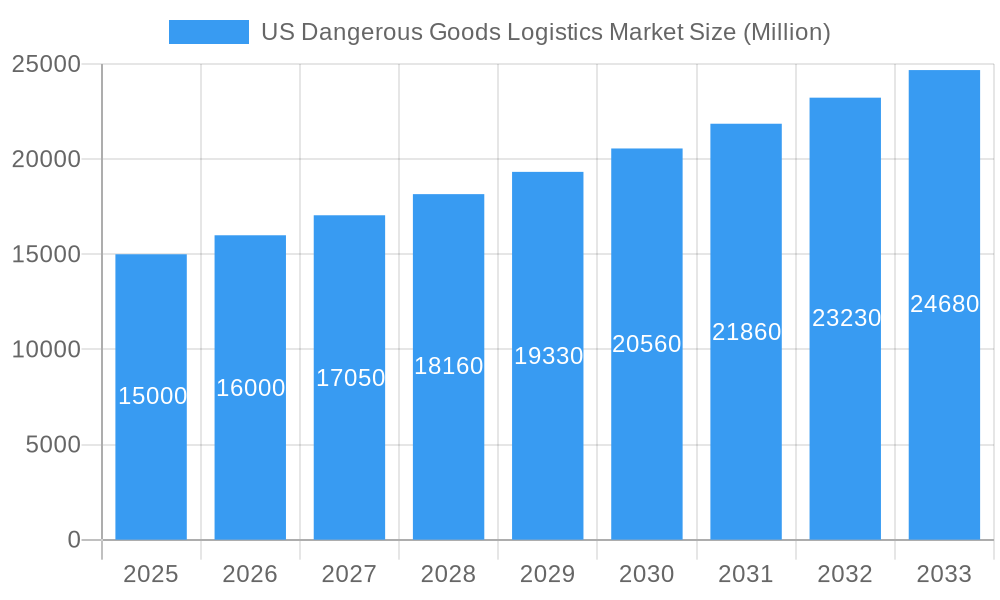
US Dangerous Goods Logistics Market Market Size (In Billion)
Growth is primarily propelled by increased demand for specialized handling and transportation of hazardous goods within the expanding e-commerce and manufacturing sectors. The domestic segment currently dominates, reflecting substantial intra-state hazardous material transport. However, the international segment is anticipated to experience accelerated growth due to supply chain globalization and rising cross-border trade in hazardous materials. Value-added services are also expected to expand as businesses seek integrated logistics solutions for regulatory compliance and risk mitigation. Key challenges include adapting to evolving regulations, managing transportation risks, and the high costs associated with specialized equipment and training.
US Dangerous Goods Logistics Market Company Market Share
US Dangerous Goods Logistics Market Report: 2019-2033
This comprehensive report provides an in-depth analysis of the US Dangerous Goods Logistics Market, offering actionable insights for industry professionals and strategic decision-makers. Covering the period from 2019 to 2033, with a focus on 2025, this report analyzes market structure, dynamics, dominant segments, and key players, offering valuable forecasting for the period 2025-2033. The market is projected to reach xx Million by 2033, exhibiting a CAGR of xx% during the forecast period.
US Dangerous Goods Logistics Market Market Structure & Innovation Trends
This section delves into the competitive landscape of the US Dangerous Goods Logistics market, examining market concentration, innovation drivers, and regulatory frameworks. The analysis incorporates data on mergers and acquisitions (M&A) activity within the sector, providing insights into market share distribution among key players.
Market Concentration: The market exhibits a moderately concentrated structure, with major players such as United Parcel Service Inc, FedEx Corporation, and DHL holding significant market shares. Smaller players, however, contribute significantly to the overall market volume. We estimate that the top 5 players control approximately xx% of the market in 2025.
Innovation Drivers: Technological advancements such as real-time tracking, predictive analytics, and automation are key drivers of innovation. The increasing demand for enhanced safety and compliance with stringent regulations further fuels innovation in packaging, transportation, and handling methods.
Regulatory Frameworks: Stringent regulations governing the transportation and handling of dangerous goods significantly influence market dynamics. Compliance costs and the complexity of regulations impact operational efficiency and profitability. The evolving regulatory landscape continues to shape investment decisions and technological adoption.
Product Substitutes: While direct substitutes for specialized dangerous goods logistics services are limited, pressure exists to optimize costs and efficiency. This leads to innovation and increased competition within the existing segment.
End-User Demographics: Key end-users include manufacturers, chemical companies, pharmaceutical firms, and healthcare providers. The varying needs and regulatory requirements of these end-users influence service offerings and pricing strategies.
M&A Activities: The market has witnessed several M&A activities in recent years, with deal values ranging from xx Million to xx Million. These consolidations aim to expand market reach, enhance service capabilities, and improve operational efficiencies. We project xx M&A deals in the next five years.
US Dangerous Goods Logistics Market Market Dynamics & Trends
This section examines the market's growth trajectory, analyzing key drivers, disruptive technologies, and competitive dynamics. Factors such as increased e-commerce activity, global trade expansion, and evolving consumer preferences are evaluated for their impact on market growth.
The US Dangerous Goods Logistics Market is experiencing robust growth, fueled by the increasing volume of dangerous goods shipments driven by e-commerce and globalization. Technological advancements such as IoT-enabled tracking and AI-powered route optimization are enhancing efficiency and safety. The market is witnessing increased demand for value-added services such as packaging, customs clearance, and freight brokerage. However, rising fuel costs, driver shortages, and geopolitical uncertainties pose challenges to sustained growth. The market is expected to witness a shift towards more sustainable and eco-friendly logistics solutions. The penetration of technology-driven solutions is projected to increase to xx% by 2033.
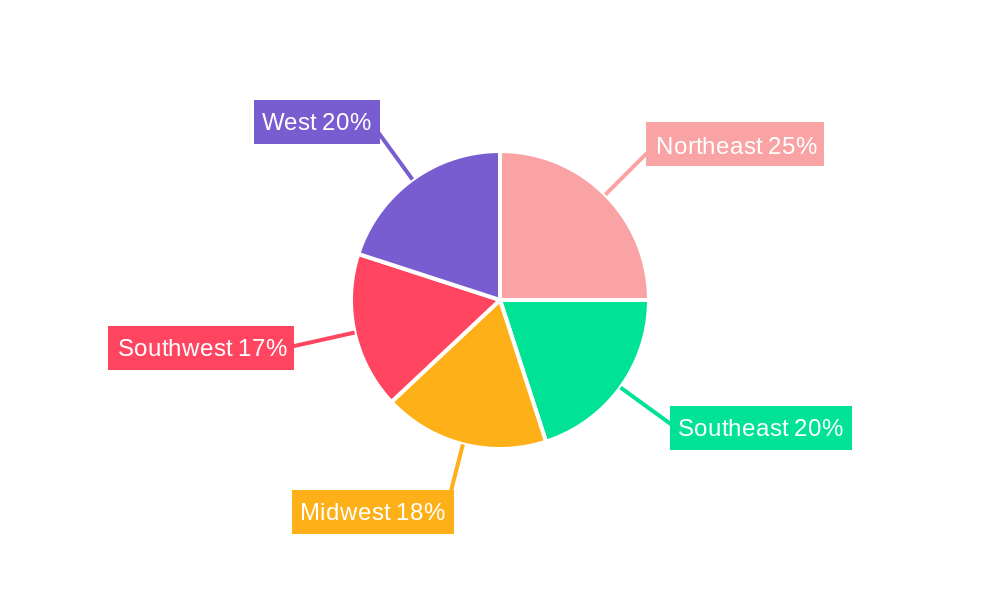
Dominant Regions & Segments in US Dangerous Goods Logistics Market
This section identifies the leading regions and segments within the US Dangerous Goods Logistics Market, analyzing their respective growth drivers.
By Function:
- Transportation: Road transportation holds the largest market share, driven by extensive road networks and accessibility. Air transportation is experiencing growth due to the need for faster delivery, particularly for time-sensitive shipments.
- Warehousing and Distribution: The demand for secure and specialized warehousing facilities equipped to handle dangerous goods is steadily increasing. Growth is fueled by e-commerce and the need for efficient inventory management.
- Value-added Services: Packaging, customs clearance, freight brokerage, and other value-added services are crucial for ensuring compliant and efficient transportation. Growth is driven by rising complexities in regulations and the demand for streamlined logistics solutions.
By Destination:
- Domestic: The domestic market represents the largest segment, driven by robust intra-state trade and e-commerce activity. Growth is influenced by economic conditions and consumer spending.
- International: The international segment is growing steadily, driven by global trade and the increasing cross-border movement of dangerous goods. Growth is susceptible to geopolitical factors and international trade policies.
Key Drivers:
- Robust infrastructure in key regions (e.g., California, Texas)
- Favorable government policies supporting logistics and trade
- High levels of industrial activity and manufacturing in specific regions
US Dangerous Goods Logistics Market Product Innovations
The market is witnessing significant product innovations, primarily focused on enhancing safety, efficiency, and compliance. New technologies include advanced packaging materials, real-time tracking systems, and automated handling equipment designed for dangerous goods. These innovations cater to the increasing demand for secure and efficient logistics solutions. Companies are investing heavily in developing solutions that improve transparency and traceability, particularly in light of stricter regulatory scrutiny.
Report Scope & Segmentation Analysis
This report provides a detailed analysis of the US Dangerous Goods Logistics Market, segmented by function (Transportation, Air, Warehousing and Distribution, Value-added Services) and destination (Domestic, International). Each segment's growth projections, market size, and competitive dynamics are thoroughly evaluated. The market size for Transportation is estimated at xx Million in 2025, expected to reach xx Million by 2033. Warehousing and Distribution will witness similar growth, while Value-Added services is projected to expand at a slightly faster rate. The Domestic market is currently the largest, and is expected to maintain its dominance, while the International market is expected to see faster growth.
Key Drivers of US Dangerous Goods Logistics Market Growth
The growth of the US Dangerous Goods Logistics market is propelled by several factors: the rise of e-commerce, necessitating efficient handling of diverse dangerous goods; technological advancements improving tracking, safety, and efficiency; increased global trade expanding the volume of cross-border dangerous goods shipments; and stringent regulations driving demand for compliant logistics solutions.
Challenges in the US Dangerous Goods Logistics Market Sector
Challenges include stringent regulatory compliance costs, driver shortages impacting transportation capacity, fluctuating fuel prices increasing operational expenses, and intense competition among established and emerging players. These factors, particularly the driver shortage, can impact delivery timelines and potentially increase costs for clients.
Emerging Opportunities in US Dangerous Goods Logistics Market
Emerging opportunities arise from the growing demand for sustainable logistics solutions, the adoption of advanced technologies like AI and blockchain for enhanced security and transparency, and the expansion of e-commerce into new markets requiring specialized dangerous goods handling. The focus on improving supply chain resilience and security also presents significant growth opportunities.
Leading Players in the US Dangerous Goods Logistics Market Market
- United Parcel Service Inc
- APL Logistics
- FedEx Corporation
- GEODIS
- XPO Logistics
- Landstar System Inc
- DB Schenker (The Americas)
- Kuehne + Nagel
- Schneider Logistics
- Deutsche Post DHL Group
- DSV
Key Developments in US Dangerous Goods Logistics Market Industry
- January 2023: FedEx implemented a new AI-powered routing system to optimize dangerous goods transportation.
- June 2022: DHL partnered with a tech company to launch a blockchain-based platform for enhanced tracking and traceability of dangerous goods.
- October 2021: UPS invested in a new fleet of electric vehicles for the delivery of smaller dangerous goods packages. (Further developments to be added as data becomes available)
Future Outlook for US Dangerous Goods Logistics Market Market
The US Dangerous Goods Logistics Market is poised for sustained growth, driven by technological innovation, increasing global trade, and the expanding e-commerce sector. Strategic partnerships, investments in sustainable logistics solutions, and the adoption of advanced technologies will be crucial for players to maintain a competitive edge and capitalize on future opportunities. The market is projected to witness increased consolidation as larger players seek to acquire smaller companies to gain market share and diversify their service portfolios.
US Dangerous Goods Logistics Market Segmentation
-
1. BY FUNCTION
-
1.1. Transportation
- 1.1.1. Road
- 1.1.2. Rail
- 1.1.3. Water
- 1.1.4. Pipeline
- 1.1.5. Air
- 1.2. Warehousing and Distribution
- 1.3. Value-ad
-
1.1. Transportation
-
2. BY DESTINATION
- 2.1. Domestic
- 2.2. International
US Dangerous Goods Logistics Market Segmentation By Geography
-
1. North America
- 1.1. United States
- 1.2. Canada
- 1.3. Mexico
-
2. South America
- 2.1. Brazil
- 2.2. Argentina
- 2.3. Rest of South America
-
3. Europe
- 3.1. United Kingdom
- 3.2. Germany
- 3.3. France
- 3.4. Italy
- 3.5. Spain
- 3.6. Russia
- 3.7. Benelux
- 3.8. Nordics
- 3.9. Rest of Europe
-
4. Middle East & Africa
- 4.1. Turkey
- 4.2. Israel
- 4.3. GCC
- 4.4. North Africa
- 4.5. South Africa
- 4.6. Rest of Middle East & Africa
-
5. Asia Pacific
- 5.1. China
- 5.2. India
- 5.3. Japan
- 5.4. South Korea
- 5.5. ASEAN
- 5.6. Oceania
- 5.7. Rest of Asia Pacific
US Dangerous Goods Logistics Market Regional Market Share
Geographic Coverage of US Dangerous Goods Logistics Market
US Dangerous Goods Logistics Market REPORT HIGHLIGHTS
| Aspects | Details |
|---|---|
| Study Period | 2020-2034 |
| Base Year | 2025 |
| Estimated Year | 2026 |
| Forecast Period | 2026-2034 |
| Historical Period | 2020-2025 |
| Growth Rate | CAGR of 7.6% from 2020-2034 |
| Segmentation |
|
Table of Contents
- 1. Introduction
- 1.1. Research Scope
- 1.2. Market Segmentation
- 1.3. Research Objective
- 1.4. Definitions and Assumptions
- 2. Executive Summary
- 2.1. Market Snapshot
- 3. Market Dynamics
- 3.1. Market Drivers
- 3.2. Market Restrains
- 3.3. Market Trends
- 3.4. Market Opportunities
- 4. Market Factor Analysis
- 4.1. Porters Five Forces
- 4.1.1. Bargaining Power of Suppliers
- 4.1.2. Bargaining Power of Buyers
- 4.1.3. Threat of New Entrants
- 4.1.4. Threat of Substitutes
- 4.1.5. Competitive Rivalry
- 4.2. PESTEL analysis
- 4.3. BCG Analysis
- 4.3.1. Stars (High Growth, High Market Share)
- 4.3.2. Cash Cows (Low Growth, High Market Share)
- 4.3.3. Question Mark (High Growth, Low Market Share)
- 4.3.4. Dogs (Low Growth, Low Market Share)
- 4.4. Ansoff Matrix Analysis
- 4.5. Supply Chain Analysis
- 4.6. Regulatory Landscape
- 4.7. Current Market Potential and Opportunity Assessment (TAM–SAM–SOM Framework)
- 4.8. PRI Analyst Note
- 4.1. Porters Five Forces
- 5. Market Analysis, Insights and Forecast 2021-2033
- 5.1. Market Analysis, Insights and Forecast - by BY FUNCTION
- 5.1.1. Transportation
- 5.1.1.1. Road
- 5.1.1.2. Rail
- 5.1.1.3. Water
- 5.1.1.4. Pipeline
- 5.1.1.5. Air
- 5.1.2. Warehousing and Distribution
- 5.1.3. Value-ad
- 5.1.1. Transportation
- 5.2. Market Analysis, Insights and Forecast - by BY DESTINATION
- 5.2.1. Domestic
- 5.2.2. International
- 5.3. Market Analysis, Insights and Forecast - by Region
- 5.3.1. North America
- 5.3.2. South America
- 5.3.3. Europe
- 5.3.4. Middle East & Africa
- 5.3.5. Asia Pacific
- 5.1. Market Analysis, Insights and Forecast - by BY FUNCTION
- 6. Global US Dangerous Goods Logistics Market Analysis, Insights and Forecast, 2021-2033
- 6.1. Market Analysis, Insights and Forecast - by BY FUNCTION
- 6.1.1. Transportation
- 6.1.1.1. Road
- 6.1.1.2. Rail
- 6.1.1.3. Water
- 6.1.1.4. Pipeline
- 6.1.1.5. Air
- 6.1.2. Warehousing and Distribution
- 6.1.3. Value-ad
- 6.1.1. Transportation
- 6.2. Market Analysis, Insights and Forecast - by BY DESTINATION
- 6.2.1. Domestic
- 6.2.2. International
- 6.1. Market Analysis, Insights and Forecast - by BY FUNCTION
- 7. North America US Dangerous Goods Logistics Market Analysis, Insights and Forecast, 2020-2032
- 7.1. Market Analysis, Insights and Forecast - by BY FUNCTION
- 7.1.1. Transportation
- 7.1.1.1. Road
- 7.1.1.2. Rail
- 7.1.1.3. Water
- 7.1.1.4. Pipeline
- 7.1.1.5. Air
- 7.1.2. Warehousing and Distribution
- 7.1.3. Value-ad
- 7.1.1. Transportation
- 7.2. Market Analysis, Insights and Forecast - by BY DESTINATION
- 7.2.1. Domestic
- 7.2.2. International
- 7.1. Market Analysis, Insights and Forecast - by BY FUNCTION
- 8. South America US Dangerous Goods Logistics Market Analysis, Insights and Forecast, 2020-2032
- 8.1. Market Analysis, Insights and Forecast - by BY FUNCTION
- 8.1.1. Transportation
- 8.1.1.1. Road
- 8.1.1.2. Rail
- 8.1.1.3. Water
- 8.1.1.4. Pipeline
- 8.1.1.5. Air
- 8.1.2. Warehousing and Distribution
- 8.1.3. Value-ad
- 8.1.1. Transportation
- 8.2. Market Analysis, Insights and Forecast - by BY DESTINATION
- 8.2.1. Domestic
- 8.2.2. International
- 8.1. Market Analysis, Insights and Forecast - by BY FUNCTION
- 9. Europe US Dangerous Goods Logistics Market Analysis, Insights and Forecast, 2020-2032
- 9.1. Market Analysis, Insights and Forecast - by BY FUNCTION
- 9.1.1. Transportation
- 9.1.1.1. Road
- 9.1.1.2. Rail
- 9.1.1.3. Water
- 9.1.1.4. Pipeline
- 9.1.1.5. Air
- 9.1.2. Warehousing and Distribution
- 9.1.3. Value-ad
- 9.1.1. Transportation
- 9.2. Market Analysis, Insights and Forecast - by BY DESTINATION
- 9.2.1. Domestic
- 9.2.2. International
- 9.1. Market Analysis, Insights and Forecast - by BY FUNCTION
- 10. Middle East & Africa US Dangerous Goods Logistics Market Analysis, Insights and Forecast, 2020-2032
- 10.1. Market Analysis, Insights and Forecast - by BY FUNCTION
- 10.1.1. Transportation
- 10.1.1.1. Road
- 10.1.1.2. Rail
- 10.1.1.3. Water
- 10.1.1.4. Pipeline
- 10.1.1.5. Air
- 10.1.2. Warehousing and Distribution
- 10.1.3. Value-ad
- 10.1.1. Transportation
- 10.2. Market Analysis, Insights and Forecast - by BY DESTINATION
- 10.2.1. Domestic
- 10.2.2. International
- 10.1. Market Analysis, Insights and Forecast - by BY FUNCTION
- 11. Asia Pacific US Dangerous Goods Logistics Market Analysis, Insights and Forecast, 2020-2032
- 11.1. Market Analysis, Insights and Forecast - by BY FUNCTION
- 11.1.1. Transportation
- 11.1.1.1. Road
- 11.1.1.2. Rail
- 11.1.1.3. Water
- 11.1.1.4. Pipeline
- 11.1.1.5. Air
- 11.1.2. Warehousing and Distribution
- 11.1.3. Value-ad
- 11.1.1. Transportation
- 11.2. Market Analysis, Insights and Forecast - by BY DESTINATION
- 11.2.1. Domestic
- 11.2.2. International
- 11.1. Market Analysis, Insights and Forecast - by BY FUNCTION
- 12. Competitive Analysis
- 12.1. Company Profiles
- 12.1.1 United Parcel Service Inc
- 12.1.1.1. Company Overview
- 12.1.1.2. Products
- 12.1.1.3. Company Financials
- 12.1.1.4. SWOT Analysis
- 12.1.2 APL Logistics
- 12.1.2.1. Company Overview
- 12.1.2.2. Products
- 12.1.2.3. Company Financials
- 12.1.2.4. SWOT Analysis
- 12.1.3 FedEx Corporation
- 12.1.3.1. Company Overview
- 12.1.3.2. Products
- 12.1.3.3. Company Financials
- 12.1.3.4. SWOT Analysis
- 12.1.4 GEODIS
- 12.1.4.1. Company Overview
- 12.1.4.2. Products
- 12.1.4.3. Company Financials
- 12.1.4.4. SWOT Analysis
- 12.1.5 XPO Logistics
- 12.1.5.1. Company Overview
- 12.1.5.2. Products
- 12.1.5.3. Company Financials
- 12.1.5.4. SWOT Analysis
- 12.1.6 Landstar System Inc **List Not Exhaustive
- 12.1.6.1. Company Overview
- 12.1.6.2. Products
- 12.1.6.3. Company Financials
- 12.1.6.4. SWOT Analysis
- 12.1.7 DB Schenker (The Americas)
- 12.1.7.1. Company Overview
- 12.1.7.2. Products
- 12.1.7.3. Company Financials
- 12.1.7.4. SWOT Analysis
- 12.1.8 Kuehne + Nagel
- 12.1.8.1. Company Overview
- 12.1.8.2. Products
- 12.1.8.3. Company Financials
- 12.1.8.4. SWOT Analysis
- 12.1.9 Schneider Logistics
- 12.1.9.1. Company Overview
- 12.1.9.2. Products
- 12.1.9.3. Company Financials
- 12.1.9.4. SWOT Analysis
- 12.1.10 Deutsche Post DHL Group
- 12.1.10.1. Company Overview
- 12.1.10.2. Products
- 12.1.10.3. Company Financials
- 12.1.10.4. SWOT Analysis
- 12.1.11 DSV
- 12.1.11.1. Company Overview
- 12.1.11.2. Products
- 12.1.11.3. Company Financials
- 12.1.11.4. SWOT Analysis
- 12.1.1 United Parcel Service Inc
- 12.2. Market Entropy
- 12.2.1 Company's Key Areas Served
- 12.2.2 Recent Developments
- 12.3. Company Market Share Analysis 2025
- 12.3.1 Top 5 Companies Market Share Analysis
- 12.3.2 Top 3 Companies Market Share Analysis
- 12.4. List of Potential Customers
- 13. Research Methodology
List of Figures
- Figure 1: Global US Dangerous Goods Logistics Market Revenue Breakdown (billion, %) by Region 2025 & 2033
- Figure 2: North America US Dangerous Goods Logistics Market Revenue (billion), by BY FUNCTION 2025 & 2033
- Figure 3: North America US Dangerous Goods Logistics Market Revenue Share (%), by BY FUNCTION 2025 & 2033
- Figure 4: North America US Dangerous Goods Logistics Market Revenue (billion), by BY DESTINATION 2025 & 2033
- Figure 5: North America US Dangerous Goods Logistics Market Revenue Share (%), by BY DESTINATION 2025 & 2033
- Figure 6: North America US Dangerous Goods Logistics Market Revenue (billion), by Country 2025 & 2033
- Figure 7: North America US Dangerous Goods Logistics Market Revenue Share (%), by Country 2025 & 2033
- Figure 8: South America US Dangerous Goods Logistics Market Revenue (billion), by BY FUNCTION 2025 & 2033
- Figure 9: South America US Dangerous Goods Logistics Market Revenue Share (%), by BY FUNCTION 2025 & 2033
- Figure 10: South America US Dangerous Goods Logistics Market Revenue (billion), by BY DESTINATION 2025 & 2033
- Figure 11: South America US Dangerous Goods Logistics Market Revenue Share (%), by BY DESTINATION 2025 & 2033
- Figure 12: South America US Dangerous Goods Logistics Market Revenue (billion), by Country 2025 & 2033
- Figure 13: South America US Dangerous Goods Logistics Market Revenue Share (%), by Country 2025 & 2033
- Figure 14: Europe US Dangerous Goods Logistics Market Revenue (billion), by BY FUNCTION 2025 & 2033
- Figure 15: Europe US Dangerous Goods Logistics Market Revenue Share (%), by BY FUNCTION 2025 & 2033
- Figure 16: Europe US Dangerous Goods Logistics Market Revenue (billion), by BY DESTINATION 2025 & 2033
- Figure 17: Europe US Dangerous Goods Logistics Market Revenue Share (%), by BY DESTINATION 2025 & 2033
- Figure 18: Europe US Dangerous Goods Logistics Market Revenue (billion), by Country 2025 & 2033
- Figure 19: Europe US Dangerous Goods Logistics Market Revenue Share (%), by Country 2025 & 2033
- Figure 20: Middle East & Africa US Dangerous Goods Logistics Market Revenue (billion), by BY FUNCTION 2025 & 2033
- Figure 21: Middle East & Africa US Dangerous Goods Logistics Market Revenue Share (%), by BY FUNCTION 2025 & 2033
- Figure 22: Middle East & Africa US Dangerous Goods Logistics Market Revenue (billion), by BY DESTINATION 2025 & 2033
- Figure 23: Middle East & Africa US Dangerous Goods Logistics Market Revenue Share (%), by BY DESTINATION 2025 & 2033
- Figure 24: Middle East & Africa US Dangerous Goods Logistics Market Revenue (billion), by Country 2025 & 2033
- Figure 25: Middle East & Africa US Dangerous Goods Logistics Market Revenue Share (%), by Country 2025 & 2033
- Figure 26: Asia Pacific US Dangerous Goods Logistics Market Revenue (billion), by BY FUNCTION 2025 & 2033
- Figure 27: Asia Pacific US Dangerous Goods Logistics Market Revenue Share (%), by BY FUNCTION 2025 & 2033
- Figure 28: Asia Pacific US Dangerous Goods Logistics Market Revenue (billion), by BY DESTINATION 2025 & 2033
- Figure 29: Asia Pacific US Dangerous Goods Logistics Market Revenue Share (%), by BY DESTINATION 2025 & 2033
- Figure 30: Asia Pacific US Dangerous Goods Logistics Market Revenue (billion), by Country 2025 & 2033
- Figure 31: Asia Pacific US Dangerous Goods Logistics Market Revenue Share (%), by Country 2025 & 2033
List of Tables
- Table 1: Global US Dangerous Goods Logistics Market Revenue billion Forecast, by BY FUNCTION 2020 & 2033
- Table 2: Global US Dangerous Goods Logistics Market Revenue billion Forecast, by BY DESTINATION 2020 & 2033
- Table 3: Global US Dangerous Goods Logistics Market Revenue billion Forecast, by Region 2020 & 2033
- Table 4: Global US Dangerous Goods Logistics Market Revenue billion Forecast, by BY FUNCTION 2020 & 2033
- Table 5: Global US Dangerous Goods Logistics Market Revenue billion Forecast, by BY DESTINATION 2020 & 2033
- Table 6: Global US Dangerous Goods Logistics Market Revenue billion Forecast, by Country 2020 & 2033
- Table 7: United States US Dangerous Goods Logistics Market Revenue (billion) Forecast, by Application 2020 & 2033
- Table 8: Canada US Dangerous Goods Logistics Market Revenue (billion) Forecast, by Application 2020 & 2033
- Table 9: Mexico US Dangerous Goods Logistics Market Revenue (billion) Forecast, by Application 2020 & 2033
- Table 10: Global US Dangerous Goods Logistics Market Revenue billion Forecast, by BY FUNCTION 2020 & 2033
- Table 11: Global US Dangerous Goods Logistics Market Revenue billion Forecast, by BY DESTINATION 2020 & 2033
- Table 12: Global US Dangerous Goods Logistics Market Revenue billion Forecast, by Country 2020 & 2033
- Table 13: Brazil US Dangerous Goods Logistics Market Revenue (billion) Forecast, by Application 2020 & 2033
- Table 14: Argentina US Dangerous Goods Logistics Market Revenue (billion) Forecast, by Application 2020 & 2033
- Table 15: Rest of South America US Dangerous Goods Logistics Market Revenue (billion) Forecast, by Application 2020 & 2033
- Table 16: Global US Dangerous Goods Logistics Market Revenue billion Forecast, by BY FUNCTION 2020 & 2033
- Table 17: Global US Dangerous Goods Logistics Market Revenue billion Forecast, by BY DESTINATION 2020 & 2033
- Table 18: Global US Dangerous Goods Logistics Market Revenue billion Forecast, by Country 2020 & 2033
- Table 19: United Kingdom US Dangerous Goods Logistics Market Revenue (billion) Forecast, by Application 2020 & 2033
- Table 20: Germany US Dangerous Goods Logistics Market Revenue (billion) Forecast, by Application 2020 & 2033
- Table 21: France US Dangerous Goods Logistics Market Revenue (billion) Forecast, by Application 2020 & 2033
- Table 22: Italy US Dangerous Goods Logistics Market Revenue (billion) Forecast, by Application 2020 & 2033
- Table 23: Spain US Dangerous Goods Logistics Market Revenue (billion) Forecast, by Application 2020 & 2033
- Table 24: Russia US Dangerous Goods Logistics Market Revenue (billion) Forecast, by Application 2020 & 2033
- Table 25: Benelux US Dangerous Goods Logistics Market Revenue (billion) Forecast, by Application 2020 & 2033
- Table 26: Nordics US Dangerous Goods Logistics Market Revenue (billion) Forecast, by Application 2020 & 2033
- Table 27: Rest of Europe US Dangerous Goods Logistics Market Revenue (billion) Forecast, by Application 2020 & 2033
- Table 28: Global US Dangerous Goods Logistics Market Revenue billion Forecast, by BY FUNCTION 2020 & 2033
- Table 29: Global US Dangerous Goods Logistics Market Revenue billion Forecast, by BY DESTINATION 2020 & 2033
- Table 30: Global US Dangerous Goods Logistics Market Revenue billion Forecast, by Country 2020 & 2033
- Table 31: Turkey US Dangerous Goods Logistics Market Revenue (billion) Forecast, by Application 2020 & 2033
- Table 32: Israel US Dangerous Goods Logistics Market Revenue (billion) Forecast, by Application 2020 & 2033
- Table 33: GCC US Dangerous Goods Logistics Market Revenue (billion) Forecast, by Application 2020 & 2033
- Table 34: North Africa US Dangerous Goods Logistics Market Revenue (billion) Forecast, by Application 2020 & 2033
- Table 35: South Africa US Dangerous Goods Logistics Market Revenue (billion) Forecast, by Application 2020 & 2033
- Table 36: Rest of Middle East & Africa US Dangerous Goods Logistics Market Revenue (billion) Forecast, by Application 2020 & 2033
- Table 37: Global US Dangerous Goods Logistics Market Revenue billion Forecast, by BY FUNCTION 2020 & 2033
- Table 38: Global US Dangerous Goods Logistics Market Revenue billion Forecast, by BY DESTINATION 2020 & 2033
- Table 39: Global US Dangerous Goods Logistics Market Revenue billion Forecast, by Country 2020 & 2033
- Table 40: China US Dangerous Goods Logistics Market Revenue (billion) Forecast, by Application 2020 & 2033
- Table 41: India US Dangerous Goods Logistics Market Revenue (billion) Forecast, by Application 2020 & 2033
- Table 42: Japan US Dangerous Goods Logistics Market Revenue (billion) Forecast, by Application 2020 & 2033
- Table 43: South Korea US Dangerous Goods Logistics Market Revenue (billion) Forecast, by Application 2020 & 2033
- Table 44: ASEAN US Dangerous Goods Logistics Market Revenue (billion) Forecast, by Application 2020 & 2033
- Table 45: Oceania US Dangerous Goods Logistics Market Revenue (billion) Forecast, by Application 2020 & 2033
- Table 46: Rest of Asia Pacific US Dangerous Goods Logistics Market Revenue (billion) Forecast, by Application 2020 & 2033
Frequently Asked Questions
1. What is the projected Compound Annual Growth Rate (CAGR) of the US Dangerous Goods Logistics Market?
The projected CAGR is approximately 7.6%.
2. Which companies are prominent players in the US Dangerous Goods Logistics Market?
Key companies in the market include United Parcel Service Inc, APL Logistics, FedEx Corporation, GEODIS, XPO Logistics, Landstar System Inc **List Not Exhaustive, DB Schenker (The Americas), Kuehne + Nagel, Schneider Logistics, Deutsche Post DHL Group, DSV.
3. What are the main segments of the US Dangerous Goods Logistics Market?
The market segments include BY FUNCTION, BY DESTINATION.
4. Can you provide details about the market size?
The market size is estimated to be USD 251.13 billion as of 2022.
5. What are some drivers contributing to market growth?
5.1 Drivers 5.2 Restraints 5.3 Opportunities 5.4 Porter's Five Forces Analysis 5.5 Industry Value Chain Analysis.
6. What are the notable trends driving market growth?
The US Oil Industry Growth.
7. Are there any restraints impacting market growth?
5.1 Drivers 5.2 Restraints 5.3 Opportunities 5.4 Porter's Five Forces Analysis 5.5 Industry Value Chain Analysis.
8. Can you provide examples of recent developments in the market?
N/A
9. What pricing options are available for accessing the report?
Pricing options include single-user, multi-user, and enterprise licenses priced at USD 3800, USD 4500, and USD 5800 respectively.
10. Is the market size provided in terms of value or volume?
The market size is provided in terms of value, measured in billion.
11. Are there any specific market keywords associated with the report?
Yes, the market keyword associated with the report is "US Dangerous Goods Logistics Market," which aids in identifying and referencing the specific market segment covered.
12. How do I determine which pricing option suits my needs best?
The pricing options vary based on user requirements and access needs. Individual users may opt for single-user licenses, while businesses requiring broader access may choose multi-user or enterprise licenses for cost-effective access to the report.
13. Are there any additional resources or data provided in the US Dangerous Goods Logistics Market report?
While the report offers comprehensive insights, it's advisable to review the specific contents or supplementary materials provided to ascertain if additional resources or data are available.
14. How can I stay updated on further developments or reports in the US Dangerous Goods Logistics Market?
To stay informed about further developments, trends, and reports in the US Dangerous Goods Logistics Market, consider subscribing to industry newsletters, following relevant companies and organizations, or regularly checking reputable industry news sources and publications.
Methodology
Step 1 - Identification of Relevant Samples Size from Population Database


Step 2 - Approaches for Defining Global Market Size (Value, Volume* & Price*)

Note*: In applicable scenarios
Step 3 - Data Sources
Primary Research
- Web Analytics
- Survey Reports
- Research Institute
- Latest Research Reports
- Opinion Leaders
Secondary Research
- Annual Reports
- White Paper
- Latest Press Release
- Industry Association
- Paid Database
- Investor Presentations

Step 4 - Data Triangulation
Involves using different sources of information in order to increase the validity of a study
These sources are likely to be stakeholders in a program - participants, other researchers, program staff, other community members, and so on.
Then we put all data in single framework & apply various statistical tools to find out the dynamic on the market.
During the analysis stage, feedback from the stakeholder groups would be compared to determine areas of agreement as well as areas of divergence