

Key Insights
The US digital freight management market is experiencing robust growth, projected to reach a substantial size within the forecast period (2025-2033). Driven by increasing demand for enhanced efficiency and transparency in supply chain operations, coupled with the widespread adoption of digital technologies across logistics, the market exhibits a Compound Annual Growth Rate (CAGR) of 21.72%. Key drivers include the need to optimize transportation costs, improve delivery times, and enhance visibility throughout the shipping process. The market segmentation reveals strong participation from both SMEs leveraging digital tools to compete with larger players and large enterprises and government agencies seeking advanced logistical solutions. The modal split showcases a significant reliance on ocean freight, reflecting the substantial volume of international trade, alongside the increasing importance of air and land transport for speed and regional delivery needs. The competitive landscape is dynamic, encompassing established global logistics giants like DHL and Kuehne + Nagel alongside agile tech-focused companies such as Flexport and Forto, and niche players catering to specific transportation modes. The regional distribution indicates strong performance across all US regions, reflecting the extensive reach of digital freight management solutions nationwide. Future growth will be fueled by continued technological innovation, including advancements in artificial intelligence and machine learning for route optimization and predictive analytics, further solidifying digital freight management as a cornerstone of modern supply chain management.
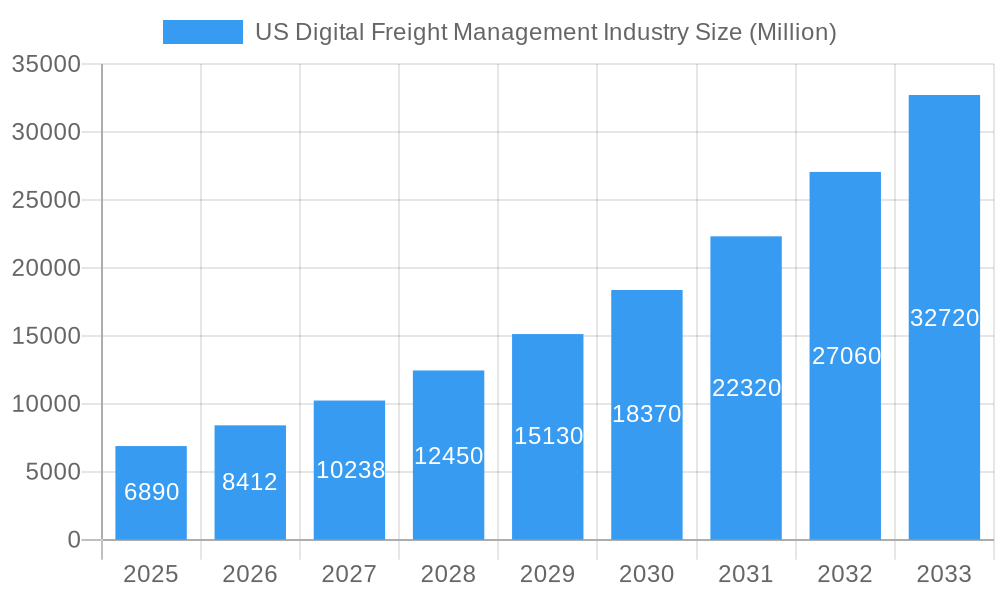
US Digital Freight Management Industry Market Size (In Billion)
The US market's growth trajectory is significantly influenced by several factors. The increasing adoption of cloud-based platforms and the integration of Internet of Things (IoT) devices provide real-time visibility and data-driven decision-making capabilities. This enhances operational efficiency and reduces costs, especially relevant for smaller enterprises. Regulatory changes aiming to improve transparency and accountability in the logistics sector are also positive catalysts. Conversely, challenges include potential security concerns related to data management and the need for robust cybersecurity protocols to mitigate risks. Integration complexities across different systems and the necessity for standardized data formats can also hinder widespread adoption. Despite these challenges, the market's overall outlook remains positive, with continuous advancements in technology and a growing awareness of the benefits of digital freight management driving sustained growth across diverse segments and regions. Growth is anticipated across all regions, with the West and Northeast possibly exhibiting higher growth rates due to existing infrastructure and technological hubs.
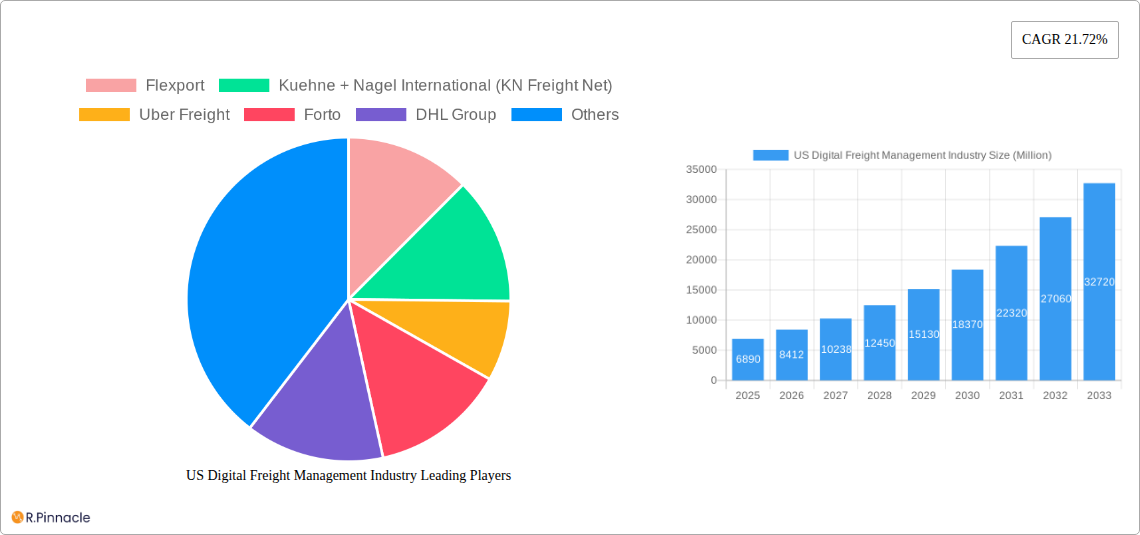
US Digital Freight Management Industry Company Market Share
This in-depth report provides a comprehensive analysis of the US digital freight management industry, offering invaluable insights for industry professionals, investors, and strategic decision-makers. With a focus on market trends, competitive dynamics, and future growth potential, this report covers the period from 2019 to 2033, with a base year of 2025 and a forecast period spanning 2025-2033. The report leverages extensive market research and data analysis to provide actionable insights into this rapidly evolving sector. The total market size in 2025 is estimated at $xx Million.
US Digital Freight Management Industry Market Structure & Innovation Trends
This section analyzes the competitive landscape of the US digital freight management industry, examining market concentration, innovation drivers, regulatory frameworks, and M&A activities. The market is characterized by a mix of large established players and emerging technology-driven companies.
- Market Concentration: While precise market share data for each company is proprietary, the market displays a relatively fragmented structure with several key players holding significant but not dominant shares. The recent merger between Transplace and Uber Freight indicates a trend towards consolidation.
- Innovation Drivers: Technological advancements, such as AI, machine learning, and blockchain technology, are driving significant innovation in digital freight management. These technologies are improving efficiency, transparency, and cost-effectiveness across the supply chain.
- Regulatory Frameworks: Government regulations related to transportation, data privacy, and security significantly influence market dynamics. Compliance with these regulations is crucial for companies operating in this sector.
- Product Substitutes: Traditional freight management methods still exist, but digital solutions offer enhanced efficiency and transparency, making them increasingly attractive to customers.
- End-User Demographics: The industry serves a broad range of end-users, including SMEs, large enterprises, and government agencies, each with specific needs and preferences.
- M&A Activities: The Transplace and Uber Freight merger, valued at $xx Million (estimated), highlights the strategic importance of consolidation and expansion within the digital freight management space. Further M&A activity is anticipated as companies strive for scale and broader market reach.
US Digital Freight Management Industry Market Dynamics & Trends
The US digital freight management market is experiencing robust growth, driven by several key factors. The market's Compound Annual Growth Rate (CAGR) during the forecast period (2025-2033) is projected to be xx%. This growth is fueled by increasing adoption of digital solutions by shippers seeking improved efficiency and visibility, as well as technological advancements leading to innovative solutions and enhanced user experience. Market penetration by digital freight management platforms continues to increase, reaching an estimated xx% in 2025. This growth is further propelled by the rising demand for real-time tracking, improved logistics optimization, and enhanced supply chain visibility. Competitive dynamics are intense, with companies continuously innovating to maintain their market position and attract customers. Consumer preferences are shifting towards digital solutions that offer greater convenience, transparency, and cost savings.
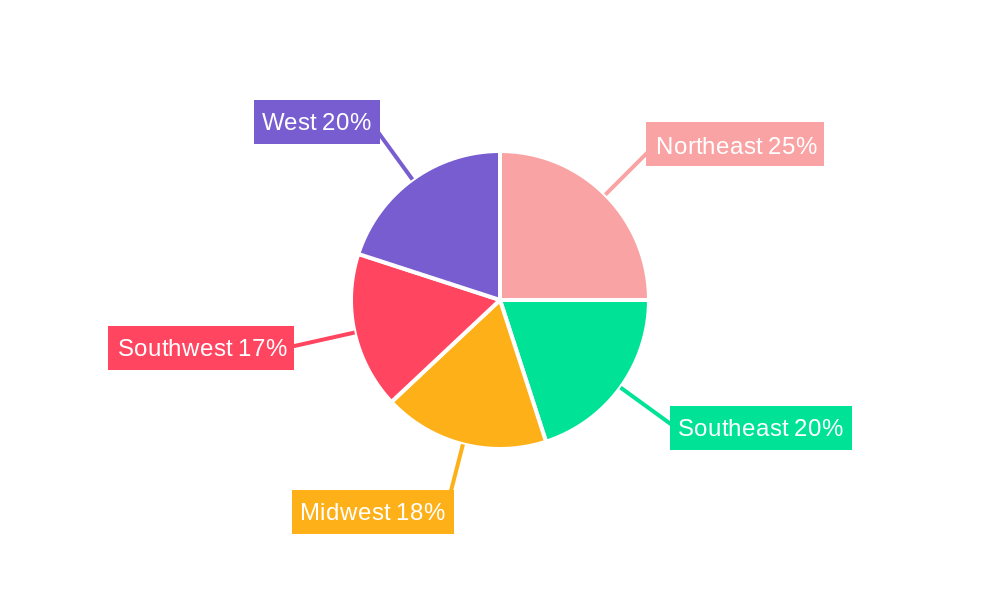
Dominant Regions & Segments in US Digital Freight Management Industry
While comprehensive regional breakdown is not readily available, it's likely that major metropolitan areas and regions with high freight volumes and robust infrastructure will experience higher market penetration of digital freight management solutions.
- By Firm Type: Large enterprises currently dominate the market, owing to their larger shipping volumes and greater capacity for technology adoption. However, the SME segment is exhibiting strong growth potential, driven by increased access to affordable and user-friendly digital platforms. Government agencies are increasingly adopting digital freight management solutions to optimize their logistics operations.
- By Mode of Transportation: While data for precise segment dominance is unavailable, the Land segment is likely the largest currently due to the significant volume of domestic freight movement within the US. The Ocean and Air segments are also growing, driven by increased e-commerce and globalization.
Key drivers within each segment include favorable economic policies, efficient transportation infrastructure, and government initiatives promoting digital adoption.
US Digital Freight Management Industry Product Innovations
Recent product innovations include advanced routing optimization algorithms, real-time tracking and monitoring capabilities, and integration with various transportation management systems (TMS). These innovations provide shippers with enhanced visibility and control over their freight operations, leading to significant cost savings and improved efficiency. The integration of AI and machine learning is particularly transformative, enabling predictive analytics and proactive risk management. These advancements cater to the market's demand for greater transparency, efficiency, and reliability in freight management.
Report Scope & Segmentation Analysis
This report segments the US digital freight management market by firm type (SMEs, Large Enterprises, and Governments) and mode of transportation (Ocean, Air, and Land). Each segment is analyzed based on market size, growth projections, and competitive dynamics. The SME segment is expected to experience significant growth due to increasing digital adoption. The Large Enterprise segment maintains a significant market share but faces intense competition. The Government segment is projected to grow steadily due to increasing focus on improving efficiency and transparency in public procurement. Growth projections for each mode of transportation will reflect prevailing trends in global trade and domestic logistics.
Key Drivers of US Digital Freight Management Industry Growth
Several factors are driving the growth of the US digital freight management industry, including:
- Technological Advancements: AI, machine learning, and blockchain are enhancing efficiency and transparency.
- Economic Growth: Increased demand for goods and services fuels the need for efficient freight management.
- Regulatory Changes: Government initiatives promoting digitization and supply chain optimization support industry growth.
Challenges in the US Digital Freight Management Industry Sector
The industry faces several challenges, including:
- Regulatory Hurdles: Navigating complex transportation regulations and data privacy laws can be costly and time-consuming.
- Supply Chain Disruptions: Global events can significantly impact freight movements and create unforeseen delays.
- Competitive Pressures: The industry is competitive, requiring companies to continuously innovate and adapt to stay ahead.
Emerging Opportunities in US Digital Freight Management Industry
Emerging opportunities include:
- Expansion into new markets: Reaching underserved regions and customer segments can create significant growth potential.
- Adoption of new technologies: Exploring and implementing cutting-edge technologies can improve efficiency and gain a competitive edge.
- Focus on sustainability: Meeting growing environmental concerns through eco-friendly solutions will attract environmentally conscious clients.
Leading Players in the US Digital Freight Management Industry Market
- Flexport
- Kuehne + Nagel International (KN Freight Net)
- Uber Freight
- Forto
- DHL Group
- Agility Logistics Pvt Ltd
- Expeditors International
- InstaFreight
- Turvo
- iContainers
- Twill
- NYSHEX
- Transporteca
- uShip
- Convoy
- Kontainers
Key Developments in US Digital Freight Management Industry
- October 2022: Transplace and Uber Freight merger completed, creating a large network demand and supply platform.
- September 2022: Kuehne+Nagel announced a new healthcare contract logistics network in the US.
Future Outlook for US Digital Freight Management Industry Market
The US digital freight management market is poised for continued robust growth, driven by technological innovation, increased demand for efficient logistics solutions, and favorable regulatory environments. Strategic partnerships, acquisitions, and investments in emerging technologies will play a crucial role in shaping the future of this dynamic sector. The market's potential for expansion into new markets and the adoption of sustainable practices further contribute to a positive outlook.
US Digital Freight Management Industry Segmentation
-
1. Mode of Transportation
- 1.1. Ocean
- 1.2. Air
- 1.3. Land
-
2. Firm Type
- 2.1. SMEs
- 2.2. Large Enterprises and Governments
US Digital Freight Management Industry Segmentation By Geography
-
1. North America
- 1.1. United States
- 1.2. Canada
- 1.3. Mexico
-
2. South America
- 2.1. Brazil
- 2.2. Argentina
- 2.3. Rest of South America
-
3. Europe
- 3.1. United Kingdom
- 3.2. Germany
- 3.3. France
- 3.4. Italy
- 3.5. Spain
- 3.6. Russia
- 3.7. Benelux
- 3.8. Nordics
- 3.9. Rest of Europe
-
4. Middle East & Africa
- 4.1. Turkey
- 4.2. Israel
- 4.3. GCC
- 4.4. North Africa
- 4.5. South Africa
- 4.6. Rest of Middle East & Africa
-
5. Asia Pacific
- 5.1. China
- 5.2. India
- 5.3. Japan
- 5.4. South Korea
- 5.5. ASEAN
- 5.6. Oceania
- 5.7. Rest of Asia Pacific
US Digital Freight Management Industry Regional Market Share
Geographic Coverage of US Digital Freight Management Industry
US Digital Freight Management Industry REPORT HIGHLIGHTS
| Aspects | Details |
|---|---|
| Study Period | 2020-2034 |
| Base Year | 2025 |
| Estimated Year | 2026 |
| Forecast Period | 2026-2034 |
| Historical Period | 2020-2025 |
| Growth Rate | CAGR of 21.72% from 2020-2034 |
| Segmentation |
|
Table of Contents
- 1. Introduction
- 1.1. Research Scope
- 1.2. Market Segmentation
- 1.3. Research Objective
- 1.4. Definitions and Assumptions
- 2. Executive Summary
- 2.1. Market Snapshot
- 3. Market Dynamics
- 3.1. Market Drivers
- 3.2. Market Restrains
- 3.3. Market Trends
- 3.4. Market Opportunities
- 4. Market Factor Analysis
- 4.1. Porters Five Forces
- 4.1.1. Bargaining Power of Suppliers
- 4.1.2. Bargaining Power of Buyers
- 4.1.3. Threat of New Entrants
- 4.1.4. Threat of Substitutes
- 4.1.5. Competitive Rivalry
- 4.2. PESTEL analysis
- 4.3. BCG Analysis
- 4.3.1. Stars (High Growth, High Market Share)
- 4.3.2. Cash Cows (Low Growth, High Market Share)
- 4.3.3. Question Mark (High Growth, Low Market Share)
- 4.3.4. Dogs (Low Growth, Low Market Share)
- 4.4. Ansoff Matrix Analysis
- 4.5. Supply Chain Analysis
- 4.6. Regulatory Landscape
- 4.7. Current Market Potential and Opportunity Assessment (TAM–SAM–SOM Framework)
- 4.8. PRI Analyst Note
- 4.1. Porters Five Forces
- 5. Market Analysis, Insights and Forecast 2021-2033
- 5.1. Market Analysis, Insights and Forecast - by Mode of Transportation
- 5.1.1. Ocean
- 5.1.2. Air
- 5.1.3. Land
- 5.2. Market Analysis, Insights and Forecast - by Firm Type
- 5.2.1. SMEs
- 5.2.2. Large Enterprises and Governments
- 5.3. Market Analysis, Insights and Forecast - by Region
- 5.3.1. North America
- 5.3.2. South America
- 5.3.3. Europe
- 5.3.4. Middle East & Africa
- 5.3.5. Asia Pacific
- 5.1. Market Analysis, Insights and Forecast - by Mode of Transportation
- 6. Global US Digital Freight Management Industry Analysis, Insights and Forecast, 2021-2033
- 6.1. Market Analysis, Insights and Forecast - by Mode of Transportation
- 6.1.1. Ocean
- 6.1.2. Air
- 6.1.3. Land
- 6.2. Market Analysis, Insights and Forecast - by Firm Type
- 6.2.1. SMEs
- 6.2.2. Large Enterprises and Governments
- 6.1. Market Analysis, Insights and Forecast - by Mode of Transportation
- 7. North America US Digital Freight Management Industry Analysis, Insights and Forecast, 2020-2032
- 7.1. Market Analysis, Insights and Forecast - by Mode of Transportation
- 7.1.1. Ocean
- 7.1.2. Air
- 7.1.3. Land
- 7.2. Market Analysis, Insights and Forecast - by Firm Type
- 7.2.1. SMEs
- 7.2.2. Large Enterprises and Governments
- 7.1. Market Analysis, Insights and Forecast - by Mode of Transportation
- 8. South America US Digital Freight Management Industry Analysis, Insights and Forecast, 2020-2032
- 8.1. Market Analysis, Insights and Forecast - by Mode of Transportation
- 8.1.1. Ocean
- 8.1.2. Air
- 8.1.3. Land
- 8.2. Market Analysis, Insights and Forecast - by Firm Type
- 8.2.1. SMEs
- 8.2.2. Large Enterprises and Governments
- 8.1. Market Analysis, Insights and Forecast - by Mode of Transportation
- 9. Europe US Digital Freight Management Industry Analysis, Insights and Forecast, 2020-2032
- 9.1. Market Analysis, Insights and Forecast - by Mode of Transportation
- 9.1.1. Ocean
- 9.1.2. Air
- 9.1.3. Land
- 9.2. Market Analysis, Insights and Forecast - by Firm Type
- 9.2.1. SMEs
- 9.2.2. Large Enterprises and Governments
- 9.1. Market Analysis, Insights and Forecast - by Mode of Transportation
- 10. Middle East & Africa US Digital Freight Management Industry Analysis, Insights and Forecast, 2020-2032
- 10.1. Market Analysis, Insights and Forecast - by Mode of Transportation
- 10.1.1. Ocean
- 10.1.2. Air
- 10.1.3. Land
- 10.2. Market Analysis, Insights and Forecast - by Firm Type
- 10.2.1. SMEs
- 10.2.2. Large Enterprises and Governments
- 10.1. Market Analysis, Insights and Forecast - by Mode of Transportation
- 11. Asia Pacific US Digital Freight Management Industry Analysis, Insights and Forecast, 2020-2032
- 11.1. Market Analysis, Insights and Forecast - by Mode of Transportation
- 11.1.1. Ocean
- 11.1.2. Air
- 11.1.3. Land
- 11.2. Market Analysis, Insights and Forecast - by Firm Type
- 11.2.1. SMEs
- 11.2.2. Large Enterprises and Governments
- 11.1. Market Analysis, Insights and Forecast - by Mode of Transportation
- 12. Competitive Analysis
- 12.1. Company Profiles
- 12.1.1 Flexport
- 12.1.1.1. Company Overview
- 12.1.1.2. Products
- 12.1.1.3. Company Financials
- 12.1.1.4. SWOT Analysis
- 12.1.2 Kuehne + Nagel International (KN Freight Net)
- 12.1.2.1. Company Overview
- 12.1.2.2. Products
- 12.1.2.3. Company Financials
- 12.1.2.4. SWOT Analysis
- 12.1.3 Uber Freight
- 12.1.3.1. Company Overview
- 12.1.3.2. Products
- 12.1.3.3. Company Financials
- 12.1.3.4. SWOT Analysis
- 12.1.4 Forto
- 12.1.4.1. Company Overview
- 12.1.4.2. Products
- 12.1.4.3. Company Financials
- 12.1.4.4. SWOT Analysis
- 12.1.5 DHL Group
- 12.1.5.1. Company Overview
- 12.1.5.2. Products
- 12.1.5.3. Company Financials
- 12.1.5.4. SWOT Analysis
- 12.1.6 Agility Logistics Pvt Ltd
- 12.1.6.1. Company Overview
- 12.1.6.2. Products
- 12.1.6.3. Company Financials
- 12.1.6.4. SWOT Analysis
- 12.1.7 Expeditors International
- 12.1.7.1. Company Overview
- 12.1.7.2. Products
- 12.1.7.3. Company Financials
- 12.1.7.4. SWOT Analysis
- 12.1.8 InstaFreight
- 12.1.8.1. Company Overview
- 12.1.8.2. Products
- 12.1.8.3. Company Financials
- 12.1.8.4. SWOT Analysis
- 12.1.9 Turvo
- 12.1.9.1. Company Overview
- 12.1.9.2. Products
- 12.1.9.3. Company Financials
- 12.1.9.4. SWOT Analysis
- 12.1.10 iContainers
- 12.1.10.1. Company Overview
- 12.1.10.2. Products
- 12.1.10.3. Company Financials
- 12.1.10.4. SWOT Analysis
- 12.1.11 Twill
- 12.1.11.1. Company Overview
- 12.1.11.2. Products
- 12.1.11.3. Company Financials
- 12.1.11.4. SWOT Analysis
- 12.1.12 NYSHEX
- 12.1.12.1. Company Overview
- 12.1.12.2. Products
- 12.1.12.3. Company Financials
- 12.1.12.4. SWOT Analysis
- 12.1.13 Transporteca
- 12.1.13.1. Company Overview
- 12.1.13.2. Products
- 12.1.13.3. Company Financials
- 12.1.13.4. SWOT Analysis
- 12.1.14 uShip**List Not Exhaustive
- 12.1.14.1. Company Overview
- 12.1.14.2. Products
- 12.1.14.3. Company Financials
- 12.1.14.4. SWOT Analysis
- 12.1.15 Convoy
- 12.1.15.1. Company Overview
- 12.1.15.2. Products
- 12.1.15.3. Company Financials
- 12.1.15.4. SWOT Analysis
- 12.1.16 Kontainers
- 12.1.16.1. Company Overview
- 12.1.16.2. Products
- 12.1.16.3. Company Financials
- 12.1.16.4. SWOT Analysis
- 12.1.1 Flexport
- 12.2. Market Entropy
- 12.2.1 Company's Key Areas Served
- 12.2.2 Recent Developments
- 12.3. Company Market Share Analysis 2025
- 12.3.1 Top 5 Companies Market Share Analysis
- 12.3.2 Top 3 Companies Market Share Analysis
- 12.4. List of Potential Customers
- 13. Research Methodology
List of Figures
- Figure 1: Global US Digital Freight Management Industry Revenue Breakdown (Million, %) by Region 2025 & 2033
- Figure 2: North America US Digital Freight Management Industry Revenue (Million), by Mode of Transportation 2025 & 2033
- Figure 3: North America US Digital Freight Management Industry Revenue Share (%), by Mode of Transportation 2025 & 2033
- Figure 4: North America US Digital Freight Management Industry Revenue (Million), by Firm Type 2025 & 2033
- Figure 5: North America US Digital Freight Management Industry Revenue Share (%), by Firm Type 2025 & 2033
- Figure 6: North America US Digital Freight Management Industry Revenue (Million), by Country 2025 & 2033
- Figure 7: North America US Digital Freight Management Industry Revenue Share (%), by Country 2025 & 2033
- Figure 8: South America US Digital Freight Management Industry Revenue (Million), by Mode of Transportation 2025 & 2033
- Figure 9: South America US Digital Freight Management Industry Revenue Share (%), by Mode of Transportation 2025 & 2033
- Figure 10: South America US Digital Freight Management Industry Revenue (Million), by Firm Type 2025 & 2033
- Figure 11: South America US Digital Freight Management Industry Revenue Share (%), by Firm Type 2025 & 2033
- Figure 12: South America US Digital Freight Management Industry Revenue (Million), by Country 2025 & 2033
- Figure 13: South America US Digital Freight Management Industry Revenue Share (%), by Country 2025 & 2033
- Figure 14: Europe US Digital Freight Management Industry Revenue (Million), by Mode of Transportation 2025 & 2033
- Figure 15: Europe US Digital Freight Management Industry Revenue Share (%), by Mode of Transportation 2025 & 2033
- Figure 16: Europe US Digital Freight Management Industry Revenue (Million), by Firm Type 2025 & 2033
- Figure 17: Europe US Digital Freight Management Industry Revenue Share (%), by Firm Type 2025 & 2033
- Figure 18: Europe US Digital Freight Management Industry Revenue (Million), by Country 2025 & 2033
- Figure 19: Europe US Digital Freight Management Industry Revenue Share (%), by Country 2025 & 2033
- Figure 20: Middle East & Africa US Digital Freight Management Industry Revenue (Million), by Mode of Transportation 2025 & 2033
- Figure 21: Middle East & Africa US Digital Freight Management Industry Revenue Share (%), by Mode of Transportation 2025 & 2033
- Figure 22: Middle East & Africa US Digital Freight Management Industry Revenue (Million), by Firm Type 2025 & 2033
- Figure 23: Middle East & Africa US Digital Freight Management Industry Revenue Share (%), by Firm Type 2025 & 2033
- Figure 24: Middle East & Africa US Digital Freight Management Industry Revenue (Million), by Country 2025 & 2033
- Figure 25: Middle East & Africa US Digital Freight Management Industry Revenue Share (%), by Country 2025 & 2033
- Figure 26: Asia Pacific US Digital Freight Management Industry Revenue (Million), by Mode of Transportation 2025 & 2033
- Figure 27: Asia Pacific US Digital Freight Management Industry Revenue Share (%), by Mode of Transportation 2025 & 2033
- Figure 28: Asia Pacific US Digital Freight Management Industry Revenue (Million), by Firm Type 2025 & 2033
- Figure 29: Asia Pacific US Digital Freight Management Industry Revenue Share (%), by Firm Type 2025 & 2033
- Figure 30: Asia Pacific US Digital Freight Management Industry Revenue (Million), by Country 2025 & 2033
- Figure 31: Asia Pacific US Digital Freight Management Industry Revenue Share (%), by Country 2025 & 2033
List of Tables
- Table 1: Global US Digital Freight Management Industry Revenue Million Forecast, by Mode of Transportation 2020 & 2033
- Table 2: Global US Digital Freight Management Industry Revenue Million Forecast, by Firm Type 2020 & 2033
- Table 3: Global US Digital Freight Management Industry Revenue Million Forecast, by Region 2020 & 2033
- Table 4: Global US Digital Freight Management Industry Revenue Million Forecast, by Mode of Transportation 2020 & 2033
- Table 5: Global US Digital Freight Management Industry Revenue Million Forecast, by Firm Type 2020 & 2033
- Table 6: Global US Digital Freight Management Industry Revenue Million Forecast, by Country 2020 & 2033
- Table 7: United States US Digital Freight Management Industry Revenue (Million) Forecast, by Application 2020 & 2033
- Table 8: Canada US Digital Freight Management Industry Revenue (Million) Forecast, by Application 2020 & 2033
- Table 9: Mexico US Digital Freight Management Industry Revenue (Million) Forecast, by Application 2020 & 2033
- Table 10: Global US Digital Freight Management Industry Revenue Million Forecast, by Mode of Transportation 2020 & 2033
- Table 11: Global US Digital Freight Management Industry Revenue Million Forecast, by Firm Type 2020 & 2033
- Table 12: Global US Digital Freight Management Industry Revenue Million Forecast, by Country 2020 & 2033
- Table 13: Brazil US Digital Freight Management Industry Revenue (Million) Forecast, by Application 2020 & 2033
- Table 14: Argentina US Digital Freight Management Industry Revenue (Million) Forecast, by Application 2020 & 2033
- Table 15: Rest of South America US Digital Freight Management Industry Revenue (Million) Forecast, by Application 2020 & 2033
- Table 16: Global US Digital Freight Management Industry Revenue Million Forecast, by Mode of Transportation 2020 & 2033
- Table 17: Global US Digital Freight Management Industry Revenue Million Forecast, by Firm Type 2020 & 2033
- Table 18: Global US Digital Freight Management Industry Revenue Million Forecast, by Country 2020 & 2033
- Table 19: United Kingdom US Digital Freight Management Industry Revenue (Million) Forecast, by Application 2020 & 2033
- Table 20: Germany US Digital Freight Management Industry Revenue (Million) Forecast, by Application 2020 & 2033
- Table 21: France US Digital Freight Management Industry Revenue (Million) Forecast, by Application 2020 & 2033
- Table 22: Italy US Digital Freight Management Industry Revenue (Million) Forecast, by Application 2020 & 2033
- Table 23: Spain US Digital Freight Management Industry Revenue (Million) Forecast, by Application 2020 & 2033
- Table 24: Russia US Digital Freight Management Industry Revenue (Million) Forecast, by Application 2020 & 2033
- Table 25: Benelux US Digital Freight Management Industry Revenue (Million) Forecast, by Application 2020 & 2033
- Table 26: Nordics US Digital Freight Management Industry Revenue (Million) Forecast, by Application 2020 & 2033
- Table 27: Rest of Europe US Digital Freight Management Industry Revenue (Million) Forecast, by Application 2020 & 2033
- Table 28: Global US Digital Freight Management Industry Revenue Million Forecast, by Mode of Transportation 2020 & 2033
- Table 29: Global US Digital Freight Management Industry Revenue Million Forecast, by Firm Type 2020 & 2033
- Table 30: Global US Digital Freight Management Industry Revenue Million Forecast, by Country 2020 & 2033
- Table 31: Turkey US Digital Freight Management Industry Revenue (Million) Forecast, by Application 2020 & 2033
- Table 32: Israel US Digital Freight Management Industry Revenue (Million) Forecast, by Application 2020 & 2033
- Table 33: GCC US Digital Freight Management Industry Revenue (Million) Forecast, by Application 2020 & 2033
- Table 34: North Africa US Digital Freight Management Industry Revenue (Million) Forecast, by Application 2020 & 2033
- Table 35: South Africa US Digital Freight Management Industry Revenue (Million) Forecast, by Application 2020 & 2033
- Table 36: Rest of Middle East & Africa US Digital Freight Management Industry Revenue (Million) Forecast, by Application 2020 & 2033
- Table 37: Global US Digital Freight Management Industry Revenue Million Forecast, by Mode of Transportation 2020 & 2033
- Table 38: Global US Digital Freight Management Industry Revenue Million Forecast, by Firm Type 2020 & 2033
- Table 39: Global US Digital Freight Management Industry Revenue Million Forecast, by Country 2020 & 2033
- Table 40: China US Digital Freight Management Industry Revenue (Million) Forecast, by Application 2020 & 2033
- Table 41: India US Digital Freight Management Industry Revenue (Million) Forecast, by Application 2020 & 2033
- Table 42: Japan US Digital Freight Management Industry Revenue (Million) Forecast, by Application 2020 & 2033
- Table 43: South Korea US Digital Freight Management Industry Revenue (Million) Forecast, by Application 2020 & 2033
- Table 44: ASEAN US Digital Freight Management Industry Revenue (Million) Forecast, by Application 2020 & 2033
- Table 45: Oceania US Digital Freight Management Industry Revenue (Million) Forecast, by Application 2020 & 2033
- Table 46: Rest of Asia Pacific US Digital Freight Management Industry Revenue (Million) Forecast, by Application 2020 & 2033
Frequently Asked Questions
1. What is the projected Compound Annual Growth Rate (CAGR) of the US Digital Freight Management Industry?
The projected CAGR is approximately 21.72%.
2. Which companies are prominent players in the US Digital Freight Management Industry?
Key companies in the market include Flexport, Kuehne + Nagel International (KN Freight Net), Uber Freight, Forto, DHL Group, Agility Logistics Pvt Ltd, Expeditors International, InstaFreight, Turvo, iContainers, Twill, NYSHEX, Transporteca, uShip**List Not Exhaustive, Convoy, Kontainers.
3. What are the main segments of the US Digital Freight Management Industry?
The market segments include Mode of Transportation, Firm Type.
4. Can you provide details about the market size?
The market size is estimated to be USD 6.89 Million as of 2022.
5. What are some drivers contributing to market growth?
4.; PHARMACEUTICAL INDUSTRY GROWTH4.; RISING FRESH PRODUCE IMPORTS FROM MEXICO4.; INCREASING POPULARITY OF FROZEN FOODS.
6. What are the notable trends driving market growth?
E- Commerce is driving the market.
7. Are there any restraints impacting market growth?
4.; EMISSIONS FROM COLD CHAIN OPERATIONS4.; LABOUR SHORTAGES.
8. Can you provide examples of recent developments in the market?
October 2022: Transplace and Uber Freight just completed their merger. It will bring all lower-tier carriers together under the banner of "the world's largest network demand platform meeting the world's largest supply platform," enabling them to benefit from the technological advancement necessary to participate in the global network platform.
9. What pricing options are available for accessing the report?
Pricing options include single-user, multi-user, and enterprise licenses priced at USD 3800, USD 4500, and USD 5800 respectively.
10. Is the market size provided in terms of value or volume?
The market size is provided in terms of value, measured in Million.
11. Are there any specific market keywords associated with the report?
Yes, the market keyword associated with the report is "US Digital Freight Management Industry," which aids in identifying and referencing the specific market segment covered.
12. How do I determine which pricing option suits my needs best?
The pricing options vary based on user requirements and access needs. Individual users may opt for single-user licenses, while businesses requiring broader access may choose multi-user or enterprise licenses for cost-effective access to the report.
13. Are there any additional resources or data provided in the US Digital Freight Management Industry report?
While the report offers comprehensive insights, it's advisable to review the specific contents or supplementary materials provided to ascertain if additional resources or data are available.
14. How can I stay updated on further developments or reports in the US Digital Freight Management Industry?
To stay informed about further developments, trends, and reports in the US Digital Freight Management Industry, consider subscribing to industry newsletters, following relevant companies and organizations, or regularly checking reputable industry news sources and publications.
Methodology
Step 1 - Identification of Relevant Samples Size from Population Database


Step 2 - Approaches for Defining Global Market Size (Value, Volume* & Price*)

Note*: In applicable scenarios
Step 3 - Data Sources
Primary Research
- Web Analytics
- Survey Reports
- Research Institute
- Latest Research Reports
- Opinion Leaders
Secondary Research
- Annual Reports
- White Paper
- Latest Press Release
- Industry Association
- Paid Database
- Investor Presentations

Step 4 - Data Triangulation
Involves using different sources of information in order to increase the validity of a study
These sources are likely to be stakeholders in a program - participants, other researchers, program staff, other community members, and so on.
Then we put all data in single framework & apply various statistical tools to find out the dynamic on the market.
During the analysis stage, feedback from the stakeholder groups would be compared to determine areas of agreement as well as areas of divergence