

Key Insights
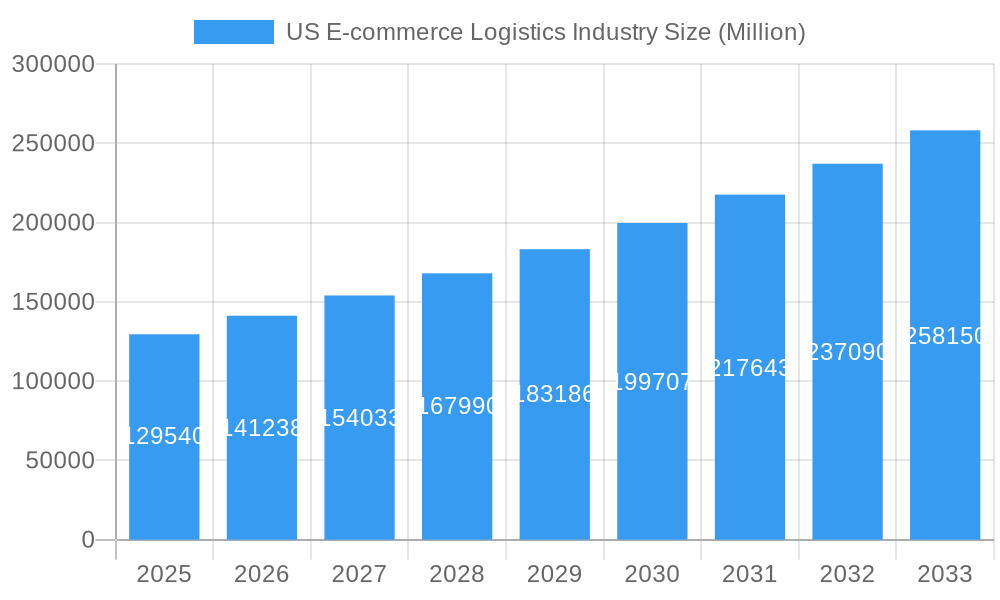
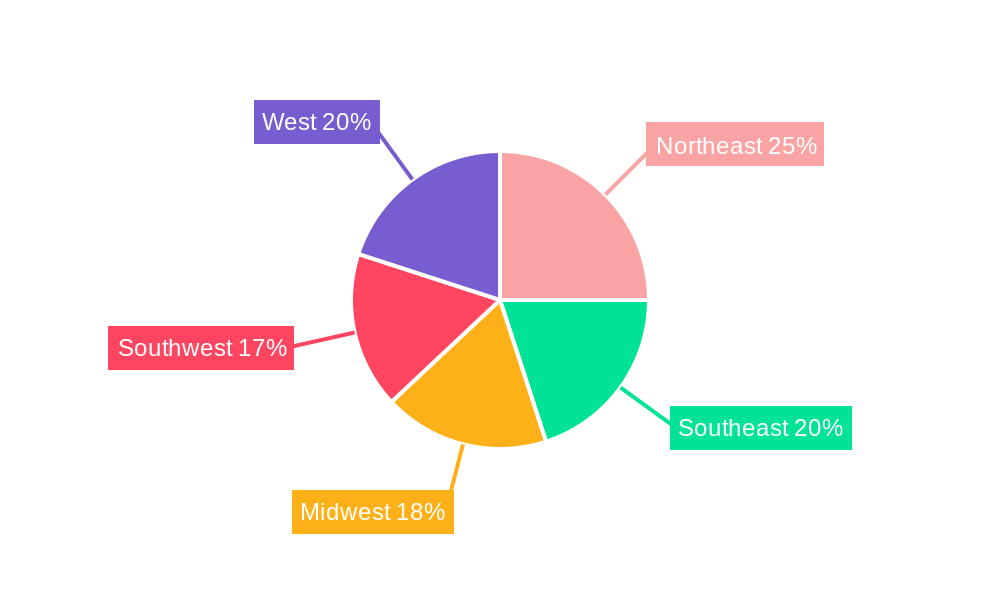
The US e-commerce logistics industry is experiencing robust growth, fueled by the increasing popularity of online shopping and the expanding digital economy. The market, valued at $129.54 billion in 2025, is projected to maintain a compound annual growth rate (CAGR) of 8.90% from 2025 to 2033, indicating significant future expansion. Key drivers include the rising demand for faster and more efficient delivery options, the increasing adoption of advanced technologies like AI and automation in warehousing and transportation, and the growing preference for omnichannel fulfillment strategies. The industry is segmented by service type (transportation, warehousing, value-added services), business model (B2B, B2C), destination (domestic, international), and product category (fashion, electronics, home appliances, etc.). While the dominance of major players like FedEx, UPS, and DHL is undeniable, smaller specialized logistics providers catering to niche e-commerce segments are also gaining traction. Growth is particularly strong in the value-added services segment, as businesses increasingly seek customized solutions like labeling, packaging, and returns management to enhance the customer experience. Regional variations exist, with the Northeast, West, and Southeast regions likely exhibiting higher growth rates due to dense populations and established e-commerce infrastructure. However, growth in the Midwest and Southwest regions is expected to accelerate in the coming years as e-commerce penetration deepens in these areas. Restraints include rising fuel costs, labor shortages, and the challenges of maintaining sustainable and environmentally friendly operations.
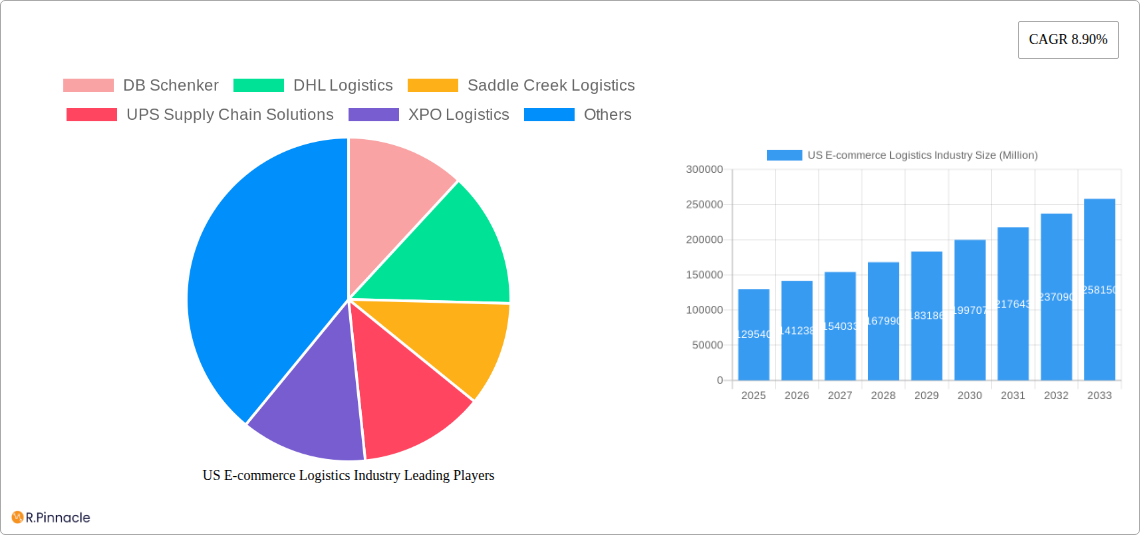
US E-commerce Logistics Industry Market Size (In Billion)
The competitive landscape is dynamic, with established players continuously investing in infrastructure upgrades and technology integration to stay ahead. The industry is likely to witness further consolidation through mergers and acquisitions, as companies strive to optimize their operations and expand their service offerings. The future will be characterized by increased reliance on data analytics, real-time tracking, and predictive modeling to improve efficiency and responsiveness. Strategic partnerships between logistics providers and e-commerce retailers are expected to become increasingly prevalent to create seamless and cost-effective supply chains. The focus on last-mile delivery optimization, driven by consumer demand for same-day or next-day delivery, presents significant opportunities and challenges for logistics companies. Innovative solutions like drone delivery and autonomous vehicles are being explored to address the growing complexities and costs associated with last-mile logistics.
US E-commerce Logistics Industry Company Market Share
US E-commerce Logistics Industry Report: 2019-2033
This comprehensive report provides a detailed analysis of the US e-commerce logistics industry, offering invaluable insights for industry professionals, investors, and strategists. We analyze market trends, competitive dynamics, and future growth projections, covering the period from 2019 to 2033, with a focus on 2025. The report features in-depth segmentations and profiles of key players, equipping you with the knowledge needed to navigate this dynamic sector. The US e-commerce logistics market is projected to reach $XX Million by 2033, exhibiting a CAGR of XX% during the forecast period (2025-2033).
US E-commerce Logistics Industry Market Structure & Innovation Trends
The US e-commerce logistics industry is characterized by a moderately concentrated market structure, with a few dominant players and numerous smaller niche providers. Key players such as DB Schenker, DHL Logistics, Saddle Creek Logistics, UPS Supply Chain Solutions, XPO Logistics, Rakuten Super Logistics, FedEx, Geodis Logistics, Kenco Logistics Services, and Kuehne and Nagel Logistics hold significant market share. However, the market also features numerous smaller specialized logistics providers catering to specific e-commerce niches.
Market share is dynamic, with ongoing M&A activity influencing the competitive landscape. Recent M&A deals have involved valuations ranging from $XX Million to $XX Million, driven by the need for scale, technological capabilities, and expanded service offerings.
- Innovation Drivers: Automation (robotics, AI), sustainable logistics solutions, data analytics for supply chain optimization.
- Regulatory Frameworks: Compliance with federal and state regulations (e.g., transportation, data privacy).
- Product Substitutes: Increased competition from alternative delivery models (e.g., crowdsourced delivery).
- End-User Demographics: Growth driven by increasing online shopping across diverse demographics.
US E-commerce Logistics Industry Market Dynamics & Trends
The US e-commerce logistics market is experiencing robust and accelerating growth, propelled by a confluence of powerful economic and behavioral shifts. The undeniable ascendancy of online shopping, fueled by consumers' unwavering demand for unparalleled convenience, extensive product selections, and the ease of home delivery, stands as a primary catalyst. Simultaneously, rapid technological advancements are fundamentally reshaping the logistics landscape. The widespread adoption of intelligent automation, sophisticated artificial intelligence (AI) algorithms, and advanced data analytics is revolutionizing operational efficiencies, driving down costs, and enabling more predictive and proactive supply chain management. Furthermore, evolving consumer expectations, characterized by an insatiable appetite for expedited delivery services—ranging from same-day to next-day fulfillment—and a demand for flexible delivery options, are setting new industry benchmarks and compelling innovative solutions. The competitive arena is intensifying, with leading companies making substantial investments in cutting-edge technology and expanding their physical infrastructure to secure and maintain a significant competitive advantage. Projections indicate continued strong performance, with an anticipated Compound Annual Growth Rate (CAGR) of XX% between 2025 and 2033, and market penetration poised to exceed XX% by the conclusion of this period. This upward trajectory is further bolstered by significant investments in last-mile delivery solutions, crucial for bridging the gap between fulfillment centers and the end consumer, and the aggressive expansion of e-commerce into an ever-widening array of product categories. The strategic imperative of omnichannel retail, demanding seamless integration and consistent customer experiences across all sales channels, also acts as a powerful engine for market expansion.
Dominant Regions & Segments in US E-commerce Logistics Industry
The US e-commerce logistics market shows regional variations in growth. Major metropolitan areas with high population density and robust e-commerce activity, such as the Northeast, West Coast, and Texas, are expected to dominate the market. The dominance of specific segments is analyzed below:
By Service:
- Transportation: Dominated by major carriers like FedEx, UPS, and DHL, focusing on last-mile delivery optimization and efficient route planning.
- Warehousing & Inventory Management: Growing demand for efficient warehousing and inventory management solutions, leading to increased investment in automated warehouses and advanced inventory tracking systems.
- Value-added services: Rapid growth in demand for value-added services like labeling, packaging, and returns management, driven by the need for enhanced customer experience and optimized supply chains.
By Business:
- B2C: This segment accounts for a larger share of the market due to the explosive growth of online retail and direct-to-consumer brands.
- B2B: This segment shows steady growth driven by the increasing adoption of e-procurement and online wholesale platforms.
By Destination:
- Domestic: This segment holds the largest market share due to the high volume of intra-US e-commerce transactions.
- International/Cross-border: Growing demand for international shipping services, driven by cross-border e-commerce expansion.
By Product:
- Fashion & Apparel: High growth fueled by online fashion retailers and a preference for online shopping for clothing and accessories.
- Consumer Electronics: Strong growth due to the popularity of online purchasing of electronic devices. Other segments like home appliances, furniture, beauty and personal care products, and other products also show significant growth, driven by increased online retail penetration.
Key Drivers:
- Robust e-commerce growth, increased consumer spending, expanding internet and smartphone penetration, and supportive government policies.
US E-commerce Logistics Industry Product Innovations
The US e-commerce logistics industry is at the forefront of a wave of groundbreaking product innovations, largely driven by transformative technological advancements. Automated systems, encompassing Robotic Process Automation (RPA) and intelligent AI-driven solutions, are revolutionizing warehouse management by optimizing inventory handling, streamlining order fulfillment, and significantly enhancing overall operational efficiency while concurrently reducing labor-related expenses. The pervasive integration of Internet of Things (IoT) devices is enabling real-time, granular tracking and monitoring of shipments throughout their journey, vastly improving supply chain visibility and contributing to faster, more reliable delivery times. The critical domain of last-mile delivery is witnessing particularly dramatic innovation, with the exploration and implementation of advanced solutions such as drone delivery for rapid urban fulfillment, the deployment of autonomous vehicles to enhance delivery efficiency and reduce human error, and the strategic establishment of micro-fulfillment centers in dense urban areas to overcome the complexities of last-mile logistics. These multifaceted innovations are collectively elevating the customer experience by ensuring quicker, more predictable, and increasingly seamless deliveries.
Report Scope & Segmentation Analysis
This comprehensive report delves into the dynamic US e-commerce logistics market, offering a granular analysis segmented across several key dimensions. Our segmentation includes: Service Type (encompassing crucial areas like transportation, warehousing, and value-added services), Business Type (differentiating between B2B and B2C operations), Destination (covering both domestic and international logistics), and Product Type (analyzing key categories such as fashion, electronics, home appliances, furniture, beauty products, and other emergent product lines). For each segment, the report provides detailed growth projections, precise market size estimations, and a thorough examination of the competitive dynamics at play. The overall scope of this report is to deliver robust market size estimations, accurate long-term growth forecasts, and an in-depth analysis of the pivotal trends and driving forces that are actively shaping the future trajectory of the US e-commerce logistics industry.
Key Drivers of US E-commerce Logistics Industry Growth
Several factors drive the growth of the US e-commerce logistics industry. Technological advancements, particularly in automation and data analytics, are boosting efficiency and reducing costs. The booming e-commerce market, fueled by increasing online shopping and consumer preference for convenience, is a primary driver. Government regulations supporting e-commerce and logistics infrastructure development also contribute to the industry's growth. For example, investments in improved transportation networks and warehouse facilities are essential for efficient logistics operations.
Challenges in the US E-commerce Logistics Industry Sector
The US e-commerce logistics industry, despite its impressive growth, is not without its significant challenges. Navigating a complex web of regulatory hurdles, including stringent compliance requirements and the ever-evolving landscape of transportation regulations, can pose substantial obstacles to operational fluidity and cost management. Furthermore, the industry remains susceptible to supply chain disruptions, ranging from critical labor shortages across various roles to constraints in transportation capacity, all of which can directly impact delivery timelines and escalate operational expenses. The landscape is also characterized by intense competition, fueled by the continuous entry of new, agile players and the ongoing consolidation of established companies. This competitive pressure places considerable strain on pricing strategies and profit margins. To effectively navigate these challenges and ensure sustained success, businesses within this dynamic market must embrace continuous innovation and implement agile, strategic adaptations.
Emerging Opportunities in US E-commerce Logistics Industry
The US e-commerce logistics industry is ripe with a multitude of emerging opportunities, signaling avenues for significant growth and innovation. The rapid evolution of omnichannel retail strategies creates substantial opportunities for logistics providers adept at offering fully integrated, end-to-end solutions that bridge the gap between online and offline customer touchpoints. The growing societal and corporate emphasis on sustainable logistics practices is opening doors for specialized providers focused on eco-friendly delivery options, reduced carbon footprints, and ethically sourced supply chains. Transformative technological advancements, particularly in areas like AI and machine learning, present unparalleled opportunities for optimizing delivery routes, predicting demand fluctuations, enhancing inventory management, and ultimately boosting overall operational efficiency. Moreover, the strategic expansion into underserved markets, reaching new customer bases previously excluded by logistical limitations, and the continued development of novel and efficient last-mile delivery solutions, are particularly promising avenues for substantial future growth and market differentiation.
Leading Players in the US E-commerce Logistics Industry Market
- DB Schenker
- DHL Logistics
- Saddle Creek Logistics
- UPS Supply Chain Solutions
- XPO Logistics
- Rakuten Super Logistics
- FedEx
- Geodis Logistics
- Kenco Logistics Services
- Kuehne and Nagel Logistics
- List Not Exhaustive
Key Developments in US E-commerce Logistics Industry
- August 2023: DHL eCommerce opened a new 352,000 sq ft distribution center in Melrose Park, Illinois, equipped with an automated sorter capable of handling 40,000 parcels per hour. This is part of a larger expansion plan involving 11 new/relocated warehouses, with seven more planned.
- April 2023: DHL Express launched GoGreen Plus, expanding sustainable business services for US SMEs by allowing customers to offset the carbon footprint of their shipments using Sustainable Aviation Fuel.
Future Outlook for US E-commerce Logistics Industry Market
The US e-commerce logistics market is poised for continued growth, driven by the expansion of e-commerce, technological advancements, and evolving consumer preferences. The increasing demand for faster and more efficient delivery options will drive innovation in last-mile delivery solutions and warehouse automation. Sustainable logistics practices will gain importance, creating opportunities for companies focusing on eco-friendly operations. Strategic partnerships and M&A activity will reshape the competitive landscape. The industry's future will be shaped by companies’ ability to adapt to changing consumer needs, embrace technological advancements, and operate efficiently in a complex and dynamic environment.
US E-commerce Logistics Industry Segmentation
-
1. Service
- 1.1. Transportation
- 1.2. Warehousing and Inventory management
- 1.3. Value-added services (Labeling, Packaging, etc)
-
2. Business
- 2.1. B2B
- 2.2. B2C
-
3. Destination
- 3.1. Domestic
- 3.2. International/cross-border
-
4. Product
- 4.1. Fashion and Apparel
- 4.2. Consumer Electronics
- 4.3. Home Appliances
- 4.4. Furniture
- 4.5. Beauty and Personal Care Products
- 4.6. Other Products (Toys, Food Products, etc.)
US E-commerce Logistics Industry Segmentation By Geography
-
1. North America
- 1.1. United States
- 1.2. Canada
- 1.3. Mexico
-
2. South America
- 2.1. Brazil
- 2.2. Argentina
- 2.3. Rest of South America
-
3. Europe
- 3.1. United Kingdom
- 3.2. Germany
- 3.3. France
- 3.4. Italy
- 3.5. Spain
- 3.6. Russia
- 3.7. Benelux
- 3.8. Nordics
- 3.9. Rest of Europe
-
4. Middle East & Africa
- 4.1. Turkey
- 4.2. Israel
- 4.3. GCC
- 4.4. North Africa
- 4.5. South Africa
- 4.6. Rest of Middle East & Africa
-
5. Asia Pacific
- 5.1. China
- 5.2. India
- 5.3. Japan
- 5.4. South Korea
- 5.5. ASEAN
- 5.6. Oceania
- 5.7. Rest of Asia Pacific
US E-commerce Logistics Industry Regional Market Share
Geographic Coverage of US E-commerce Logistics Industry
US E-commerce Logistics Industry REPORT HIGHLIGHTS
| Aspects | Details |
|---|---|
| Study Period | 2020-2034 |
| Base Year | 2025 |
| Estimated Year | 2026 |
| Forecast Period | 2026-2034 |
| Historical Period | 2020-2025 |
| Growth Rate | CAGR of 8.90% from 2020-2034 |
| Segmentation |
|
Table of Contents
- 1. Introduction
- 1.1. Research Scope
- 1.2. Market Segmentation
- 1.3. Research Objective
- 1.4. Definitions and Assumptions
- 2. Executive Summary
- 2.1. Market Snapshot
- 3. Market Dynamics
- 3.1. Market Drivers
- 3.2. Market Restrains
- 3.3. Market Trends
- 3.4. Market Opportunities
- 4. Market Factor Analysis
- 4.1. Porters Five Forces
- 4.1.1. Bargaining Power of Suppliers
- 4.1.2. Bargaining Power of Buyers
- 4.1.3. Threat of New Entrants
- 4.1.4. Threat of Substitutes
- 4.1.5. Competitive Rivalry
- 4.2. PESTEL analysis
- 4.3. BCG Analysis
- 4.3.1. Stars (High Growth, High Market Share)
- 4.3.2. Cash Cows (Low Growth, High Market Share)
- 4.3.3. Question Mark (High Growth, Low Market Share)
- 4.3.4. Dogs (Low Growth, Low Market Share)
- 4.4. Ansoff Matrix Analysis
- 4.5. Supply Chain Analysis
- 4.6. Regulatory Landscape
- 4.7. Current Market Potential and Opportunity Assessment (TAM–SAM–SOM Framework)
- 4.8. PRI Analyst Note
- 4.1. Porters Five Forces
- 5. Market Analysis, Insights and Forecast 2021-2033
- 5.1. Market Analysis, Insights and Forecast - by Service
- 5.1.1. Transportation
- 5.1.2. Warehousing and Inventory management
- 5.1.3. Value-added services (Labeling, Packaging, etc)
- 5.2. Market Analysis, Insights and Forecast - by Business
- 5.2.1. B2B
- 5.2.2. B2C
- 5.3. Market Analysis, Insights and Forecast - by Destination
- 5.3.1. Domestic
- 5.3.2. International/cross-border
- 5.4. Market Analysis, Insights and Forecast - by Product
- 5.4.1. Fashion and Apparel
- 5.4.2. Consumer Electronics
- 5.4.3. Home Appliances
- 5.4.4. Furniture
- 5.4.5. Beauty and Personal Care Products
- 5.4.6. Other Products (Toys, Food Products, etc.)
- 5.5. Market Analysis, Insights and Forecast - by Region
- 5.5.1. North America
- 5.5.2. South America
- 5.5.3. Europe
- 5.5.4. Middle East & Africa
- 5.5.5. Asia Pacific
- 5.1. Market Analysis, Insights and Forecast - by Service
- 6. Global US E-commerce Logistics Industry Analysis, Insights and Forecast, 2021-2033
- 6.1. Market Analysis, Insights and Forecast - by Service
- 6.1.1. Transportation
- 6.1.2. Warehousing and Inventory management
- 6.1.3. Value-added services (Labeling, Packaging, etc)
- 6.2. Market Analysis, Insights and Forecast - by Business
- 6.2.1. B2B
- 6.2.2. B2C
- 6.3. Market Analysis, Insights and Forecast - by Destination
- 6.3.1. Domestic
- 6.3.2. International/cross-border
- 6.4. Market Analysis, Insights and Forecast - by Product
- 6.4.1. Fashion and Apparel
- 6.4.2. Consumer Electronics
- 6.4.3. Home Appliances
- 6.4.4. Furniture
- 6.4.5. Beauty and Personal Care Products
- 6.4.6. Other Products (Toys, Food Products, etc.)
- 6.1. Market Analysis, Insights and Forecast - by Service
- 7. North America US E-commerce Logistics Industry Analysis, Insights and Forecast, 2020-2032
- 7.1. Market Analysis, Insights and Forecast - by Service
- 7.1.1. Transportation
- 7.1.2. Warehousing and Inventory management
- 7.1.3. Value-added services (Labeling, Packaging, etc)
- 7.2. Market Analysis, Insights and Forecast - by Business
- 7.2.1. B2B
- 7.2.2. B2C
- 7.3. Market Analysis, Insights and Forecast - by Destination
- 7.3.1. Domestic
- 7.3.2. International/cross-border
- 7.4. Market Analysis, Insights and Forecast - by Product
- 7.4.1. Fashion and Apparel
- 7.4.2. Consumer Electronics
- 7.4.3. Home Appliances
- 7.4.4. Furniture
- 7.4.5. Beauty and Personal Care Products
- 7.4.6. Other Products (Toys, Food Products, etc.)
- 7.1. Market Analysis, Insights and Forecast - by Service
- 8. South America US E-commerce Logistics Industry Analysis, Insights and Forecast, 2020-2032
- 8.1. Market Analysis, Insights and Forecast - by Service
- 8.1.1. Transportation
- 8.1.2. Warehousing and Inventory management
- 8.1.3. Value-added services (Labeling, Packaging, etc)
- 8.2. Market Analysis, Insights and Forecast - by Business
- 8.2.1. B2B
- 8.2.2. B2C
- 8.3. Market Analysis, Insights and Forecast - by Destination
- 8.3.1. Domestic
- 8.3.2. International/cross-border
- 8.4. Market Analysis, Insights and Forecast - by Product
- 8.4.1. Fashion and Apparel
- 8.4.2. Consumer Electronics
- 8.4.3. Home Appliances
- 8.4.4. Furniture
- 8.4.5. Beauty and Personal Care Products
- 8.4.6. Other Products (Toys, Food Products, etc.)
- 8.1. Market Analysis, Insights and Forecast - by Service
- 9. Europe US E-commerce Logistics Industry Analysis, Insights and Forecast, 2020-2032
- 9.1. Market Analysis, Insights and Forecast - by Service
- 9.1.1. Transportation
- 9.1.2. Warehousing and Inventory management
- 9.1.3. Value-added services (Labeling, Packaging, etc)
- 9.2. Market Analysis, Insights and Forecast - by Business
- 9.2.1. B2B
- 9.2.2. B2C
- 9.3. Market Analysis, Insights and Forecast - by Destination
- 9.3.1. Domestic
- 9.3.2. International/cross-border
- 9.4. Market Analysis, Insights and Forecast - by Product
- 9.4.1. Fashion and Apparel
- 9.4.2. Consumer Electronics
- 9.4.3. Home Appliances
- 9.4.4. Furniture
- 9.4.5. Beauty and Personal Care Products
- 9.4.6. Other Products (Toys, Food Products, etc.)
- 9.1. Market Analysis, Insights and Forecast - by Service
- 10. Middle East & Africa US E-commerce Logistics Industry Analysis, Insights and Forecast, 2020-2032
- 10.1. Market Analysis, Insights and Forecast - by Service
- 10.1.1. Transportation
- 10.1.2. Warehousing and Inventory management
- 10.1.3. Value-added services (Labeling, Packaging, etc)
- 10.2. Market Analysis, Insights and Forecast - by Business
- 10.2.1. B2B
- 10.2.2. B2C
- 10.3. Market Analysis, Insights and Forecast - by Destination
- 10.3.1. Domestic
- 10.3.2. International/cross-border
- 10.4. Market Analysis, Insights and Forecast - by Product
- 10.4.1. Fashion and Apparel
- 10.4.2. Consumer Electronics
- 10.4.3. Home Appliances
- 10.4.4. Furniture
- 10.4.5. Beauty and Personal Care Products
- 10.4.6. Other Products (Toys, Food Products, etc.)
- 10.1. Market Analysis, Insights and Forecast - by Service
- 11. Asia Pacific US E-commerce Logistics Industry Analysis, Insights and Forecast, 2020-2032
- 11.1. Market Analysis, Insights and Forecast - by Service
- 11.1.1. Transportation
- 11.1.2. Warehousing and Inventory management
- 11.1.3. Value-added services (Labeling, Packaging, etc)
- 11.2. Market Analysis, Insights and Forecast - by Business
- 11.2.1. B2B
- 11.2.2. B2C
- 11.3. Market Analysis, Insights and Forecast - by Destination
- 11.3.1. Domestic
- 11.3.2. International/cross-border
- 11.4. Market Analysis, Insights and Forecast - by Product
- 11.4.1. Fashion and Apparel
- 11.4.2. Consumer Electronics
- 11.4.3. Home Appliances
- 11.4.4. Furniture
- 11.4.5. Beauty and Personal Care Products
- 11.4.6. Other Products (Toys, Food Products, etc.)
- 11.1. Market Analysis, Insights and Forecast - by Service
- 12. Competitive Analysis
- 12.1. Company Profiles
- 12.1.1 DB Schenker
- 12.1.1.1. Company Overview
- 12.1.1.2. Products
- 12.1.1.3. Company Financials
- 12.1.1.4. SWOT Analysis
- 12.1.2 DHL Logistics
- 12.1.2.1. Company Overview
- 12.1.2.2. Products
- 12.1.2.3. Company Financials
- 12.1.2.4. SWOT Analysis
- 12.1.3 Saddle Creek Logistics
- 12.1.3.1. Company Overview
- 12.1.3.2. Products
- 12.1.3.3. Company Financials
- 12.1.3.4. SWOT Analysis
- 12.1.4 UPS Supply Chain Solutions
- 12.1.4.1. Company Overview
- 12.1.4.2. Products
- 12.1.4.3. Company Financials
- 12.1.4.4. SWOT Analysis
- 12.1.5 XPO Logistics
- 12.1.5.1. Company Overview
- 12.1.5.2. Products
- 12.1.5.3. Company Financials
- 12.1.5.4. SWOT Analysis
- 12.1.6 Rakuten Super Logistics
- 12.1.6.1. Company Overview
- 12.1.6.2. Products
- 12.1.6.3. Company Financials
- 12.1.6.4. SWOT Analysis
- 12.1.7 FedEx
- 12.1.7.1. Company Overview
- 12.1.7.2. Products
- 12.1.7.3. Company Financials
- 12.1.7.4. SWOT Analysis
- 12.1.8 Geodis Logistics
- 12.1.8.1. Company Overview
- 12.1.8.2. Products
- 12.1.8.3. Company Financials
- 12.1.8.4. SWOT Analysis
- 12.1.9 Kenco Logistics Services
- 12.1.9.1. Company Overview
- 12.1.9.2. Products
- 12.1.9.3. Company Financials
- 12.1.9.4. SWOT Analysis
- 12.1.10 Kuehne and Nagel Logistics**List Not Exhaustive
- 12.1.10.1. Company Overview
- 12.1.10.2. Products
- 12.1.10.3. Company Financials
- 12.1.10.4. SWOT Analysis
- 12.1.1 DB Schenker
- 12.2. Market Entropy
- 12.2.1 Company's Key Areas Served
- 12.2.2 Recent Developments
- 12.3. Company Market Share Analysis 2025
- 12.3.1 Top 5 Companies Market Share Analysis
- 12.3.2 Top 3 Companies Market Share Analysis
- 12.4. List of Potential Customers
- 13. Research Methodology
List of Figures
- Figure 1: Global US E-commerce Logistics Industry Revenue Breakdown (Million, %) by Region 2025 & 2033
- Figure 2: North America US E-commerce Logistics Industry Revenue (Million), by Service 2025 & 2033
- Figure 3: North America US E-commerce Logistics Industry Revenue Share (%), by Service 2025 & 2033
- Figure 4: North America US E-commerce Logistics Industry Revenue (Million), by Business 2025 & 2033
- Figure 5: North America US E-commerce Logistics Industry Revenue Share (%), by Business 2025 & 2033
- Figure 6: North America US E-commerce Logistics Industry Revenue (Million), by Destination 2025 & 2033
- Figure 7: North America US E-commerce Logistics Industry Revenue Share (%), by Destination 2025 & 2033
- Figure 8: North America US E-commerce Logistics Industry Revenue (Million), by Product 2025 & 2033
- Figure 9: North America US E-commerce Logistics Industry Revenue Share (%), by Product 2025 & 2033
- Figure 10: North America US E-commerce Logistics Industry Revenue (Million), by Country 2025 & 2033
- Figure 11: North America US E-commerce Logistics Industry Revenue Share (%), by Country 2025 & 2033
- Figure 12: South America US E-commerce Logistics Industry Revenue (Million), by Service 2025 & 2033
- Figure 13: South America US E-commerce Logistics Industry Revenue Share (%), by Service 2025 & 2033
- Figure 14: South America US E-commerce Logistics Industry Revenue (Million), by Business 2025 & 2033
- Figure 15: South America US E-commerce Logistics Industry Revenue Share (%), by Business 2025 & 2033
- Figure 16: South America US E-commerce Logistics Industry Revenue (Million), by Destination 2025 & 2033
- Figure 17: South America US E-commerce Logistics Industry Revenue Share (%), by Destination 2025 & 2033
- Figure 18: South America US E-commerce Logistics Industry Revenue (Million), by Product 2025 & 2033
- Figure 19: South America US E-commerce Logistics Industry Revenue Share (%), by Product 2025 & 2033
- Figure 20: South America US E-commerce Logistics Industry Revenue (Million), by Country 2025 & 2033
- Figure 21: South America US E-commerce Logistics Industry Revenue Share (%), by Country 2025 & 2033
- Figure 22: Europe US E-commerce Logistics Industry Revenue (Million), by Service 2025 & 2033
- Figure 23: Europe US E-commerce Logistics Industry Revenue Share (%), by Service 2025 & 2033
- Figure 24: Europe US E-commerce Logistics Industry Revenue (Million), by Business 2025 & 2033
- Figure 25: Europe US E-commerce Logistics Industry Revenue Share (%), by Business 2025 & 2033
- Figure 26: Europe US E-commerce Logistics Industry Revenue (Million), by Destination 2025 & 2033
- Figure 27: Europe US E-commerce Logistics Industry Revenue Share (%), by Destination 2025 & 2033
- Figure 28: Europe US E-commerce Logistics Industry Revenue (Million), by Product 2025 & 2033
- Figure 29: Europe US E-commerce Logistics Industry Revenue Share (%), by Product 2025 & 2033
- Figure 30: Europe US E-commerce Logistics Industry Revenue (Million), by Country 2025 & 2033
- Figure 31: Europe US E-commerce Logistics Industry Revenue Share (%), by Country 2025 & 2033
- Figure 32: Middle East & Africa US E-commerce Logistics Industry Revenue (Million), by Service 2025 & 2033
- Figure 33: Middle East & Africa US E-commerce Logistics Industry Revenue Share (%), by Service 2025 & 2033
- Figure 34: Middle East & Africa US E-commerce Logistics Industry Revenue (Million), by Business 2025 & 2033
- Figure 35: Middle East & Africa US E-commerce Logistics Industry Revenue Share (%), by Business 2025 & 2033
- Figure 36: Middle East & Africa US E-commerce Logistics Industry Revenue (Million), by Destination 2025 & 2033
- Figure 37: Middle East & Africa US E-commerce Logistics Industry Revenue Share (%), by Destination 2025 & 2033
- Figure 38: Middle East & Africa US E-commerce Logistics Industry Revenue (Million), by Product 2025 & 2033
- Figure 39: Middle East & Africa US E-commerce Logistics Industry Revenue Share (%), by Product 2025 & 2033
- Figure 40: Middle East & Africa US E-commerce Logistics Industry Revenue (Million), by Country 2025 & 2033
- Figure 41: Middle East & Africa US E-commerce Logistics Industry Revenue Share (%), by Country 2025 & 2033
- Figure 42: Asia Pacific US E-commerce Logistics Industry Revenue (Million), by Service 2025 & 2033
- Figure 43: Asia Pacific US E-commerce Logistics Industry Revenue Share (%), by Service 2025 & 2033
- Figure 44: Asia Pacific US E-commerce Logistics Industry Revenue (Million), by Business 2025 & 2033
- Figure 45: Asia Pacific US E-commerce Logistics Industry Revenue Share (%), by Business 2025 & 2033
- Figure 46: Asia Pacific US E-commerce Logistics Industry Revenue (Million), by Destination 2025 & 2033
- Figure 47: Asia Pacific US E-commerce Logistics Industry Revenue Share (%), by Destination 2025 & 2033
- Figure 48: Asia Pacific US E-commerce Logistics Industry Revenue (Million), by Product 2025 & 2033
- Figure 49: Asia Pacific US E-commerce Logistics Industry Revenue Share (%), by Product 2025 & 2033
- Figure 50: Asia Pacific US E-commerce Logistics Industry Revenue (Million), by Country 2025 & 2033
- Figure 51: Asia Pacific US E-commerce Logistics Industry Revenue Share (%), by Country 2025 & 2033
List of Tables
- Table 1: Global US E-commerce Logistics Industry Revenue Million Forecast, by Service 2020 & 2033
- Table 2: Global US E-commerce Logistics Industry Revenue Million Forecast, by Business 2020 & 2033
- Table 3: Global US E-commerce Logistics Industry Revenue Million Forecast, by Destination 2020 & 2033
- Table 4: Global US E-commerce Logistics Industry Revenue Million Forecast, by Product 2020 & 2033
- Table 5: Global US E-commerce Logistics Industry Revenue Million Forecast, by Region 2020 & 2033
- Table 6: Global US E-commerce Logistics Industry Revenue Million Forecast, by Service 2020 & 2033
- Table 7: Global US E-commerce Logistics Industry Revenue Million Forecast, by Business 2020 & 2033
- Table 8: Global US E-commerce Logistics Industry Revenue Million Forecast, by Destination 2020 & 2033
- Table 9: Global US E-commerce Logistics Industry Revenue Million Forecast, by Product 2020 & 2033
- Table 10: Global US E-commerce Logistics Industry Revenue Million Forecast, by Country 2020 & 2033
- Table 11: United States US E-commerce Logistics Industry Revenue (Million) Forecast, by Application 2020 & 2033
- Table 12: Canada US E-commerce Logistics Industry Revenue (Million) Forecast, by Application 2020 & 2033
- Table 13: Mexico US E-commerce Logistics Industry Revenue (Million) Forecast, by Application 2020 & 2033
- Table 14: Global US E-commerce Logistics Industry Revenue Million Forecast, by Service 2020 & 2033
- Table 15: Global US E-commerce Logistics Industry Revenue Million Forecast, by Business 2020 & 2033
- Table 16: Global US E-commerce Logistics Industry Revenue Million Forecast, by Destination 2020 & 2033
- Table 17: Global US E-commerce Logistics Industry Revenue Million Forecast, by Product 2020 & 2033
- Table 18: Global US E-commerce Logistics Industry Revenue Million Forecast, by Country 2020 & 2033
- Table 19: Brazil US E-commerce Logistics Industry Revenue (Million) Forecast, by Application 2020 & 2033
- Table 20: Argentina US E-commerce Logistics Industry Revenue (Million) Forecast, by Application 2020 & 2033
- Table 21: Rest of South America US E-commerce Logistics Industry Revenue (Million) Forecast, by Application 2020 & 2033
- Table 22: Global US E-commerce Logistics Industry Revenue Million Forecast, by Service 2020 & 2033
- Table 23: Global US E-commerce Logistics Industry Revenue Million Forecast, by Business 2020 & 2033
- Table 24: Global US E-commerce Logistics Industry Revenue Million Forecast, by Destination 2020 & 2033
- Table 25: Global US E-commerce Logistics Industry Revenue Million Forecast, by Product 2020 & 2033
- Table 26: Global US E-commerce Logistics Industry Revenue Million Forecast, by Country 2020 & 2033
- Table 27: United Kingdom US E-commerce Logistics Industry Revenue (Million) Forecast, by Application 2020 & 2033
- Table 28: Germany US E-commerce Logistics Industry Revenue (Million) Forecast, by Application 2020 & 2033
- Table 29: France US E-commerce Logistics Industry Revenue (Million) Forecast, by Application 2020 & 2033
- Table 30: Italy US E-commerce Logistics Industry Revenue (Million) Forecast, by Application 2020 & 2033
- Table 31: Spain US E-commerce Logistics Industry Revenue (Million) Forecast, by Application 2020 & 2033
- Table 32: Russia US E-commerce Logistics Industry Revenue (Million) Forecast, by Application 2020 & 2033
- Table 33: Benelux US E-commerce Logistics Industry Revenue (Million) Forecast, by Application 2020 & 2033
- Table 34: Nordics US E-commerce Logistics Industry Revenue (Million) Forecast, by Application 2020 & 2033
- Table 35: Rest of Europe US E-commerce Logistics Industry Revenue (Million) Forecast, by Application 2020 & 2033
- Table 36: Global US E-commerce Logistics Industry Revenue Million Forecast, by Service 2020 & 2033
- Table 37: Global US E-commerce Logistics Industry Revenue Million Forecast, by Business 2020 & 2033
- Table 38: Global US E-commerce Logistics Industry Revenue Million Forecast, by Destination 2020 & 2033
- Table 39: Global US E-commerce Logistics Industry Revenue Million Forecast, by Product 2020 & 2033
- Table 40: Global US E-commerce Logistics Industry Revenue Million Forecast, by Country 2020 & 2033
- Table 41: Turkey US E-commerce Logistics Industry Revenue (Million) Forecast, by Application 2020 & 2033
- Table 42: Israel US E-commerce Logistics Industry Revenue (Million) Forecast, by Application 2020 & 2033
- Table 43: GCC US E-commerce Logistics Industry Revenue (Million) Forecast, by Application 2020 & 2033
- Table 44: North Africa US E-commerce Logistics Industry Revenue (Million) Forecast, by Application 2020 & 2033
- Table 45: South Africa US E-commerce Logistics Industry Revenue (Million) Forecast, by Application 2020 & 2033
- Table 46: Rest of Middle East & Africa US E-commerce Logistics Industry Revenue (Million) Forecast, by Application 2020 & 2033
- Table 47: Global US E-commerce Logistics Industry Revenue Million Forecast, by Service 2020 & 2033
- Table 48: Global US E-commerce Logistics Industry Revenue Million Forecast, by Business 2020 & 2033
- Table 49: Global US E-commerce Logistics Industry Revenue Million Forecast, by Destination 2020 & 2033
- Table 50: Global US E-commerce Logistics Industry Revenue Million Forecast, by Product 2020 & 2033
- Table 51: Global US E-commerce Logistics Industry Revenue Million Forecast, by Country 2020 & 2033
- Table 52: China US E-commerce Logistics Industry Revenue (Million) Forecast, by Application 2020 & 2033
- Table 53: India US E-commerce Logistics Industry Revenue (Million) Forecast, by Application 2020 & 2033
- Table 54: Japan US E-commerce Logistics Industry Revenue (Million) Forecast, by Application 2020 & 2033
- Table 55: South Korea US E-commerce Logistics Industry Revenue (Million) Forecast, by Application 2020 & 2033
- Table 56: ASEAN US E-commerce Logistics Industry Revenue (Million) Forecast, by Application 2020 & 2033
- Table 57: Oceania US E-commerce Logistics Industry Revenue (Million) Forecast, by Application 2020 & 2033
- Table 58: Rest of Asia Pacific US E-commerce Logistics Industry Revenue (Million) Forecast, by Application 2020 & 2033
Frequently Asked Questions
1. What is the projected Compound Annual Growth Rate (CAGR) of the US E-commerce Logistics Industry?
The projected CAGR is approximately 8.90%.
2. Which companies are prominent players in the US E-commerce Logistics Industry?
Key companies in the market include DB Schenker, DHL Logistics, Saddle Creek Logistics, UPS Supply Chain Solutions, XPO Logistics, Rakuten Super Logistics, FedEx, Geodis Logistics, Kenco Logistics Services, Kuehne and Nagel Logistics**List Not Exhaustive.
3. What are the main segments of the US E-commerce Logistics Industry?
The market segments include Service, Business, Destination, Product.
4. Can you provide details about the market size?
The market size is estimated to be USD 129.54 Million as of 2022.
5. What are some drivers contributing to market growth?
Rise In Cross Border Logistics; Upgrade e-commerce with new supply chain technology.
6. What are the notable trends driving market growth?
Upgrade e-commerce with new supply chain technology.
7. Are there any restraints impacting market growth?
Supply Chain Disruptions; Warehousing and Inventory management.
8. Can you provide examples of recent developments in the market?
August 2023: A new distribution center has been opened by DHL eCommerce as part of its five-year strategic growth plan. The new facility, located in the city of Melrose Park in Illinois, encompasses a total area of 352,000 square feet. In addition to capacity enhancement, the facility is equipped with an Automated Honeywell Cross-belt Loop Sorter, which is capable of handling up to forty thousand parcels and packages an hour. As part of the logistics provider's recent expansion, 11 warehouses have been constructed or relocated, and seven more are expected to be finished at some point in the near future, as reported by the sources.
9. What pricing options are available for accessing the report?
Pricing options include single-user, multi-user, and enterprise licenses priced at USD 3800, USD 4500, and USD 5800 respectively.
10. Is the market size provided in terms of value or volume?
The market size is provided in terms of value, measured in Million.
11. Are there any specific market keywords associated with the report?
Yes, the market keyword associated with the report is "US E-commerce Logistics Industry," which aids in identifying and referencing the specific market segment covered.
12. How do I determine which pricing option suits my needs best?
The pricing options vary based on user requirements and access needs. Individual users may opt for single-user licenses, while businesses requiring broader access may choose multi-user or enterprise licenses for cost-effective access to the report.
13. Are there any additional resources or data provided in the US E-commerce Logistics Industry report?
While the report offers comprehensive insights, it's advisable to review the specific contents or supplementary materials provided to ascertain if additional resources or data are available.
14. How can I stay updated on further developments or reports in the US E-commerce Logistics Industry?
To stay informed about further developments, trends, and reports in the US E-commerce Logistics Industry, consider subscribing to industry newsletters, following relevant companies and organizations, or regularly checking reputable industry news sources and publications.
Methodology
Step 1 - Identification of Relevant Samples Size from Population Database


Step 2 - Approaches for Defining Global Market Size (Value, Volume* & Price*)

Note*: In applicable scenarios
Step 3 - Data Sources
Primary Research
- Web Analytics
- Survey Reports
- Research Institute
- Latest Research Reports
- Opinion Leaders
Secondary Research
- Annual Reports
- White Paper
- Latest Press Release
- Industry Association
- Paid Database
- Investor Presentations

Step 4 - Data Triangulation
Involves using different sources of information in order to increase the validity of a study
These sources are likely to be stakeholders in a program - participants, other researchers, program staff, other community members, and so on.
Then we put all data in single framework & apply various statistical tools to find out the dynamic on the market.
During the analysis stage, feedback from the stakeholder groups would be compared to determine areas of agreement as well as areas of divergence