
Key Insights
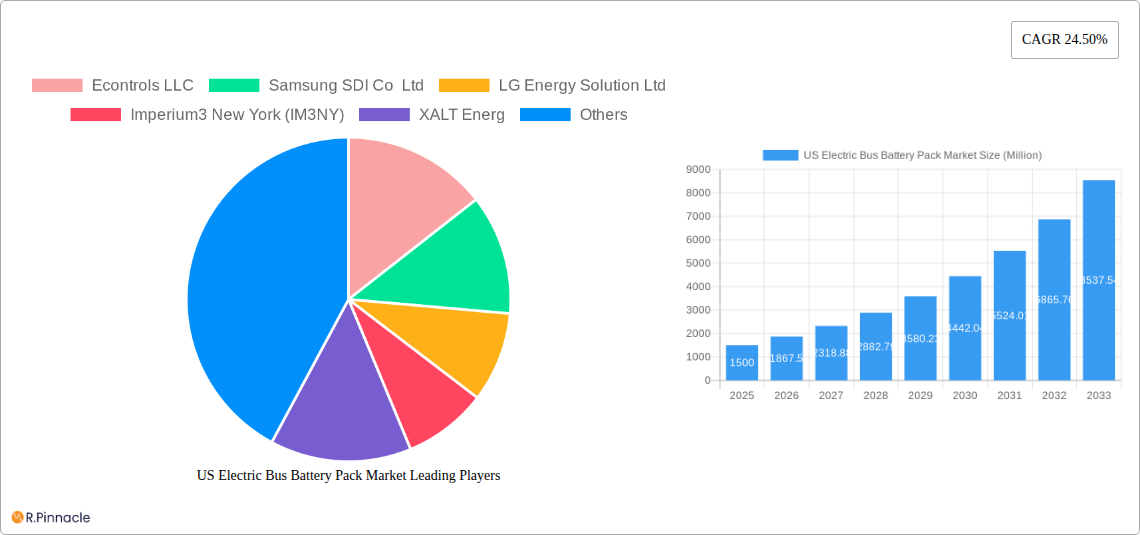
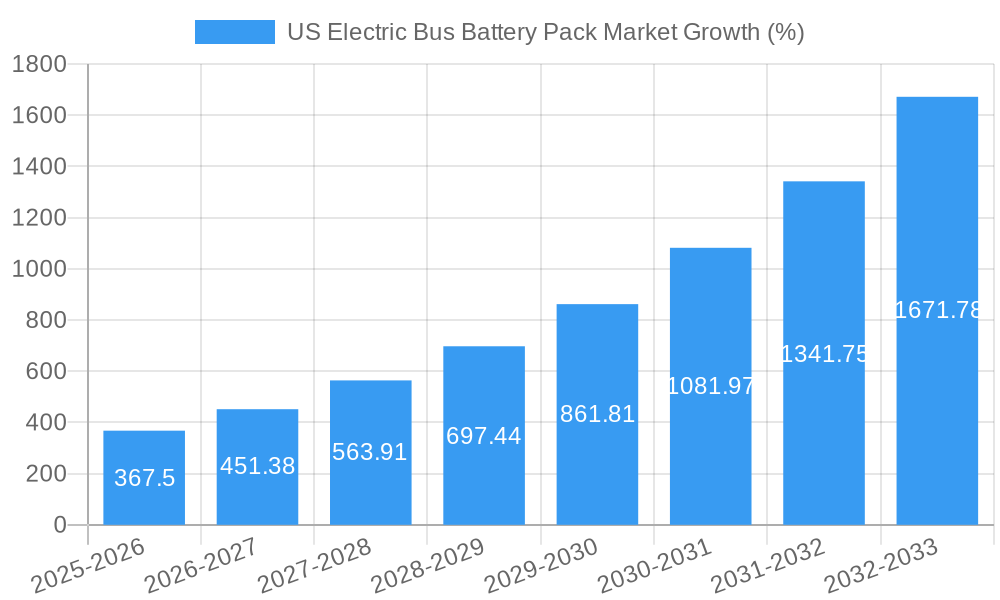
The US electric bus battery pack market is experiencing robust growth, driven by increasing government regulations promoting zero-emission transportation, expanding electric bus fleets in major cities, and a rising awareness of environmental concerns. The market's Compound Annual Growth Rate (CAGR) of 24.50% from 2019 to 2024 indicates significant market expansion. This growth is fueled by advancements in battery technology, leading to higher energy density, longer lifespan, and improved safety features. Key trends include the increasing adoption of lithium-ion battery chemistries like LFP (Lithium Iron Phosphate) and NMC (Nickel Manganese Cobalt), favored for their cost-effectiveness and performance characteristics. The market is segmented by battery form factor (cylindrical, pouch, prismatic), manufacturing method (laser, wire), components (anode, cathode, electrolyte, separator), material type (cobalt, lithium, manganese, natural graphite, nickel), propulsion type (BEV, PHEV), and battery capacity (categorized by kWh ranges). While the initial investment in electric bus infrastructure and battery packs is high, the long-term operational cost savings and environmental benefits are driving adoption. Market restraints include the relatively high cost of battery packs compared to conventional diesel buses, supply chain constraints for critical battery materials, and concerns about battery lifecycle management and recycling.
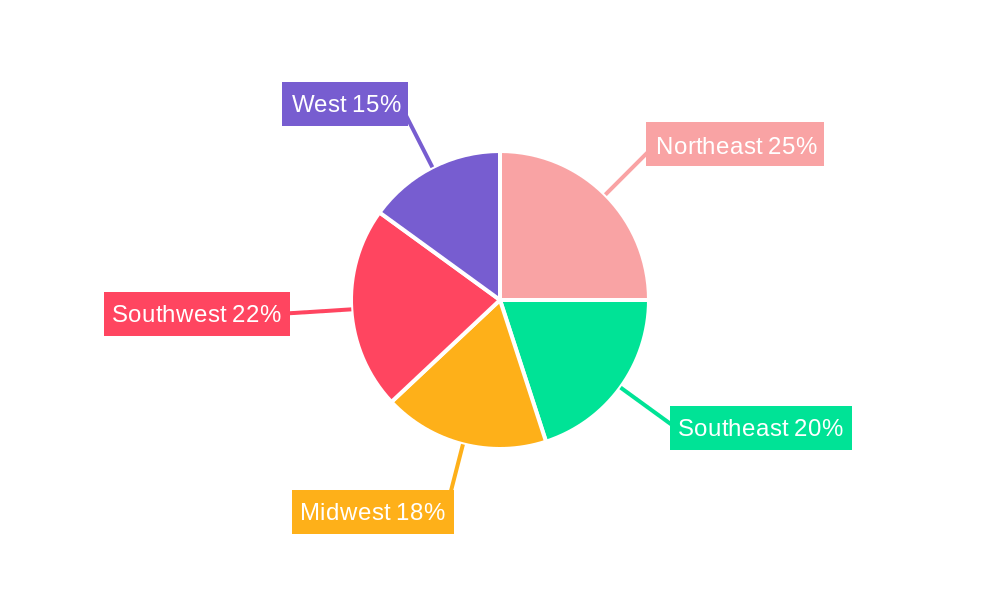
The geographic distribution of the market within the US shows growth across all regions – Northeast, Southeast, Midwest, Southwest, and West – with variations in adoption rates depending on local policies, infrastructure development, and the density of public transportation systems. Major players like BYD Company Ltd, LG Energy Solution Ltd, and CATL are actively competing in this market, investing in production capacity and research and development to improve battery technology and reduce costs. The forecast period of 2025-2033 anticipates continued strong growth, driven by ongoing technological advancements, supportive government policies, and the increasing demand for sustainable public transportation. The market is projected to witness a significant increase in the adoption of higher-capacity battery packs as technology matures and range anxiety concerns among operators lessen. Competition among manufacturers is expected to intensify, focusing on innovation, cost optimization, and reliable supply chains.
US Electric Bus Battery Pack Market Report: 2019-2033
This comprehensive report provides a detailed analysis of the US Electric Bus Battery Pack Market, offering actionable insights for industry professionals and investors. Covering the period from 2019 to 2033, with a focus on 2025, this report examines market structure, dynamics, key players, and future trends. The report segments the market by battery form (Cylindrical, Pouch, Prismatic), method (Laser, Wire), component (Anode, Cathode, Electrolyte, Separator), material type (Cobalt, Lithium, Manganese, Natural Graphite, Nickel, Other Materials), propulsion type (BEV, PHEV), battery chemistry (LFP, NCA, NCM, NMC, Others), and capacity (Less than 15 kWh, 15 kWh to 40 kWh, 40 kWh to 80 kWh, Above 80 kWh).
US Electric Bus Battery Pack Market Structure & Innovation Trends
This section analyzes the competitive landscape of the US electric bus battery pack market, including market concentration, innovation drivers, regulatory influences, and key mergers and acquisitions (M&A) activities. The report assesses the market share of leading players such as Econtrols LLC, Samsung SDI Co Ltd, LG Energy Solution Ltd, Imperium3 New York (IM3NY), XALT Energ, TOSHIBA Corp, Contemporary Amperex Technology Co Ltd (CATL), NFI Group Inc, BYD Company Ltd, SK Innovation Co Ltd, and Proterra Operating Company Inc. We delve into the impact of M&A activities, estimating their aggregate value at xx Million during the study period (2019-2024), analyzing its impact on market consolidation and technological advancement. The report also examines the influence of regulatory frameworks, including federal and state-level incentives and emission standards, shaping market growth and technological innovation. Further, the analysis explores the substitution potential of alternative energy storage solutions and the evolving end-user demographics within the public transportation sector.
US Electric Bus Battery Pack Market Dynamics & Trends
This section offers a deep dive into the market's growth trajectory, exploring key drivers, technological advancements, and competitive pressures. We project a Compound Annual Growth Rate (CAGR) of xx% for the forecast period (2025-2033), driven primarily by increasing demand for sustainable transportation, government regulations promoting electrification, and continuous improvements in battery technology. The report details the market penetration of different battery chemistries and capacities, identifying emerging trends and preferences among electric bus operators. The competitive dynamics are analyzed, focusing on strategies employed by major players, including strategic partnerships, investments in R&D, and geographic expansion. Furthermore, the impact of technological disruptions, such as advancements in solid-state batteries and improved battery management systems, are assessed in terms of their influence on market growth and cost reduction.
Dominant Regions & Segments in US Electric Bus Battery Pack Market
This section identifies the leading regions and segments within the US electric bus battery pack market. Detailed analysis reveals the dominance of specific regions, identifying factors driving their market share. Key drivers are explored using bullet points:
- Economic Policies: Federal and state incentives for electric vehicle adoption.
- Infrastructure Development: Investments in charging infrastructure and grid modernization.
- Public Transportation Initiatives: Government programs supporting electric bus fleet upgrades.
The analysis includes a comprehensive examination of market dominance across various segments:
- Battery Form: The report details the market share and growth projections for cylindrical, pouch, and prismatic battery forms, highlighting the dominant form and reasons for its success.
- Method: Laser and wire methods are compared, assessing their market penetration and future outlook.
- Component: The report analyzes the market for anodes, cathodes, electrolytes, and separators.
- Material Type: Market share and future trends are analyzed for Cobalt, Lithium, Manganese, Natural Graphite, Nickel, and other materials.
- Propulsion Type: The report compares the market for Battery Electric Vehicles (BEVs) and Plug-in Hybrid Electric Vehicles (PHEVs).
- Battery Chemistry: A detailed analysis of LFP, NCA, NCM, NMC, and other battery chemistries, highlighting their market share and future prospects.
- Capacity: Growth projections for different battery capacity segments (Less than 15 kWh, 15 kWh to 40 kWh, 40 kWh to 80 kWh, Above 80 kWh) are provided.
US Electric Bus Battery Pack Market Product Innovations
Recent advancements in battery technology are driving significant product innovations within the electric bus battery pack market. Improvements in energy density, lifespan, and safety are leading to the development of more efficient and cost-effective battery packs. This trend is reflected in the increased adoption of advanced battery chemistries, such as LFP and NMC, which offer superior performance and longevity compared to earlier generations. Furthermore, innovations in thermal management systems and battery management systems are enhancing battery performance and lifespan, leading to a more robust and reliable solution for electric bus operators. The improved market fit of these innovations results in reduced operational costs and increased vehicle uptime.
Report Scope & Segmentation Analysis
This report comprehensively segments the US electric bus battery pack market across various parameters. Each segment is analyzed for its growth trajectory, market size, and competitive landscape. Detailed analysis includes:
- Battery Form: Cylindrical, Pouch, Prismatic. Growth projections are provided for each form, highlighting the fastest-growing segment.
- Method: Laser, Wire. Market sizes and competitive dynamics are detailed for each method.
- Component: Anode, Cathode, Electrolyte, Separator. Market share and future trends are analyzed for each component.
- Material Type: Cobalt, Lithium, Manganese, Natural Graphite, Nickel, Other Materials. Growth projections are provided for each material, with a focus on market share and pricing dynamics.
- Propulsion Type: BEV, PHEV. The report differentiates between BEV and PHEV battery pack markets, providing growth projections for both.
- Battery Chemistry: LFP, NCA, NCM, NMC, Others. Market share and future trends are analyzed for each battery chemistry.
- Capacity: Less than 15 kWh, 15 kWh to 40 kWh, 40 kWh to 80 kWh, Above 80 kWh. Growth projections and market size are detailed for each capacity segment.
Key Drivers of US Electric Bus Battery Pack Market Growth
The growth of the US electric bus battery pack market is fueled by several key factors. Government regulations mandating the reduction of greenhouse gas emissions are significantly driving the adoption of electric buses. Furthermore, advancements in battery technology, leading to improved energy density, longer lifespan, and reduced costs, are making electric buses a more attractive alternative to diesel buses. Significant investments in charging infrastructure and grid modernization are further bolstering the market's growth, alongside growing consumer awareness regarding environmental concerns and the benefits of sustainable transportation.
Challenges in the US Electric Bus Battery Pack Market Sector
Despite the significant growth potential, the US electric bus battery pack market faces several challenges. The high initial cost of electric buses and battery packs remains a barrier to wider adoption, particularly for smaller transit agencies. Supply chain disruptions and the availability of critical raw materials, such as lithium and cobalt, pose significant risks to the market's growth. Moreover, the development and implementation of robust charging infrastructure require significant investment and coordination across various stakeholders. These factors, coupled with competition from alternative fuel technologies, such as hydrogen fuel cells, pose significant hurdles for the market’s expansion.
Emerging Opportunities in US Electric Bus Battery Pack Market
The US electric bus battery pack market presents several emerging opportunities. The increasing demand for sustainable and efficient public transportation systems presents a vast market for electric buses and their associated battery packs. Innovations in solid-state battery technology offer the potential for enhanced energy density, safety, and lifespan, further increasing the appeal of electric buses. Furthermore, the development of advanced battery management systems and efficient charging infrastructure can further mitigate some of the current challenges associated with electric bus deployment, leading to broader adoption. The development of more sustainable and ethically sourced raw materials is another significant opportunity.
Leading Players in the US Electric Bus Battery Pack Market Market
- Econtrols LLC
- Samsung SDI Co Ltd (Samsung SDI)
- LG Energy Solution Ltd (LG Energy Solution)
- Imperium3 New York (IM3NY)
- XALT Energ
- TOSHIBA Corp (Toshiba)
- Contemporary Amperex Technology Co Ltd (CATL) (CATL)
- NFI Group Inc (NFI Group)
- BYD Company Ltd (BYD)
- SK Innovation Co Ltd (SK Innovation)
- Proterra Operating Company Inc (Proterra)
Key Developments in US Electric Bus Battery Pack Market Industry
- January 2023: Samsung SDI considers a new joint venture with a US carmaker to expand in the North American EV market.
- January 2023: Omega Seiki Mobility and IM3NY form a joint venture to bring US battery cell technology to India.
- January 2023: Proterra produces its first Powered EV battery at its new Greer, South Carolina factory.
Future Outlook for US Electric Bus Battery Pack Market Market
The future of the US electric bus battery pack market is bright. Continued government support, technological advancements, and growing consumer demand for sustainable transportation will drive significant market growth over the next decade. Opportunities exist in developing innovative battery chemistries, improving charging infrastructure, and optimizing battery management systems. Strategic partnerships between battery manufacturers, bus manufacturers, and charging infrastructure providers will be crucial in realizing the full potential of this market. The market is expected to experience robust growth, driven by a combination of factors including increasing government regulations, technological advancements, and a growing focus on environmental sustainability.
US Electric Bus Battery Pack Market Segmentation
-
1. Propulsion Type
- 1.1. BEV
- 1.2. PHEV
-
2. Battery Chemistry
- 2.1. LFP
- 2.2. NCA
- 2.3. NCM
- 2.4. NMC
- 2.5. Others
-
3. Capacity
- 3.1. 15 kWh to 40 kWh
- 3.2. 40 kWh to 80 kWh
- 3.3. Above 80 kWh
- 3.4. Less than 15 kWh
-
4. Battery Form
- 4.1. Cylindrical
- 4.2. Pouch
- 4.3. Prismatic
-
5. Method
- 5.1. Laser
- 5.2. Wire
-
6. Component
- 6.1. Anode
- 6.2. Cathode
- 6.3. Electrolyte
- 6.4. Separator
-
7. Material Type
- 7.1. Cobalt
- 7.2. Lithium
- 7.3. Manganese
- 7.4. Natural Graphite
- 7.5. Nickel
- 7.6. Other Materials
US Electric Bus Battery Pack Market Segmentation By Geography
-
1. North America
- 1.1. United States
- 1.2. Canada
- 1.3. Mexico
-
2. South America
- 2.1. Brazil
- 2.2. Argentina
- 2.3. Rest of South America
-
3. Europe
- 3.1. United Kingdom
- 3.2. Germany
- 3.3. France
- 3.4. Italy
- 3.5. Spain
- 3.6. Russia
- 3.7. Benelux
- 3.8. Nordics
- 3.9. Rest of Europe
-
4. Middle East & Africa
- 4.1. Turkey
- 4.2. Israel
- 4.3. GCC
- 4.4. North Africa
- 4.5. South Africa
- 4.6. Rest of Middle East & Africa
-
5. Asia Pacific
- 5.1. China
- 5.2. India
- 5.3. Japan
- 5.4. South Korea
- 5.5. ASEAN
- 5.6. Oceania
- 5.7. Rest of Asia Pacific
US Electric Bus Battery Pack Market REPORT HIGHLIGHTS
| Aspects | Details |
|---|---|
| Study Period | 2019-2033 |
| Base Year | 2024 |
| Estimated Year | 2025 |
| Forecast Period | 2025-2033 |
| Historical Period | 2019-2024 |
| Growth Rate | CAGR of 24.50% from 2019-2033 |
| Segmentation |
|
Table of Contents
- 1. Introduction
- 1.1. Research Scope
- 1.2. Market Segmentation
- 1.3. Research Methodology
- 1.4. Definitions and Assumptions
- 2. Executive Summary
- 2.1. Introduction
- 3. Market Dynamics
- 3.1. Introduction
- 3.2. Market Drivers
- 3.2.1. Exponential Increase in Automotive Sector
- 3.3. Market Restrains
- 3.3.1. Digitization of R&D Operations in Automotive Sector
- 3.4. Market Trends
- 3.4.1. OTHER KEY INDUSTRY TRENDS COVERED IN THE REPORT
- 4. Market Factor Analysis
- 4.1. Porters Five Forces
- 4.2. Supply/Value Chain
- 4.3. PESTEL analysis
- 4.4. Market Entropy
- 4.5. Patent/Trademark Analysis
- 5. Global US Electric Bus Battery Pack Market Analysis, Insights and Forecast, 2019-2031
- 5.1. Market Analysis, Insights and Forecast - by Propulsion Type
- 5.1.1. BEV
- 5.1.2. PHEV
- 5.2. Market Analysis, Insights and Forecast - by Battery Chemistry
- 5.2.1. LFP
- 5.2.2. NCA
- 5.2.3. NCM
- 5.2.4. NMC
- 5.2.5. Others
- 5.3. Market Analysis, Insights and Forecast - by Capacity
- 5.3.1. 15 kWh to 40 kWh
- 5.3.2. 40 kWh to 80 kWh
- 5.3.3. Above 80 kWh
- 5.3.4. Less than 15 kWh
- 5.4. Market Analysis, Insights and Forecast - by Battery Form
- 5.4.1. Cylindrical
- 5.4.2. Pouch
- 5.4.3. Prismatic
- 5.5. Market Analysis, Insights and Forecast - by Method
- 5.5.1. Laser
- 5.5.2. Wire
- 5.6. Market Analysis, Insights and Forecast - by Component
- 5.6.1. Anode
- 5.6.2. Cathode
- 5.6.3. Electrolyte
- 5.6.4. Separator
- 5.7. Market Analysis, Insights and Forecast - by Material Type
- 5.7.1. Cobalt
- 5.7.2. Lithium
- 5.7.3. Manganese
- 5.7.4. Natural Graphite
- 5.7.5. Nickel
- 5.7.6. Other Materials
- 5.8. Market Analysis, Insights and Forecast - by Region
- 5.8.1. North America
- 5.8.2. South America
- 5.8.3. Europe
- 5.8.4. Middle East & Africa
- 5.8.5. Asia Pacific
- 5.1. Market Analysis, Insights and Forecast - by Propulsion Type
- 6. North America US Electric Bus Battery Pack Market Analysis, Insights and Forecast, 2019-2031
- 6.1. Market Analysis, Insights and Forecast - by Propulsion Type
- 6.1.1. BEV
- 6.1.2. PHEV
- 6.2. Market Analysis, Insights and Forecast - by Battery Chemistry
- 6.2.1. LFP
- 6.2.2. NCA
- 6.2.3. NCM
- 6.2.4. NMC
- 6.2.5. Others
- 6.3. Market Analysis, Insights and Forecast - by Capacity
- 6.3.1. 15 kWh to 40 kWh
- 6.3.2. 40 kWh to 80 kWh
- 6.3.3. Above 80 kWh
- 6.3.4. Less than 15 kWh
- 6.4. Market Analysis, Insights and Forecast - by Battery Form
- 6.4.1. Cylindrical
- 6.4.2. Pouch
- 6.4.3. Prismatic
- 6.5. Market Analysis, Insights and Forecast - by Method
- 6.5.1. Laser
- 6.5.2. Wire
- 6.6. Market Analysis, Insights and Forecast - by Component
- 6.6.1. Anode
- 6.6.2. Cathode
- 6.6.3. Electrolyte
- 6.6.4. Separator
- 6.7. Market Analysis, Insights and Forecast - by Material Type
- 6.7.1. Cobalt
- 6.7.2. Lithium
- 6.7.3. Manganese
- 6.7.4. Natural Graphite
- 6.7.5. Nickel
- 6.7.6. Other Materials
- 6.1. Market Analysis, Insights and Forecast - by Propulsion Type
- 7. South America US Electric Bus Battery Pack Market Analysis, Insights and Forecast, 2019-2031
- 7.1. Market Analysis, Insights and Forecast - by Propulsion Type
- 7.1.1. BEV
- 7.1.2. PHEV
- 7.2. Market Analysis, Insights and Forecast - by Battery Chemistry
- 7.2.1. LFP
- 7.2.2. NCA
- 7.2.3. NCM
- 7.2.4. NMC
- 7.2.5. Others
- 7.3. Market Analysis, Insights and Forecast - by Capacity
- 7.3.1. 15 kWh to 40 kWh
- 7.3.2. 40 kWh to 80 kWh
- 7.3.3. Above 80 kWh
- 7.3.4. Less than 15 kWh
- 7.4. Market Analysis, Insights and Forecast - by Battery Form
- 7.4.1. Cylindrical
- 7.4.2. Pouch
- 7.4.3. Prismatic
- 7.5. Market Analysis, Insights and Forecast - by Method
- 7.5.1. Laser
- 7.5.2. Wire
- 7.6. Market Analysis, Insights and Forecast - by Component
- 7.6.1. Anode
- 7.6.2. Cathode
- 7.6.3. Electrolyte
- 7.6.4. Separator
- 7.7. Market Analysis, Insights and Forecast - by Material Type
- 7.7.1. Cobalt
- 7.7.2. Lithium
- 7.7.3. Manganese
- 7.7.4. Natural Graphite
- 7.7.5. Nickel
- 7.7.6. Other Materials
- 7.1. Market Analysis, Insights and Forecast - by Propulsion Type
- 8. Europe US Electric Bus Battery Pack Market Analysis, Insights and Forecast, 2019-2031
- 8.1. Market Analysis, Insights and Forecast - by Propulsion Type
- 8.1.1. BEV
- 8.1.2. PHEV
- 8.2. Market Analysis, Insights and Forecast - by Battery Chemistry
- 8.2.1. LFP
- 8.2.2. NCA
- 8.2.3. NCM
- 8.2.4. NMC
- 8.2.5. Others
- 8.3. Market Analysis, Insights and Forecast - by Capacity
- 8.3.1. 15 kWh to 40 kWh
- 8.3.2. 40 kWh to 80 kWh
- 8.3.3. Above 80 kWh
- 8.3.4. Less than 15 kWh
- 8.4. Market Analysis, Insights and Forecast - by Battery Form
- 8.4.1. Cylindrical
- 8.4.2. Pouch
- 8.4.3. Prismatic
- 8.5. Market Analysis, Insights and Forecast - by Method
- 8.5.1. Laser
- 8.5.2. Wire
- 8.6. Market Analysis, Insights and Forecast - by Component
- 8.6.1. Anode
- 8.6.2. Cathode
- 8.6.3. Electrolyte
- 8.6.4. Separator
- 8.7. Market Analysis, Insights and Forecast - by Material Type
- 8.7.1. Cobalt
- 8.7.2. Lithium
- 8.7.3. Manganese
- 8.7.4. Natural Graphite
- 8.7.5. Nickel
- 8.7.6. Other Materials
- 8.1. Market Analysis, Insights and Forecast - by Propulsion Type
- 9. Middle East & Africa US Electric Bus Battery Pack Market Analysis, Insights and Forecast, 2019-2031
- 9.1. Market Analysis, Insights and Forecast - by Propulsion Type
- 9.1.1. BEV
- 9.1.2. PHEV
- 9.2. Market Analysis, Insights and Forecast - by Battery Chemistry
- 9.2.1. LFP
- 9.2.2. NCA
- 9.2.3. NCM
- 9.2.4. NMC
- 9.2.5. Others
- 9.3. Market Analysis, Insights and Forecast - by Capacity
- 9.3.1. 15 kWh to 40 kWh
- 9.3.2. 40 kWh to 80 kWh
- 9.3.3. Above 80 kWh
- 9.3.4. Less than 15 kWh
- 9.4. Market Analysis, Insights and Forecast - by Battery Form
- 9.4.1. Cylindrical
- 9.4.2. Pouch
- 9.4.3. Prismatic
- 9.5. Market Analysis, Insights and Forecast - by Method
- 9.5.1. Laser
- 9.5.2. Wire
- 9.6. Market Analysis, Insights and Forecast - by Component
- 9.6.1. Anode
- 9.6.2. Cathode
- 9.6.3. Electrolyte
- 9.6.4. Separator
- 9.7. Market Analysis, Insights and Forecast - by Material Type
- 9.7.1. Cobalt
- 9.7.2. Lithium
- 9.7.3. Manganese
- 9.7.4. Natural Graphite
- 9.7.5. Nickel
- 9.7.6. Other Materials
- 9.1. Market Analysis, Insights and Forecast - by Propulsion Type
- 10. Asia Pacific US Electric Bus Battery Pack Market Analysis, Insights and Forecast, 2019-2031
- 10.1. Market Analysis, Insights and Forecast - by Propulsion Type
- 10.1.1. BEV
- 10.1.2. PHEV
- 10.2. Market Analysis, Insights and Forecast - by Battery Chemistry
- 10.2.1. LFP
- 10.2.2. NCA
- 10.2.3. NCM
- 10.2.4. NMC
- 10.2.5. Others
- 10.3. Market Analysis, Insights and Forecast - by Capacity
- 10.3.1. 15 kWh to 40 kWh
- 10.3.2. 40 kWh to 80 kWh
- 10.3.3. Above 80 kWh
- 10.3.4. Less than 15 kWh
- 10.4. Market Analysis, Insights and Forecast - by Battery Form
- 10.4.1. Cylindrical
- 10.4.2. Pouch
- 10.4.3. Prismatic
- 10.5. Market Analysis, Insights and Forecast - by Method
- 10.5.1. Laser
- 10.5.2. Wire
- 10.6. Market Analysis, Insights and Forecast - by Component
- 10.6.1. Anode
- 10.6.2. Cathode
- 10.6.3. Electrolyte
- 10.6.4. Separator
- 10.7. Market Analysis, Insights and Forecast - by Material Type
- 10.7.1. Cobalt
- 10.7.2. Lithium
- 10.7.3. Manganese
- 10.7.4. Natural Graphite
- 10.7.5. Nickel
- 10.7.6. Other Materials
- 10.1. Market Analysis, Insights and Forecast - by Propulsion Type
- 11. Northeast US Electric Bus Battery Pack Market Analysis, Insights and Forecast, 2019-2031
- 12. Southeast US Electric Bus Battery Pack Market Analysis, Insights and Forecast, 2019-2031
- 13. Midwest US Electric Bus Battery Pack Market Analysis, Insights and Forecast, 2019-2031
- 14. Southwest US Electric Bus Battery Pack Market Analysis, Insights and Forecast, 2019-2031
- 15. West US Electric Bus Battery Pack Market Analysis, Insights and Forecast, 2019-2031
- 16. Competitive Analysis
- 16.1. Global Market Share Analysis 2024
- 16.2. Company Profiles
- 16.2.1 Econtrols LLC
- 16.2.1.1. Overview
- 16.2.1.2. Products
- 16.2.1.3. SWOT Analysis
- 16.2.1.4. Recent Developments
- 16.2.1.5. Financials (Based on Availability)
- 16.2.2 Samsung SDI Co Ltd
- 16.2.2.1. Overview
- 16.2.2.2. Products
- 16.2.2.3. SWOT Analysis
- 16.2.2.4. Recent Developments
- 16.2.2.5. Financials (Based on Availability)
- 16.2.3 LG Energy Solution Ltd
- 16.2.3.1. Overview
- 16.2.3.2. Products
- 16.2.3.3. SWOT Analysis
- 16.2.3.4. Recent Developments
- 16.2.3.5. Financials (Based on Availability)
- 16.2.4 Imperium3 New York (IM3NY)
- 16.2.4.1. Overview
- 16.2.4.2. Products
- 16.2.4.3. SWOT Analysis
- 16.2.4.4. Recent Developments
- 16.2.4.5. Financials (Based on Availability)
- 16.2.5 XALT Energ
- 16.2.5.1. Overview
- 16.2.5.2. Products
- 16.2.5.3. SWOT Analysis
- 16.2.5.4. Recent Developments
- 16.2.5.5. Financials (Based on Availability)
- 16.2.6 TOSHIBA Corp
- 16.2.6.1. Overview
- 16.2.6.2. Products
- 16.2.6.3. SWOT Analysis
- 16.2.6.4. Recent Developments
- 16.2.6.5. Financials (Based on Availability)
- 16.2.7 Contemporary Amperex Technology Co Ltd (CATL)
- 16.2.7.1. Overview
- 16.2.7.2. Products
- 16.2.7.3. SWOT Analysis
- 16.2.7.4. Recent Developments
- 16.2.7.5. Financials (Based on Availability)
- 16.2.8 NFI Group Inc
- 16.2.8.1. Overview
- 16.2.8.2. Products
- 16.2.8.3. SWOT Analysis
- 16.2.8.4. Recent Developments
- 16.2.8.5. Financials (Based on Availability)
- 16.2.9 BYD Company Ltd
- 16.2.9.1. Overview
- 16.2.9.2. Products
- 16.2.9.3. SWOT Analysis
- 16.2.9.4. Recent Developments
- 16.2.9.5. Financials (Based on Availability)
- 16.2.10 SK Innovation Co Ltd
- 16.2.10.1. Overview
- 16.2.10.2. Products
- 16.2.10.3. SWOT Analysis
- 16.2.10.4. Recent Developments
- 16.2.10.5. Financials (Based on Availability)
- 16.2.11 Proterra Operating Company Inc
- 16.2.11.1. Overview
- 16.2.11.2. Products
- 16.2.11.3. SWOT Analysis
- 16.2.11.4. Recent Developments
- 16.2.11.5. Financials (Based on Availability)
- 16.2.1 Econtrols LLC
List of Figures
- Figure 1: Global US Electric Bus Battery Pack Market Revenue Breakdown (Million, %) by Region 2024 & 2032
- Figure 2: United states US Electric Bus Battery Pack Market Revenue (Million), by Country 2024 & 2032
- Figure 3: United states US Electric Bus Battery Pack Market Revenue Share (%), by Country 2024 & 2032
- Figure 4: North America US Electric Bus Battery Pack Market Revenue (Million), by Propulsion Type 2024 & 2032
- Figure 5: North America US Electric Bus Battery Pack Market Revenue Share (%), by Propulsion Type 2024 & 2032
- Figure 6: North America US Electric Bus Battery Pack Market Revenue (Million), by Battery Chemistry 2024 & 2032
- Figure 7: North America US Electric Bus Battery Pack Market Revenue Share (%), by Battery Chemistry 2024 & 2032
- Figure 8: North America US Electric Bus Battery Pack Market Revenue (Million), by Capacity 2024 & 2032
- Figure 9: North America US Electric Bus Battery Pack Market Revenue Share (%), by Capacity 2024 & 2032
- Figure 10: North America US Electric Bus Battery Pack Market Revenue (Million), by Battery Form 2024 & 2032
- Figure 11: North America US Electric Bus Battery Pack Market Revenue Share (%), by Battery Form 2024 & 2032
- Figure 12: North America US Electric Bus Battery Pack Market Revenue (Million), by Method 2024 & 2032
- Figure 13: North America US Electric Bus Battery Pack Market Revenue Share (%), by Method 2024 & 2032
- Figure 14: North America US Electric Bus Battery Pack Market Revenue (Million), by Component 2024 & 2032
- Figure 15: North America US Electric Bus Battery Pack Market Revenue Share (%), by Component 2024 & 2032
- Figure 16: North America US Electric Bus Battery Pack Market Revenue (Million), by Material Type 2024 & 2032
- Figure 17: North America US Electric Bus Battery Pack Market Revenue Share (%), by Material Type 2024 & 2032
- Figure 18: North America US Electric Bus Battery Pack Market Revenue (Million), by Country 2024 & 2032
- Figure 19: North America US Electric Bus Battery Pack Market Revenue Share (%), by Country 2024 & 2032
- Figure 20: South America US Electric Bus Battery Pack Market Revenue (Million), by Propulsion Type 2024 & 2032
- Figure 21: South America US Electric Bus Battery Pack Market Revenue Share (%), by Propulsion Type 2024 & 2032
- Figure 22: South America US Electric Bus Battery Pack Market Revenue (Million), by Battery Chemistry 2024 & 2032
- Figure 23: South America US Electric Bus Battery Pack Market Revenue Share (%), by Battery Chemistry 2024 & 2032
- Figure 24: South America US Electric Bus Battery Pack Market Revenue (Million), by Capacity 2024 & 2032
- Figure 25: South America US Electric Bus Battery Pack Market Revenue Share (%), by Capacity 2024 & 2032
- Figure 26: South America US Electric Bus Battery Pack Market Revenue (Million), by Battery Form 2024 & 2032
- Figure 27: South America US Electric Bus Battery Pack Market Revenue Share (%), by Battery Form 2024 & 2032
- Figure 28: South America US Electric Bus Battery Pack Market Revenue (Million), by Method 2024 & 2032
- Figure 29: South America US Electric Bus Battery Pack Market Revenue Share (%), by Method 2024 & 2032
- Figure 30: South America US Electric Bus Battery Pack Market Revenue (Million), by Component 2024 & 2032
- Figure 31: South America US Electric Bus Battery Pack Market Revenue Share (%), by Component 2024 & 2032
- Figure 32: South America US Electric Bus Battery Pack Market Revenue (Million), by Material Type 2024 & 2032
- Figure 33: South America US Electric Bus Battery Pack Market Revenue Share (%), by Material Type 2024 & 2032
- Figure 34: South America US Electric Bus Battery Pack Market Revenue (Million), by Country 2024 & 2032
- Figure 35: South America US Electric Bus Battery Pack Market Revenue Share (%), by Country 2024 & 2032
- Figure 36: Europe US Electric Bus Battery Pack Market Revenue (Million), by Propulsion Type 2024 & 2032
- Figure 37: Europe US Electric Bus Battery Pack Market Revenue Share (%), by Propulsion Type 2024 & 2032
- Figure 38: Europe US Electric Bus Battery Pack Market Revenue (Million), by Battery Chemistry 2024 & 2032
- Figure 39: Europe US Electric Bus Battery Pack Market Revenue Share (%), by Battery Chemistry 2024 & 2032
- Figure 40: Europe US Electric Bus Battery Pack Market Revenue (Million), by Capacity 2024 & 2032
- Figure 41: Europe US Electric Bus Battery Pack Market Revenue Share (%), by Capacity 2024 & 2032
- Figure 42: Europe US Electric Bus Battery Pack Market Revenue (Million), by Battery Form 2024 & 2032
- Figure 43: Europe US Electric Bus Battery Pack Market Revenue Share (%), by Battery Form 2024 & 2032
- Figure 44: Europe US Electric Bus Battery Pack Market Revenue (Million), by Method 2024 & 2032
- Figure 45: Europe US Electric Bus Battery Pack Market Revenue Share (%), by Method 2024 & 2032
- Figure 46: Europe US Electric Bus Battery Pack Market Revenue (Million), by Component 2024 & 2032
- Figure 47: Europe US Electric Bus Battery Pack Market Revenue Share (%), by Component 2024 & 2032
- Figure 48: Europe US Electric Bus Battery Pack Market Revenue (Million), by Material Type 2024 & 2032
- Figure 49: Europe US Electric Bus Battery Pack Market Revenue Share (%), by Material Type 2024 & 2032
- Figure 50: Europe US Electric Bus Battery Pack Market Revenue (Million), by Country 2024 & 2032
- Figure 51: Europe US Electric Bus Battery Pack Market Revenue Share (%), by Country 2024 & 2032
- Figure 52: Middle East & Africa US Electric Bus Battery Pack Market Revenue (Million), by Propulsion Type 2024 & 2032
- Figure 53: Middle East & Africa US Electric Bus Battery Pack Market Revenue Share (%), by Propulsion Type 2024 & 2032
- Figure 54: Middle East & Africa US Electric Bus Battery Pack Market Revenue (Million), by Battery Chemistry 2024 & 2032
- Figure 55: Middle East & Africa US Electric Bus Battery Pack Market Revenue Share (%), by Battery Chemistry 2024 & 2032
- Figure 56: Middle East & Africa US Electric Bus Battery Pack Market Revenue (Million), by Capacity 2024 & 2032
- Figure 57: Middle East & Africa US Electric Bus Battery Pack Market Revenue Share (%), by Capacity 2024 & 2032
- Figure 58: Middle East & Africa US Electric Bus Battery Pack Market Revenue (Million), by Battery Form 2024 & 2032
- Figure 59: Middle East & Africa US Electric Bus Battery Pack Market Revenue Share (%), by Battery Form 2024 & 2032
- Figure 60: Middle East & Africa US Electric Bus Battery Pack Market Revenue (Million), by Method 2024 & 2032
- Figure 61: Middle East & Africa US Electric Bus Battery Pack Market Revenue Share (%), by Method 2024 & 2032
- Figure 62: Middle East & Africa US Electric Bus Battery Pack Market Revenue (Million), by Component 2024 & 2032
- Figure 63: Middle East & Africa US Electric Bus Battery Pack Market Revenue Share (%), by Component 2024 & 2032
- Figure 64: Middle East & Africa US Electric Bus Battery Pack Market Revenue (Million), by Material Type 2024 & 2032
- Figure 65: Middle East & Africa US Electric Bus Battery Pack Market Revenue Share (%), by Material Type 2024 & 2032
- Figure 66: Middle East & Africa US Electric Bus Battery Pack Market Revenue (Million), by Country 2024 & 2032
- Figure 67: Middle East & Africa US Electric Bus Battery Pack Market Revenue Share (%), by Country 2024 & 2032
- Figure 68: Asia Pacific US Electric Bus Battery Pack Market Revenue (Million), by Propulsion Type 2024 & 2032
- Figure 69: Asia Pacific US Electric Bus Battery Pack Market Revenue Share (%), by Propulsion Type 2024 & 2032
- Figure 70: Asia Pacific US Electric Bus Battery Pack Market Revenue (Million), by Battery Chemistry 2024 & 2032
- Figure 71: Asia Pacific US Electric Bus Battery Pack Market Revenue Share (%), by Battery Chemistry 2024 & 2032
- Figure 72: Asia Pacific US Electric Bus Battery Pack Market Revenue (Million), by Capacity 2024 & 2032
- Figure 73: Asia Pacific US Electric Bus Battery Pack Market Revenue Share (%), by Capacity 2024 & 2032
- Figure 74: Asia Pacific US Electric Bus Battery Pack Market Revenue (Million), by Battery Form 2024 & 2032
- Figure 75: Asia Pacific US Electric Bus Battery Pack Market Revenue Share (%), by Battery Form 2024 & 2032
- Figure 76: Asia Pacific US Electric Bus Battery Pack Market Revenue (Million), by Method 2024 & 2032
- Figure 77: Asia Pacific US Electric Bus Battery Pack Market Revenue Share (%), by Method 2024 & 2032
- Figure 78: Asia Pacific US Electric Bus Battery Pack Market Revenue (Million), by Component 2024 & 2032
- Figure 79: Asia Pacific US Electric Bus Battery Pack Market Revenue Share (%), by Component 2024 & 2032
- Figure 80: Asia Pacific US Electric Bus Battery Pack Market Revenue (Million), by Material Type 2024 & 2032
- Figure 81: Asia Pacific US Electric Bus Battery Pack Market Revenue Share (%), by Material Type 2024 & 2032
- Figure 82: Asia Pacific US Electric Bus Battery Pack Market Revenue (Million), by Country 2024 & 2032
- Figure 83: Asia Pacific US Electric Bus Battery Pack Market Revenue Share (%), by Country 2024 & 2032
List of Tables
- Table 1: Global US Electric Bus Battery Pack Market Revenue Million Forecast, by Region 2019 & 2032
- Table 2: Global US Electric Bus Battery Pack Market Revenue Million Forecast, by Propulsion Type 2019 & 2032
- Table 3: Global US Electric Bus Battery Pack Market Revenue Million Forecast, by Battery Chemistry 2019 & 2032
- Table 4: Global US Electric Bus Battery Pack Market Revenue Million Forecast, by Capacity 2019 & 2032
- Table 5: Global US Electric Bus Battery Pack Market Revenue Million Forecast, by Battery Form 2019 & 2032
- Table 6: Global US Electric Bus Battery Pack Market Revenue Million Forecast, by Method 2019 & 2032
- Table 7: Global US Electric Bus Battery Pack Market Revenue Million Forecast, by Component 2019 & 2032
- Table 8: Global US Electric Bus Battery Pack Market Revenue Million Forecast, by Material Type 2019 & 2032
- Table 9: Global US Electric Bus Battery Pack Market Revenue Million Forecast, by Region 2019 & 2032
- Table 10: Global US Electric Bus Battery Pack Market Revenue Million Forecast, by Country 2019 & 2032
- Table 11: Northeast US Electric Bus Battery Pack Market Revenue (Million) Forecast, by Application 2019 & 2032
- Table 12: Southeast US Electric Bus Battery Pack Market Revenue (Million) Forecast, by Application 2019 & 2032
- Table 13: Midwest US Electric Bus Battery Pack Market Revenue (Million) Forecast, by Application 2019 & 2032
- Table 14: Southwest US Electric Bus Battery Pack Market Revenue (Million) Forecast, by Application 2019 & 2032
- Table 15: West US Electric Bus Battery Pack Market Revenue (Million) Forecast, by Application 2019 & 2032
- Table 16: Global US Electric Bus Battery Pack Market Revenue Million Forecast, by Propulsion Type 2019 & 2032
- Table 17: Global US Electric Bus Battery Pack Market Revenue Million Forecast, by Battery Chemistry 2019 & 2032
- Table 18: Global US Electric Bus Battery Pack Market Revenue Million Forecast, by Capacity 2019 & 2032
- Table 19: Global US Electric Bus Battery Pack Market Revenue Million Forecast, by Battery Form 2019 & 2032
- Table 20: Global US Electric Bus Battery Pack Market Revenue Million Forecast, by Method 2019 & 2032
- Table 21: Global US Electric Bus Battery Pack Market Revenue Million Forecast, by Component 2019 & 2032
- Table 22: Global US Electric Bus Battery Pack Market Revenue Million Forecast, by Material Type 2019 & 2032
- Table 23: Global US Electric Bus Battery Pack Market Revenue Million Forecast, by Country 2019 & 2032
- Table 24: United States US Electric Bus Battery Pack Market Revenue (Million) Forecast, by Application 2019 & 2032
- Table 25: Canada US Electric Bus Battery Pack Market Revenue (Million) Forecast, by Application 2019 & 2032
- Table 26: Mexico US Electric Bus Battery Pack Market Revenue (Million) Forecast, by Application 2019 & 2032
- Table 27: Global US Electric Bus Battery Pack Market Revenue Million Forecast, by Propulsion Type 2019 & 2032
- Table 28: Global US Electric Bus Battery Pack Market Revenue Million Forecast, by Battery Chemistry 2019 & 2032
- Table 29: Global US Electric Bus Battery Pack Market Revenue Million Forecast, by Capacity 2019 & 2032
- Table 30: Global US Electric Bus Battery Pack Market Revenue Million Forecast, by Battery Form 2019 & 2032
- Table 31: Global US Electric Bus Battery Pack Market Revenue Million Forecast, by Method 2019 & 2032
- Table 32: Global US Electric Bus Battery Pack Market Revenue Million Forecast, by Component 2019 & 2032
- Table 33: Global US Electric Bus Battery Pack Market Revenue Million Forecast, by Material Type 2019 & 2032
- Table 34: Global US Electric Bus Battery Pack Market Revenue Million Forecast, by Country 2019 & 2032
- Table 35: Brazil US Electric Bus Battery Pack Market Revenue (Million) Forecast, by Application 2019 & 2032
- Table 36: Argentina US Electric Bus Battery Pack Market Revenue (Million) Forecast, by Application 2019 & 2032
- Table 37: Rest of South America US Electric Bus Battery Pack Market Revenue (Million) Forecast, by Application 2019 & 2032
- Table 38: Global US Electric Bus Battery Pack Market Revenue Million Forecast, by Propulsion Type 2019 & 2032
- Table 39: Global US Electric Bus Battery Pack Market Revenue Million Forecast, by Battery Chemistry 2019 & 2032
- Table 40: Global US Electric Bus Battery Pack Market Revenue Million Forecast, by Capacity 2019 & 2032
- Table 41: Global US Electric Bus Battery Pack Market Revenue Million Forecast, by Battery Form 2019 & 2032
- Table 42: Global US Electric Bus Battery Pack Market Revenue Million Forecast, by Method 2019 & 2032
- Table 43: Global US Electric Bus Battery Pack Market Revenue Million Forecast, by Component 2019 & 2032
- Table 44: Global US Electric Bus Battery Pack Market Revenue Million Forecast, by Material Type 2019 & 2032
- Table 45: Global US Electric Bus Battery Pack Market Revenue Million Forecast, by Country 2019 & 2032
- Table 46: United Kingdom US Electric Bus Battery Pack Market Revenue (Million) Forecast, by Application 2019 & 2032
- Table 47: Germany US Electric Bus Battery Pack Market Revenue (Million) Forecast, by Application 2019 & 2032
- Table 48: France US Electric Bus Battery Pack Market Revenue (Million) Forecast, by Application 2019 & 2032
- Table 49: Italy US Electric Bus Battery Pack Market Revenue (Million) Forecast, by Application 2019 & 2032
- Table 50: Spain US Electric Bus Battery Pack Market Revenue (Million) Forecast, by Application 2019 & 2032
- Table 51: Russia US Electric Bus Battery Pack Market Revenue (Million) Forecast, by Application 2019 & 2032
- Table 52: Benelux US Electric Bus Battery Pack Market Revenue (Million) Forecast, by Application 2019 & 2032
- Table 53: Nordics US Electric Bus Battery Pack Market Revenue (Million) Forecast, by Application 2019 & 2032
- Table 54: Rest of Europe US Electric Bus Battery Pack Market Revenue (Million) Forecast, by Application 2019 & 2032
- Table 55: Global US Electric Bus Battery Pack Market Revenue Million Forecast, by Propulsion Type 2019 & 2032
- Table 56: Global US Electric Bus Battery Pack Market Revenue Million Forecast, by Battery Chemistry 2019 & 2032
- Table 57: Global US Electric Bus Battery Pack Market Revenue Million Forecast, by Capacity 2019 & 2032
- Table 58: Global US Electric Bus Battery Pack Market Revenue Million Forecast, by Battery Form 2019 & 2032
- Table 59: Global US Electric Bus Battery Pack Market Revenue Million Forecast, by Method 2019 & 2032
- Table 60: Global US Electric Bus Battery Pack Market Revenue Million Forecast, by Component 2019 & 2032
- Table 61: Global US Electric Bus Battery Pack Market Revenue Million Forecast, by Material Type 2019 & 2032
- Table 62: Global US Electric Bus Battery Pack Market Revenue Million Forecast, by Country 2019 & 2032
- Table 63: Turkey US Electric Bus Battery Pack Market Revenue (Million) Forecast, by Application 2019 & 2032
- Table 64: Israel US Electric Bus Battery Pack Market Revenue (Million) Forecast, by Application 2019 & 2032
- Table 65: GCC US Electric Bus Battery Pack Market Revenue (Million) Forecast, by Application 2019 & 2032
- Table 66: North Africa US Electric Bus Battery Pack Market Revenue (Million) Forecast, by Application 2019 & 2032
- Table 67: South Africa US Electric Bus Battery Pack Market Revenue (Million) Forecast, by Application 2019 & 2032
- Table 68: Rest of Middle East & Africa US Electric Bus Battery Pack Market Revenue (Million) Forecast, by Application 2019 & 2032
- Table 69: Global US Electric Bus Battery Pack Market Revenue Million Forecast, by Propulsion Type 2019 & 2032
- Table 70: Global US Electric Bus Battery Pack Market Revenue Million Forecast, by Battery Chemistry 2019 & 2032
- Table 71: Global US Electric Bus Battery Pack Market Revenue Million Forecast, by Capacity 2019 & 2032
- Table 72: Global US Electric Bus Battery Pack Market Revenue Million Forecast, by Battery Form 2019 & 2032
- Table 73: Global US Electric Bus Battery Pack Market Revenue Million Forecast, by Method 2019 & 2032
- Table 74: Global US Electric Bus Battery Pack Market Revenue Million Forecast, by Component 2019 & 2032
- Table 75: Global US Electric Bus Battery Pack Market Revenue Million Forecast, by Material Type 2019 & 2032
- Table 76: Global US Electric Bus Battery Pack Market Revenue Million Forecast, by Country 2019 & 2032
- Table 77: China US Electric Bus Battery Pack Market Revenue (Million) Forecast, by Application 2019 & 2032
- Table 78: India US Electric Bus Battery Pack Market Revenue (Million) Forecast, by Application 2019 & 2032
- Table 79: Japan US Electric Bus Battery Pack Market Revenue (Million) Forecast, by Application 2019 & 2032
- Table 80: South Korea US Electric Bus Battery Pack Market Revenue (Million) Forecast, by Application 2019 & 2032
- Table 81: ASEAN US Electric Bus Battery Pack Market Revenue (Million) Forecast, by Application 2019 & 2032
- Table 82: Oceania US Electric Bus Battery Pack Market Revenue (Million) Forecast, by Application 2019 & 2032
- Table 83: Rest of Asia Pacific US Electric Bus Battery Pack Market Revenue (Million) Forecast, by Application 2019 & 2032
Frequently Asked Questions
1. What is the projected Compound Annual Growth Rate (CAGR) of the US Electric Bus Battery Pack Market?
The projected CAGR is approximately 24.50%.
2. Which companies are prominent players in the US Electric Bus Battery Pack Market?
Key companies in the market include Econtrols LLC, Samsung SDI Co Ltd, LG Energy Solution Ltd, Imperium3 New York (IM3NY), XALT Energ, TOSHIBA Corp, Contemporary Amperex Technology Co Ltd (CATL), NFI Group Inc, BYD Company Ltd, SK Innovation Co Ltd, Proterra Operating Company Inc.
3. What are the main segments of the US Electric Bus Battery Pack Market?
The market segments include Propulsion Type, Battery Chemistry, Capacity, Battery Form, Method, Component, Material Type.
4. Can you provide details about the market size?
The market size is estimated to be USD XX Million as of 2022.
5. What are some drivers contributing to market growth?
Exponential Increase in Automotive Sector.
6. What are the notable trends driving market growth?
OTHER KEY INDUSTRY TRENDS COVERED IN THE REPORT.
7. Are there any restraints impacting market growth?
Digitization of R&D Operations in Automotive Sector.
8. Can you provide examples of recent developments in the market?
January 2023: Samsung SDI is considering setting up another joint venture with a U.S. carmaker to expand its presence in the rapidly growing North American electric vehicle market.January 2023: Omega Seiki Mobility and iM3NY have formed a joint venture to bring US battery cell technology to India.January 2023: Proterra Powered EV battery was manufactured at the company's new Powered 1 battery production factory in Greer, South Carolina, marking the first one produced at the factory.
9. What pricing options are available for accessing the report?
Pricing options include single-user, multi-user, and enterprise licenses priced at USD 3800, USD 4500, and USD 5800 respectively.
10. Is the market size provided in terms of value or volume?
The market size is provided in terms of value, measured in Million.
11. Are there any specific market keywords associated with the report?
Yes, the market keyword associated with the report is "US Electric Bus Battery Pack Market," which aids in identifying and referencing the specific market segment covered.
12. How do I determine which pricing option suits my needs best?
The pricing options vary based on user requirements and access needs. Individual users may opt for single-user licenses, while businesses requiring broader access may choose multi-user or enterprise licenses for cost-effective access to the report.
13. Are there any additional resources or data provided in the US Electric Bus Battery Pack Market report?
While the report offers comprehensive insights, it's advisable to review the specific contents or supplementary materials provided to ascertain if additional resources or data are available.
14. How can I stay updated on further developments or reports in the US Electric Bus Battery Pack Market?
To stay informed about further developments, trends, and reports in the US Electric Bus Battery Pack Market, consider subscribing to industry newsletters, following relevant companies and organizations, or regularly checking reputable industry news sources and publications.
Methodology
Step 1 - Identification of Relevant Samples Size from Population Database


Step 2 - Approaches for Defining Global Market Size (Value, Volume* & Price*)

Note*: In applicable scenarios
Step 3 - Data Sources
Primary Research
- Web Analytics
- Survey Reports
- Research Institute
- Latest Research Reports
- Opinion Leaders
Secondary Research
- Annual Reports
- White Paper
- Latest Press Release
- Industry Association
- Paid Database
- Investor Presentations

Step 4 - Data Triangulation
Involves using different sources of information in order to increase the validity of a study
These sources are likely to be stakeholders in a program - participants, other researchers, program staff, other community members, and so on.
Then we put all data in single framework & apply various statistical tools to find out the dynamic on the market.
During the analysis stage, feedback from the stakeholder groups would be compared to determine areas of agreement as well as areas of divergence


