

Key Insights
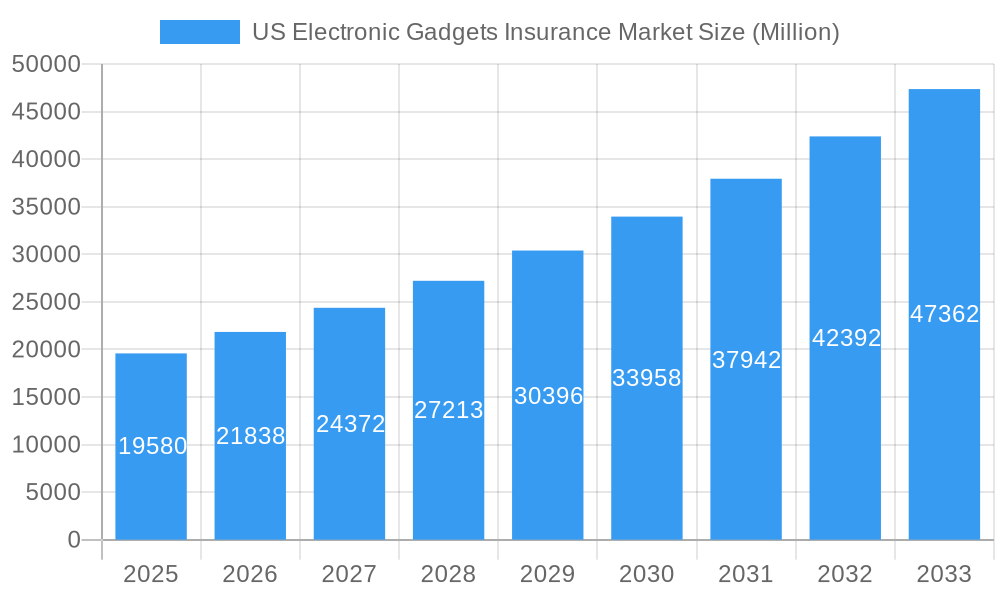
The US electronic gadgets insurance market is experiencing robust growth, projected to reach a significant size driven by increasing ownership of electronic devices like smartphones, laptops, and drones, coupled with rising consumer awareness of the risks of damage, theft, and loss. The market's Compound Annual Growth Rate (CAGR) of 11.54% from 2019-2024 indicates a strong upward trajectory. This growth is fueled by several key factors. Firstly, the increasing affordability and widespread adoption of electronic gadgets across various demographics, particularly among younger generations, have significantly expanded the market's potential customer base. Secondly, the rising prevalence of accidental damage, theft, and loss incidents necessitates insurance coverage as a risk mitigation strategy. Furthermore, innovative insurance products are emerging, offering tailored plans and flexible coverage options, further stimulating market growth. The market is segmented by coverage type (accidental damage, theft & loss), device type (laptops, computers, cameras, mobile devices, drones), and end-users (corporate, individual). North America, especially the United States, dominates the market due to high electronic device penetration and a well-developed insurance sector. Major players like AIG, Progressive, and others are leveraging technological advancements to enhance their offerings and compete effectively. The market's future growth will be influenced by factors such as evolving consumer preferences, technological innovations in gadget manufacturing, and the responsiveness of insurers to emerging risks.
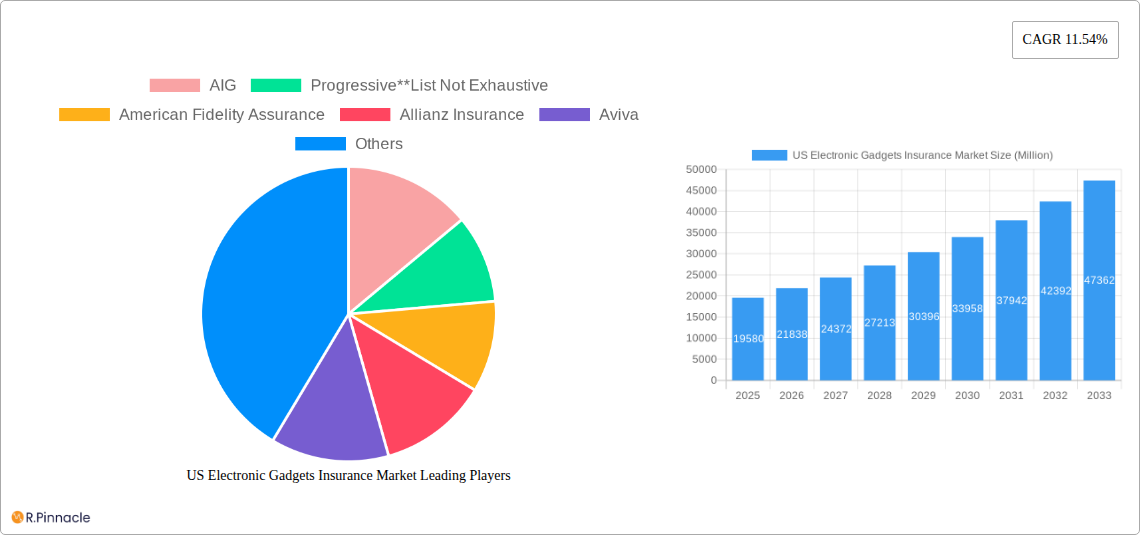
US Electronic Gadgets Insurance Market Market Size (In Billion)
The competitive landscape is characterized by both established insurance providers and emerging players, each vying for market share through innovative product offerings, competitive pricing, and advanced customer service. The expansion of e-commerce and online insurance platforms has made purchasing insurance more accessible, contributing to the overall market growth. Growth is expected to continue, propelled by increasing device affordability, the popularity of premium gadgets, and the enhanced awareness surrounding the need for protection against various risks. Regulatory developments and technological advancements in insurance technologies will also significantly influence the market’s future trajectory. The significant market size, coupled with high CAGR, presents attractive opportunities for both established and new entrants in the coming years. The individual segment is currently larger than the corporate segment, but both are expected to see significant growth in the coming years.
US Electronic Gadgets Insurance Market Company Market Share
US Electronic Gadgets Insurance Market Report: 2019-2033
This comprehensive report provides a detailed analysis of the US Electronic Gadgets Insurance Market, offering actionable insights for industry professionals and investors. With a study period spanning 2019-2033, a base year of 2025, and a forecast period of 2025-2033, this report provides a complete picture of market dynamics and future potential. The market is valued at xx Million in 2025 and is projected to reach xx Million by 2033, exhibiting a CAGR of xx%.
US Electronic Gadgets Insurance Market Market Structure & Innovation Trends
This section analyzes the competitive landscape, innovation drivers, and regulatory aspects of the US Electronic Gadgets Insurance Market. The market shows a moderately concentrated structure with key players such as AIG, Progressive, Assurant Inc, and Allianz Insurance holding significant market share. However, the presence of numerous smaller players indicates a competitive environment. Innovation is driven by the increasing sophistication of electronic gadgets and the rising demand for comprehensive coverage. Regulatory frameworks, including data privacy regulations and consumer protection laws, significantly influence market operations. Product substitutes, such as self-insurance or manufacturer warranties, pose a challenge to market growth. M&A activities in the sector have been moderate, with deal values ranging from xx Million to xx Million in recent years.
- Market Concentration: Moderately concentrated, with top players holding approximately xx% market share.
- Innovation Drivers: Advancement in gadget technology, expanding drone usage, and increasing consumer awareness of insurance needs.
- Regulatory Framework: Compliance with data privacy regulations (e.g., CCPA, GDPR implications) and consumer protection acts.
- M&A Activity: Moderate activity, with deals primarily focused on expanding product offerings and geographic reach. Average deal value: xx Million.
- End-user Demographics: Growing adoption among both corporate and individual users, with corporate users driving higher average policy values.
US Electronic Gadgets Insurance Market Market Dynamics & Trends
The US Electronic Gadgets Insurance Market is experiencing robust growth driven by factors such as rising smartphone penetration, increasing adoption of smart home devices, growing awareness of gadget-related risks, and expanding e-commerce. Technological advancements, such as the Internet of Things (IoT) and Artificial Intelligence (AI), are enabling the development of innovative insurance products and services. Consumer preferences are shifting towards comprehensive coverage options and digital-first experiences. The competitive landscape is dynamic, with established insurers competing with new entrants offering niche products and services. Market penetration remains relatively low, suggesting significant untapped potential for future growth.
Dominant Regions & Segments in US Electronic Gadgets Insurance Market
The US Electronic Gadgets Insurance Market demonstrates strong regional variations. California, New York, and Texas are leading states due to high gadget ownership rates and tech-savvy populations. Among segmentations:
By Coverage Type: Accidental damage coverage dominates the market, driven by the susceptibility of electronic gadgets to physical harm. Theft and loss coverage constitutes a significant portion as well.
By Device Type: Mobile devices represent the largest segment, followed by laptops and computers. The drone insurance segment is exhibiting the highest growth rate.
By End Users: The corporate segment accounts for a larger market share than the individual segment due to higher gadget ownership and the importance of business continuity.
Key Drivers by Region (Examples):
- California: High concentration of tech companies, leading to high demand for corporate insurance solutions.
- New York: High population density and a large consumer base driving demand for individual insurance.
- Texas: Rapid economic growth and technological advancement leading to increased adoption of insured electronics.
US Electronic Gadgets Insurance Market Product Innovations
Recent product innovations focus on providing customized coverage options, digital claims processes, and bundled services. Insurers are leveraging telematics and IoT technologies to offer usage-based insurance and proactive risk management solutions. This includes embedding insurance within smart devices and providing real-time monitoring capabilities. The market is seeing the development of specialized products catering to high-value gadgets and emerging technologies like drones.
Report Scope & Segmentation Analysis
This report covers the US Electronic Gadgets Insurance Market segmented by coverage type (Accidental Damage, Theft and Loss), device type (Laptops, Computers, Cameras, Mobile Devices, Drones), and end-user (Corporate, Individual). Growth projections for each segment vary, with the mobile device and drone segments showing the highest growth potential. The market size for each segment is analyzed, including competitive dynamics within each segment. Detailed analyses are provided for each segment, outlining market size, growth rate, and leading players.
Key Drivers of US Electronic Gadgets Insurance Market Growth
The market's growth is propelled by factors such as increasing gadget ownership, rising disposable incomes, growing consumer awareness of risks associated with electronic devices, and supportive regulatory measures. Technological advancements in areas such as AI and IoT are also driving innovation and product development, creating new opportunities for growth. Government initiatives promoting digital adoption further contribute to the market's expansion.
Challenges in the US Electronic Gadgets Insurance Market Sector
Challenges include high claims frequency, fraud risks, complexities associated with determining gadget value and repair costs, and intense competition from both established and new players. Furthermore, evolving technology presents challenges in terms of coverage and claims handling, especially with respect to emerging technologies such as drones. Regulatory uncertainties can impact pricing and market penetration.
Emerging Opportunities in US Electronic Gadgets Insurance Market
Emerging opportunities include expanding coverage to newer technologies like wearables and virtual reality devices, tapping into the growing market for drone insurance, and leveraging AI-powered solutions for fraud detection and risk assessment. Customized insurance solutions catered to specific consumer needs and offering bundled services present lucrative avenues for growth. Expansion into underserved regions and demographics also offers significant market potential.
Leading Players in the US Electronic Gadgets Insurance Market Market
- AIG
- Progressive
- American Fidelity Assurance
- Allianz Insurance
- Aviva
- AXA
- Chubb
- Assurant Inc
- AT&T Inc
- Amica Mutual Insurance
Key Developments in US Electronic Gadgets Insurance Market Industry
October 2023: Bolttech and Allianz Partners partnered to launch insurance solutions for embedded devices and appliances in the United States. This expands the reach of embedded insurance, increasing market penetration.
February 2023: Moonrock Insurance, in collaboration with Apollo Insurance, unveiled innovative drone insurance. This addresses the growing need for specialized drone insurance, tapping into a rapidly expanding market segment.
Future Outlook for US Electronic Gadgets Insurance Market Market
The US Electronic Gadgets Insurance Market is poised for significant growth, driven by continued technological advancements, increasing gadget ownership, and evolving consumer preferences. Strategic partnerships, innovative product offerings, and effective risk management will be key success factors for players in this dynamic market. The market is expected to witness sustained growth in the coming years, propelled by the continued adoption of smart devices and emerging technologies.
US Electronic Gadgets Insurance Market Segmentation
-
1. Coverage Type
- 1.1. Accidental Damage
- 1.2. Theft and Loss
-
2. Device Type
- 2.1. Laptops
- 2.2. Computers
- 2.3. Cameras
- 2.4. Mobile Devices
- 2.5. Drones
-
3. End Users
- 3.1. Corporate
- 3.2. Individual
US Electronic Gadgets Insurance Market Segmentation By Geography
-
1. North America
- 1.1. United States
- 1.2. Canada
- 1.3. Mexico
-
2. South America
- 2.1. Brazil
- 2.2. Argentina
- 2.3. Rest of South America
-
3. Europe
- 3.1. United Kingdom
- 3.2. Germany
- 3.3. France
- 3.4. Italy
- 3.5. Spain
- 3.6. Russia
- 3.7. Benelux
- 3.8. Nordics
- 3.9. Rest of Europe
-
4. Middle East & Africa
- 4.1. Turkey
- 4.2. Israel
- 4.3. GCC
- 4.4. North Africa
- 4.5. South Africa
- 4.6. Rest of Middle East & Africa
-
5. Asia Pacific
- 5.1. China
- 5.2. India
- 5.3. Japan
- 5.4. South Korea
- 5.5. ASEAN
- 5.6. Oceania
- 5.7. Rest of Asia Pacific
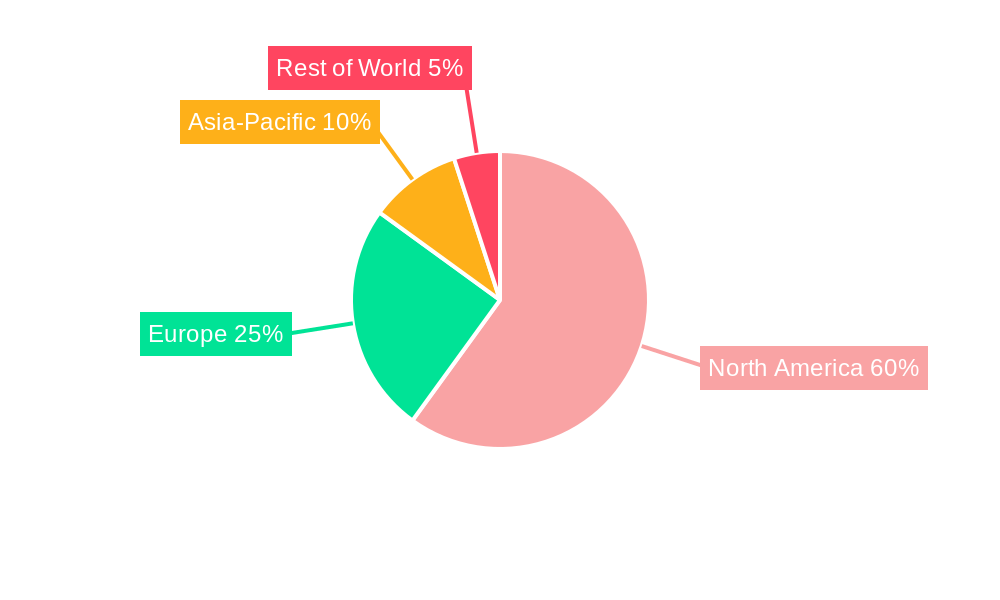
US Electronic Gadgets Insurance Market Regional Market Share
Geographic Coverage of US Electronic Gadgets Insurance Market
US Electronic Gadgets Insurance Market REPORT HIGHLIGHTS
| Aspects | Details |
|---|---|
| Study Period | 2020-2034 |
| Base Year | 2025 |
| Estimated Year | 2026 |
| Forecast Period | 2026-2034 |
| Historical Period | 2020-2025 |
| Growth Rate | CAGR of 11.54% from 2020-2034 |
| Segmentation |
|
Table of Contents
- 1. Introduction
- 1.1. Research Scope
- 1.2. Market Segmentation
- 1.3. Research Objective
- 1.4. Definitions and Assumptions
- 2. Executive Summary
- 2.1. Market Snapshot
- 3. Market Dynamics
- 3.1. Market Drivers
- 3.2. Market Restrains
- 3.3. Market Trends
- 3.4. Market Opportunities
- 4. Market Factor Analysis
- 4.1. Porters Five Forces
- 4.1.1. Bargaining Power of Suppliers
- 4.1.2. Bargaining Power of Buyers
- 4.1.3. Threat of New Entrants
- 4.1.4. Threat of Substitutes
- 4.1.5. Competitive Rivalry
- 4.2. PESTEL analysis
- 4.3. BCG Analysis
- 4.3.1. Stars (High Growth, High Market Share)
- 4.3.2. Cash Cows (Low Growth, High Market Share)
- 4.3.3. Question Mark (High Growth, Low Market Share)
- 4.3.4. Dogs (Low Growth, Low Market Share)
- 4.4. Ansoff Matrix Analysis
- 4.5. Supply Chain Analysis
- 4.6. Regulatory Landscape
- 4.7. Current Market Potential and Opportunity Assessment (TAM–SAM–SOM Framework)
- 4.8. PRI Analyst Note
- 4.1. Porters Five Forces
- 5. Market Analysis, Insights and Forecast 2021-2033
- 5.1. Market Analysis, Insights and Forecast - by Coverage Type
- 5.1.1. Accidental Damage
- 5.1.2. Theft and Loss
- 5.2. Market Analysis, Insights and Forecast - by Device Type
- 5.2.1. Laptops
- 5.2.2. Computers
- 5.2.3. Cameras
- 5.2.4. Mobile Devices
- 5.2.5. Drones
- 5.3. Market Analysis, Insights and Forecast - by End Users
- 5.3.1. Corporate
- 5.3.2. Individual
- 5.4. Market Analysis, Insights and Forecast - by Region
- 5.4.1. North America
- 5.4.2. South America
- 5.4.3. Europe
- 5.4.4. Middle East & Africa
- 5.4.5. Asia Pacific
- 5.1. Market Analysis, Insights and Forecast - by Coverage Type
- 6. Global US Electronic Gadgets Insurance Market Analysis, Insights and Forecast, 2021-2033
- 6.1. Market Analysis, Insights and Forecast - by Coverage Type
- 6.1.1. Accidental Damage
- 6.1.2. Theft and Loss
- 6.2. Market Analysis, Insights and Forecast - by Device Type
- 6.2.1. Laptops
- 6.2.2. Computers
- 6.2.3. Cameras
- 6.2.4. Mobile Devices
- 6.2.5. Drones
- 6.3. Market Analysis, Insights and Forecast - by End Users
- 6.3.1. Corporate
- 6.3.2. Individual
- 6.1. Market Analysis, Insights and Forecast - by Coverage Type
- 7. North America US Electronic Gadgets Insurance Market Analysis, Insights and Forecast, 2020-2032
- 7.1. Market Analysis, Insights and Forecast - by Coverage Type
- 7.1.1. Accidental Damage
- 7.1.2. Theft and Loss
- 7.2. Market Analysis, Insights and Forecast - by Device Type
- 7.2.1. Laptops
- 7.2.2. Computers
- 7.2.3. Cameras
- 7.2.4. Mobile Devices
- 7.2.5. Drones
- 7.3. Market Analysis, Insights and Forecast - by End Users
- 7.3.1. Corporate
- 7.3.2. Individual
- 7.1. Market Analysis, Insights and Forecast - by Coverage Type
- 8. South America US Electronic Gadgets Insurance Market Analysis, Insights and Forecast, 2020-2032
- 8.1. Market Analysis, Insights and Forecast - by Coverage Type
- 8.1.1. Accidental Damage
- 8.1.2. Theft and Loss
- 8.2. Market Analysis, Insights and Forecast - by Device Type
- 8.2.1. Laptops
- 8.2.2. Computers
- 8.2.3. Cameras
- 8.2.4. Mobile Devices
- 8.2.5. Drones
- 8.3. Market Analysis, Insights and Forecast - by End Users
- 8.3.1. Corporate
- 8.3.2. Individual
- 8.1. Market Analysis, Insights and Forecast - by Coverage Type
- 9. Europe US Electronic Gadgets Insurance Market Analysis, Insights and Forecast, 2020-2032
- 9.1. Market Analysis, Insights and Forecast - by Coverage Type
- 9.1.1. Accidental Damage
- 9.1.2. Theft and Loss
- 9.2. Market Analysis, Insights and Forecast - by Device Type
- 9.2.1. Laptops
- 9.2.2. Computers
- 9.2.3. Cameras
- 9.2.4. Mobile Devices
- 9.2.5. Drones
- 9.3. Market Analysis, Insights and Forecast - by End Users
- 9.3.1. Corporate
- 9.3.2. Individual
- 9.1. Market Analysis, Insights and Forecast - by Coverage Type
- 10. Middle East & Africa US Electronic Gadgets Insurance Market Analysis, Insights and Forecast, 2020-2032
- 10.1. Market Analysis, Insights and Forecast - by Coverage Type
- 10.1.1. Accidental Damage
- 10.1.2. Theft and Loss
- 10.2. Market Analysis, Insights and Forecast - by Device Type
- 10.2.1. Laptops
- 10.2.2. Computers
- 10.2.3. Cameras
- 10.2.4. Mobile Devices
- 10.2.5. Drones
- 10.3. Market Analysis, Insights and Forecast - by End Users
- 10.3.1. Corporate
- 10.3.2. Individual
- 10.1. Market Analysis, Insights and Forecast - by Coverage Type
- 11. Asia Pacific US Electronic Gadgets Insurance Market Analysis, Insights and Forecast, 2020-2032
- 11.1. Market Analysis, Insights and Forecast - by Coverage Type
- 11.1.1. Accidental Damage
- 11.1.2. Theft and Loss
- 11.2. Market Analysis, Insights and Forecast - by Device Type
- 11.2.1. Laptops
- 11.2.2. Computers
- 11.2.3. Cameras
- 11.2.4. Mobile Devices
- 11.2.5. Drones
- 11.3. Market Analysis, Insights and Forecast - by End Users
- 11.3.1. Corporate
- 11.3.2. Individual
- 11.1. Market Analysis, Insights and Forecast - by Coverage Type
- 12. Competitive Analysis
- 12.1. Company Profiles
- 12.1.1 AIG
- 12.1.1.1. Company Overview
- 12.1.1.2. Products
- 12.1.1.3. Company Financials
- 12.1.1.4. SWOT Analysis
- 12.1.2 Progressive**List Not Exhaustive
- 12.1.2.1. Company Overview
- 12.1.2.2. Products
- 12.1.2.3. Company Financials
- 12.1.2.4. SWOT Analysis
- 12.1.3 American Fidelity Assurance
- 12.1.3.1. Company Overview
- 12.1.3.2. Products
- 12.1.3.3. Company Financials
- 12.1.3.4. SWOT Analysis
- 12.1.4 Allianz Insurance
- 12.1.4.1. Company Overview
- 12.1.4.2. Products
- 12.1.4.3. Company Financials
- 12.1.4.4. SWOT Analysis
- 12.1.5 Aviva
- 12.1.5.1. Company Overview
- 12.1.5.2. Products
- 12.1.5.3. Company Financials
- 12.1.5.4. SWOT Analysis
- 12.1.6 AXA
- 12.1.6.1. Company Overview
- 12.1.6.2. Products
- 12.1.6.3. Company Financials
- 12.1.6.4. SWOT Analysis
- 12.1.7 Chubb
- 12.1.7.1. Company Overview
- 12.1.7.2. Products
- 12.1.7.3. Company Financials
- 12.1.7.4. SWOT Analysis
- 12.1.8 Assurant Inc
- 12.1.8.1. Company Overview
- 12.1.8.2. Products
- 12.1.8.3. Company Financials
- 12.1.8.4. SWOT Analysis
- 12.1.9 AT&T Inc
- 12.1.9.1. Company Overview
- 12.1.9.2. Products
- 12.1.9.3. Company Financials
- 12.1.9.4. SWOT Analysis
- 12.1.10 Amica Mutual Insurance
- 12.1.10.1. Company Overview
- 12.1.10.2. Products
- 12.1.10.3. Company Financials
- 12.1.10.4. SWOT Analysis
- 12.1.1 AIG
- 12.2. Market Entropy
- 12.2.1 Company's Key Areas Served
- 12.2.2 Recent Developments
- 12.3. Company Market Share Analysis 2025
- 12.3.1 Top 5 Companies Market Share Analysis
- 12.3.2 Top 3 Companies Market Share Analysis
- 12.4. List of Potential Customers
- 13. Research Methodology
List of Figures
- Figure 1: Global US Electronic Gadgets Insurance Market Revenue Breakdown (Million, %) by Region 2025 & 2033
- Figure 2: North America US Electronic Gadgets Insurance Market Revenue (Million), by Coverage Type 2025 & 2033
- Figure 3: North America US Electronic Gadgets Insurance Market Revenue Share (%), by Coverage Type 2025 & 2033
- Figure 4: North America US Electronic Gadgets Insurance Market Revenue (Million), by Device Type 2025 & 2033
- Figure 5: North America US Electronic Gadgets Insurance Market Revenue Share (%), by Device Type 2025 & 2033
- Figure 6: North America US Electronic Gadgets Insurance Market Revenue (Million), by End Users 2025 & 2033
- Figure 7: North America US Electronic Gadgets Insurance Market Revenue Share (%), by End Users 2025 & 2033
- Figure 8: North America US Electronic Gadgets Insurance Market Revenue (Million), by Country 2025 & 2033
- Figure 9: North America US Electronic Gadgets Insurance Market Revenue Share (%), by Country 2025 & 2033
- Figure 10: South America US Electronic Gadgets Insurance Market Revenue (Million), by Coverage Type 2025 & 2033
- Figure 11: South America US Electronic Gadgets Insurance Market Revenue Share (%), by Coverage Type 2025 & 2033
- Figure 12: South America US Electronic Gadgets Insurance Market Revenue (Million), by Device Type 2025 & 2033
- Figure 13: South America US Electronic Gadgets Insurance Market Revenue Share (%), by Device Type 2025 & 2033
- Figure 14: South America US Electronic Gadgets Insurance Market Revenue (Million), by End Users 2025 & 2033
- Figure 15: South America US Electronic Gadgets Insurance Market Revenue Share (%), by End Users 2025 & 2033
- Figure 16: South America US Electronic Gadgets Insurance Market Revenue (Million), by Country 2025 & 2033
- Figure 17: South America US Electronic Gadgets Insurance Market Revenue Share (%), by Country 2025 & 2033
- Figure 18: Europe US Electronic Gadgets Insurance Market Revenue (Million), by Coverage Type 2025 & 2033
- Figure 19: Europe US Electronic Gadgets Insurance Market Revenue Share (%), by Coverage Type 2025 & 2033
- Figure 20: Europe US Electronic Gadgets Insurance Market Revenue (Million), by Device Type 2025 & 2033
- Figure 21: Europe US Electronic Gadgets Insurance Market Revenue Share (%), by Device Type 2025 & 2033
- Figure 22: Europe US Electronic Gadgets Insurance Market Revenue (Million), by End Users 2025 & 2033
- Figure 23: Europe US Electronic Gadgets Insurance Market Revenue Share (%), by End Users 2025 & 2033
- Figure 24: Europe US Electronic Gadgets Insurance Market Revenue (Million), by Country 2025 & 2033
- Figure 25: Europe US Electronic Gadgets Insurance Market Revenue Share (%), by Country 2025 & 2033
- Figure 26: Middle East & Africa US Electronic Gadgets Insurance Market Revenue (Million), by Coverage Type 2025 & 2033
- Figure 27: Middle East & Africa US Electronic Gadgets Insurance Market Revenue Share (%), by Coverage Type 2025 & 2033
- Figure 28: Middle East & Africa US Electronic Gadgets Insurance Market Revenue (Million), by Device Type 2025 & 2033
- Figure 29: Middle East & Africa US Electronic Gadgets Insurance Market Revenue Share (%), by Device Type 2025 & 2033
- Figure 30: Middle East & Africa US Electronic Gadgets Insurance Market Revenue (Million), by End Users 2025 & 2033
- Figure 31: Middle East & Africa US Electronic Gadgets Insurance Market Revenue Share (%), by End Users 2025 & 2033
- Figure 32: Middle East & Africa US Electronic Gadgets Insurance Market Revenue (Million), by Country 2025 & 2033
- Figure 33: Middle East & Africa US Electronic Gadgets Insurance Market Revenue Share (%), by Country 2025 & 2033
- Figure 34: Asia Pacific US Electronic Gadgets Insurance Market Revenue (Million), by Coverage Type 2025 & 2033
- Figure 35: Asia Pacific US Electronic Gadgets Insurance Market Revenue Share (%), by Coverage Type 2025 & 2033
- Figure 36: Asia Pacific US Electronic Gadgets Insurance Market Revenue (Million), by Device Type 2025 & 2033
- Figure 37: Asia Pacific US Electronic Gadgets Insurance Market Revenue Share (%), by Device Type 2025 & 2033
- Figure 38: Asia Pacific US Electronic Gadgets Insurance Market Revenue (Million), by End Users 2025 & 2033
- Figure 39: Asia Pacific US Electronic Gadgets Insurance Market Revenue Share (%), by End Users 2025 & 2033
- Figure 40: Asia Pacific US Electronic Gadgets Insurance Market Revenue (Million), by Country 2025 & 2033
- Figure 41: Asia Pacific US Electronic Gadgets Insurance Market Revenue Share (%), by Country 2025 & 2033
List of Tables
- Table 1: Global US Electronic Gadgets Insurance Market Revenue Million Forecast, by Coverage Type 2020 & 2033
- Table 2: Global US Electronic Gadgets Insurance Market Revenue Million Forecast, by Device Type 2020 & 2033
- Table 3: Global US Electronic Gadgets Insurance Market Revenue Million Forecast, by End Users 2020 & 2033
- Table 4: Global US Electronic Gadgets Insurance Market Revenue Million Forecast, by Region 2020 & 2033
- Table 5: Global US Electronic Gadgets Insurance Market Revenue Million Forecast, by Coverage Type 2020 & 2033
- Table 6: Global US Electronic Gadgets Insurance Market Revenue Million Forecast, by Device Type 2020 & 2033
- Table 7: Global US Electronic Gadgets Insurance Market Revenue Million Forecast, by End Users 2020 & 2033
- Table 8: Global US Electronic Gadgets Insurance Market Revenue Million Forecast, by Country 2020 & 2033
- Table 9: United States US Electronic Gadgets Insurance Market Revenue (Million) Forecast, by Application 2020 & 2033
- Table 10: Canada US Electronic Gadgets Insurance Market Revenue (Million) Forecast, by Application 2020 & 2033
- Table 11: Mexico US Electronic Gadgets Insurance Market Revenue (Million) Forecast, by Application 2020 & 2033
- Table 12: Global US Electronic Gadgets Insurance Market Revenue Million Forecast, by Coverage Type 2020 & 2033
- Table 13: Global US Electronic Gadgets Insurance Market Revenue Million Forecast, by Device Type 2020 & 2033
- Table 14: Global US Electronic Gadgets Insurance Market Revenue Million Forecast, by End Users 2020 & 2033
- Table 15: Global US Electronic Gadgets Insurance Market Revenue Million Forecast, by Country 2020 & 2033
- Table 16: Brazil US Electronic Gadgets Insurance Market Revenue (Million) Forecast, by Application 2020 & 2033
- Table 17: Argentina US Electronic Gadgets Insurance Market Revenue (Million) Forecast, by Application 2020 & 2033
- Table 18: Rest of South America US Electronic Gadgets Insurance Market Revenue (Million) Forecast, by Application 2020 & 2033
- Table 19: Global US Electronic Gadgets Insurance Market Revenue Million Forecast, by Coverage Type 2020 & 2033
- Table 20: Global US Electronic Gadgets Insurance Market Revenue Million Forecast, by Device Type 2020 & 2033
- Table 21: Global US Electronic Gadgets Insurance Market Revenue Million Forecast, by End Users 2020 & 2033
- Table 22: Global US Electronic Gadgets Insurance Market Revenue Million Forecast, by Country 2020 & 2033
- Table 23: United Kingdom US Electronic Gadgets Insurance Market Revenue (Million) Forecast, by Application 2020 & 2033
- Table 24: Germany US Electronic Gadgets Insurance Market Revenue (Million) Forecast, by Application 2020 & 2033
- Table 25: France US Electronic Gadgets Insurance Market Revenue (Million) Forecast, by Application 2020 & 2033
- Table 26: Italy US Electronic Gadgets Insurance Market Revenue (Million) Forecast, by Application 2020 & 2033
- Table 27: Spain US Electronic Gadgets Insurance Market Revenue (Million) Forecast, by Application 2020 & 2033
- Table 28: Russia US Electronic Gadgets Insurance Market Revenue (Million) Forecast, by Application 2020 & 2033
- Table 29: Benelux US Electronic Gadgets Insurance Market Revenue (Million) Forecast, by Application 2020 & 2033
- Table 30: Nordics US Electronic Gadgets Insurance Market Revenue (Million) Forecast, by Application 2020 & 2033
- Table 31: Rest of Europe US Electronic Gadgets Insurance Market Revenue (Million) Forecast, by Application 2020 & 2033
- Table 32: Global US Electronic Gadgets Insurance Market Revenue Million Forecast, by Coverage Type 2020 & 2033
- Table 33: Global US Electronic Gadgets Insurance Market Revenue Million Forecast, by Device Type 2020 & 2033
- Table 34: Global US Electronic Gadgets Insurance Market Revenue Million Forecast, by End Users 2020 & 2033
- Table 35: Global US Electronic Gadgets Insurance Market Revenue Million Forecast, by Country 2020 & 2033
- Table 36: Turkey US Electronic Gadgets Insurance Market Revenue (Million) Forecast, by Application 2020 & 2033
- Table 37: Israel US Electronic Gadgets Insurance Market Revenue (Million) Forecast, by Application 2020 & 2033
- Table 38: GCC US Electronic Gadgets Insurance Market Revenue (Million) Forecast, by Application 2020 & 2033
- Table 39: North Africa US Electronic Gadgets Insurance Market Revenue (Million) Forecast, by Application 2020 & 2033
- Table 40: South Africa US Electronic Gadgets Insurance Market Revenue (Million) Forecast, by Application 2020 & 2033
- Table 41: Rest of Middle East & Africa US Electronic Gadgets Insurance Market Revenue (Million) Forecast, by Application 2020 & 2033
- Table 42: Global US Electronic Gadgets Insurance Market Revenue Million Forecast, by Coverage Type 2020 & 2033
- Table 43: Global US Electronic Gadgets Insurance Market Revenue Million Forecast, by Device Type 2020 & 2033
- Table 44: Global US Electronic Gadgets Insurance Market Revenue Million Forecast, by End Users 2020 & 2033
- Table 45: Global US Electronic Gadgets Insurance Market Revenue Million Forecast, by Country 2020 & 2033
- Table 46: China US Electronic Gadgets Insurance Market Revenue (Million) Forecast, by Application 2020 & 2033
- Table 47: India US Electronic Gadgets Insurance Market Revenue (Million) Forecast, by Application 2020 & 2033
- Table 48: Japan US Electronic Gadgets Insurance Market Revenue (Million) Forecast, by Application 2020 & 2033
- Table 49: South Korea US Electronic Gadgets Insurance Market Revenue (Million) Forecast, by Application 2020 & 2033
- Table 50: ASEAN US Electronic Gadgets Insurance Market Revenue (Million) Forecast, by Application 2020 & 2033
- Table 51: Oceania US Electronic Gadgets Insurance Market Revenue (Million) Forecast, by Application 2020 & 2033
- Table 52: Rest of Asia Pacific US Electronic Gadgets Insurance Market Revenue (Million) Forecast, by Application 2020 & 2033
Frequently Asked Questions
1. What is the projected Compound Annual Growth Rate (CAGR) of the US Electronic Gadgets Insurance Market?
The projected CAGR is approximately 11.54%.
2. Which companies are prominent players in the US Electronic Gadgets Insurance Market?
Key companies in the market include AIG, Progressive**List Not Exhaustive, American Fidelity Assurance, Allianz Insurance, Aviva, AXA, Chubb, Assurant Inc, AT&T Inc, Amica Mutual Insurance.
3. What are the main segments of the US Electronic Gadgets Insurance Market?
The market segments include Coverage Type, Device Type, End Users.
4. Can you provide details about the market size?
The market size is estimated to be USD 19.58 Million as of 2022.
5. What are some drivers contributing to market growth?
Increse in Consumer spending for Electronic gadgets.; Rising living living standard of the the people.
6. What are the notable trends driving market growth?
Increase In Demand For Electronic Gadget Post Pandemic.
7. Are there any restraints impacting market growth?
Fluctuation in price of electronic gadgets raw material.; Fragmented market in electronic gadgets insurance business.
8. Can you provide examples of recent developments in the market?
In October 2023, Bolttech and Allianz Partners partnered to launch insurance solutions for embedded devices and appliances in the United States.
9. What pricing options are available for accessing the report?
Pricing options include single-user, multi-user, and enterprise licenses priced at USD 3800, USD 4500, and USD 5800 respectively.
10. Is the market size provided in terms of value or volume?
The market size is provided in terms of value, measured in Million.
11. Are there any specific market keywords associated with the report?
Yes, the market keyword associated with the report is "US Electronic Gadgets Insurance Market," which aids in identifying and referencing the specific market segment covered.
12. How do I determine which pricing option suits my needs best?
The pricing options vary based on user requirements and access needs. Individual users may opt for single-user licenses, while businesses requiring broader access may choose multi-user or enterprise licenses for cost-effective access to the report.
13. Are there any additional resources or data provided in the US Electronic Gadgets Insurance Market report?
While the report offers comprehensive insights, it's advisable to review the specific contents or supplementary materials provided to ascertain if additional resources or data are available.
14. How can I stay updated on further developments or reports in the US Electronic Gadgets Insurance Market?
To stay informed about further developments, trends, and reports in the US Electronic Gadgets Insurance Market, consider subscribing to industry newsletters, following relevant companies and organizations, or regularly checking reputable industry news sources and publications.
Methodology
Step 1 - Identification of Relevant Samples Size from Population Database


Step 2 - Approaches for Defining Global Market Size (Value, Volume* & Price*)

Note*: In applicable scenarios
Step 3 - Data Sources
Primary Research
- Web Analytics
- Survey Reports
- Research Institute
- Latest Research Reports
- Opinion Leaders
Secondary Research
- Annual Reports
- White Paper
- Latest Press Release
- Industry Association
- Paid Database
- Investor Presentations

Step 4 - Data Triangulation
Involves using different sources of information in order to increase the validity of a study
These sources are likely to be stakeholders in a program - participants, other researchers, program staff, other community members, and so on.
Then we put all data in single framework & apply various statistical tools to find out the dynamic on the market.
During the analysis stage, feedback from the stakeholder groups would be compared to determine areas of agreement as well as areas of divergence