

Key Insights
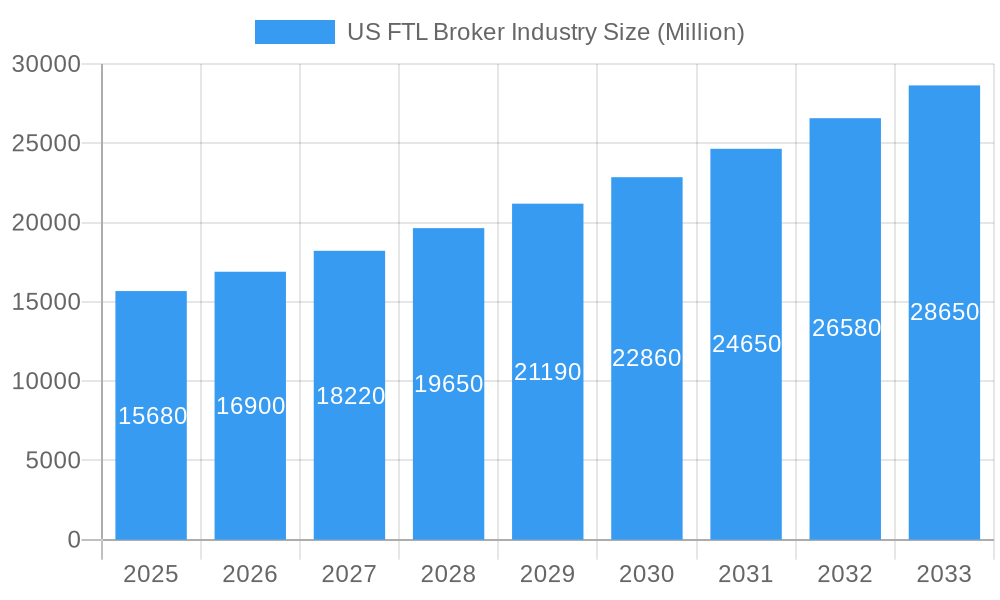
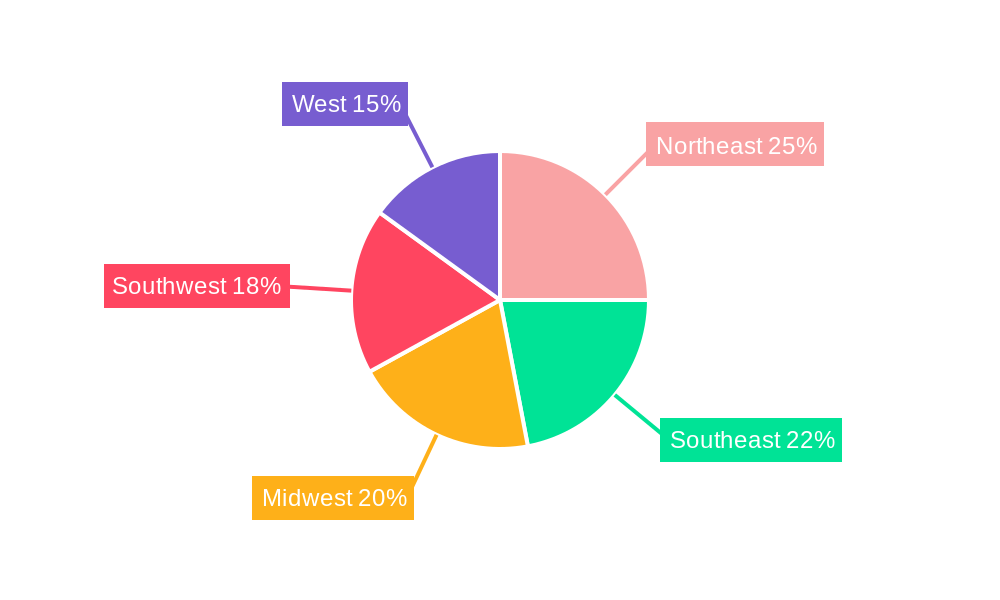
The US Full Truckload (FTL) Brokerage market, valued at $15.68 billion in 2025, is projected to experience robust growth, exhibiting a Compound Annual Growth Rate (CAGR) of 7.86% from 2025 to 2033. This expansion is fueled by several key drivers. The increasing reliance on outsourced logistics solutions by businesses of all sizes seeking efficiency and cost optimization is a primary factor. E-commerce's continued surge necessitates efficient and reliable freight solutions, further boosting demand for FTL brokerage services. Technological advancements, such as sophisticated transportation management systems (TMS) and advanced data analytics, are streamlining operations and enhancing transparency across the supply chain. Moreover, the ongoing expansion of the manufacturing and automotive sectors, coupled with growth in construction and e-commerce, contributes significantly to the market's upward trajectory. However, factors like fluctuating fuel prices, driver shortages, and regulatory changes pose challenges to consistent growth. The market is segmented by end-user industries, with manufacturing and automotive, oil and gas, and construction representing significant segments. Major players like Coyote Logistics, CH Robinson, and J.B. Hunt Transport dominate the landscape, constantly innovating to maintain their competitive edge. Regional variations exist within the US market, with regions like the Northeast and Southeast experiencing strong growth due to high industrial activity and population density. The forecast period of 2025-2033 offers significant opportunities for existing players and new entrants alike to capitalize on the market's growth potential through strategic partnerships, technological integration, and efficient operational strategies.
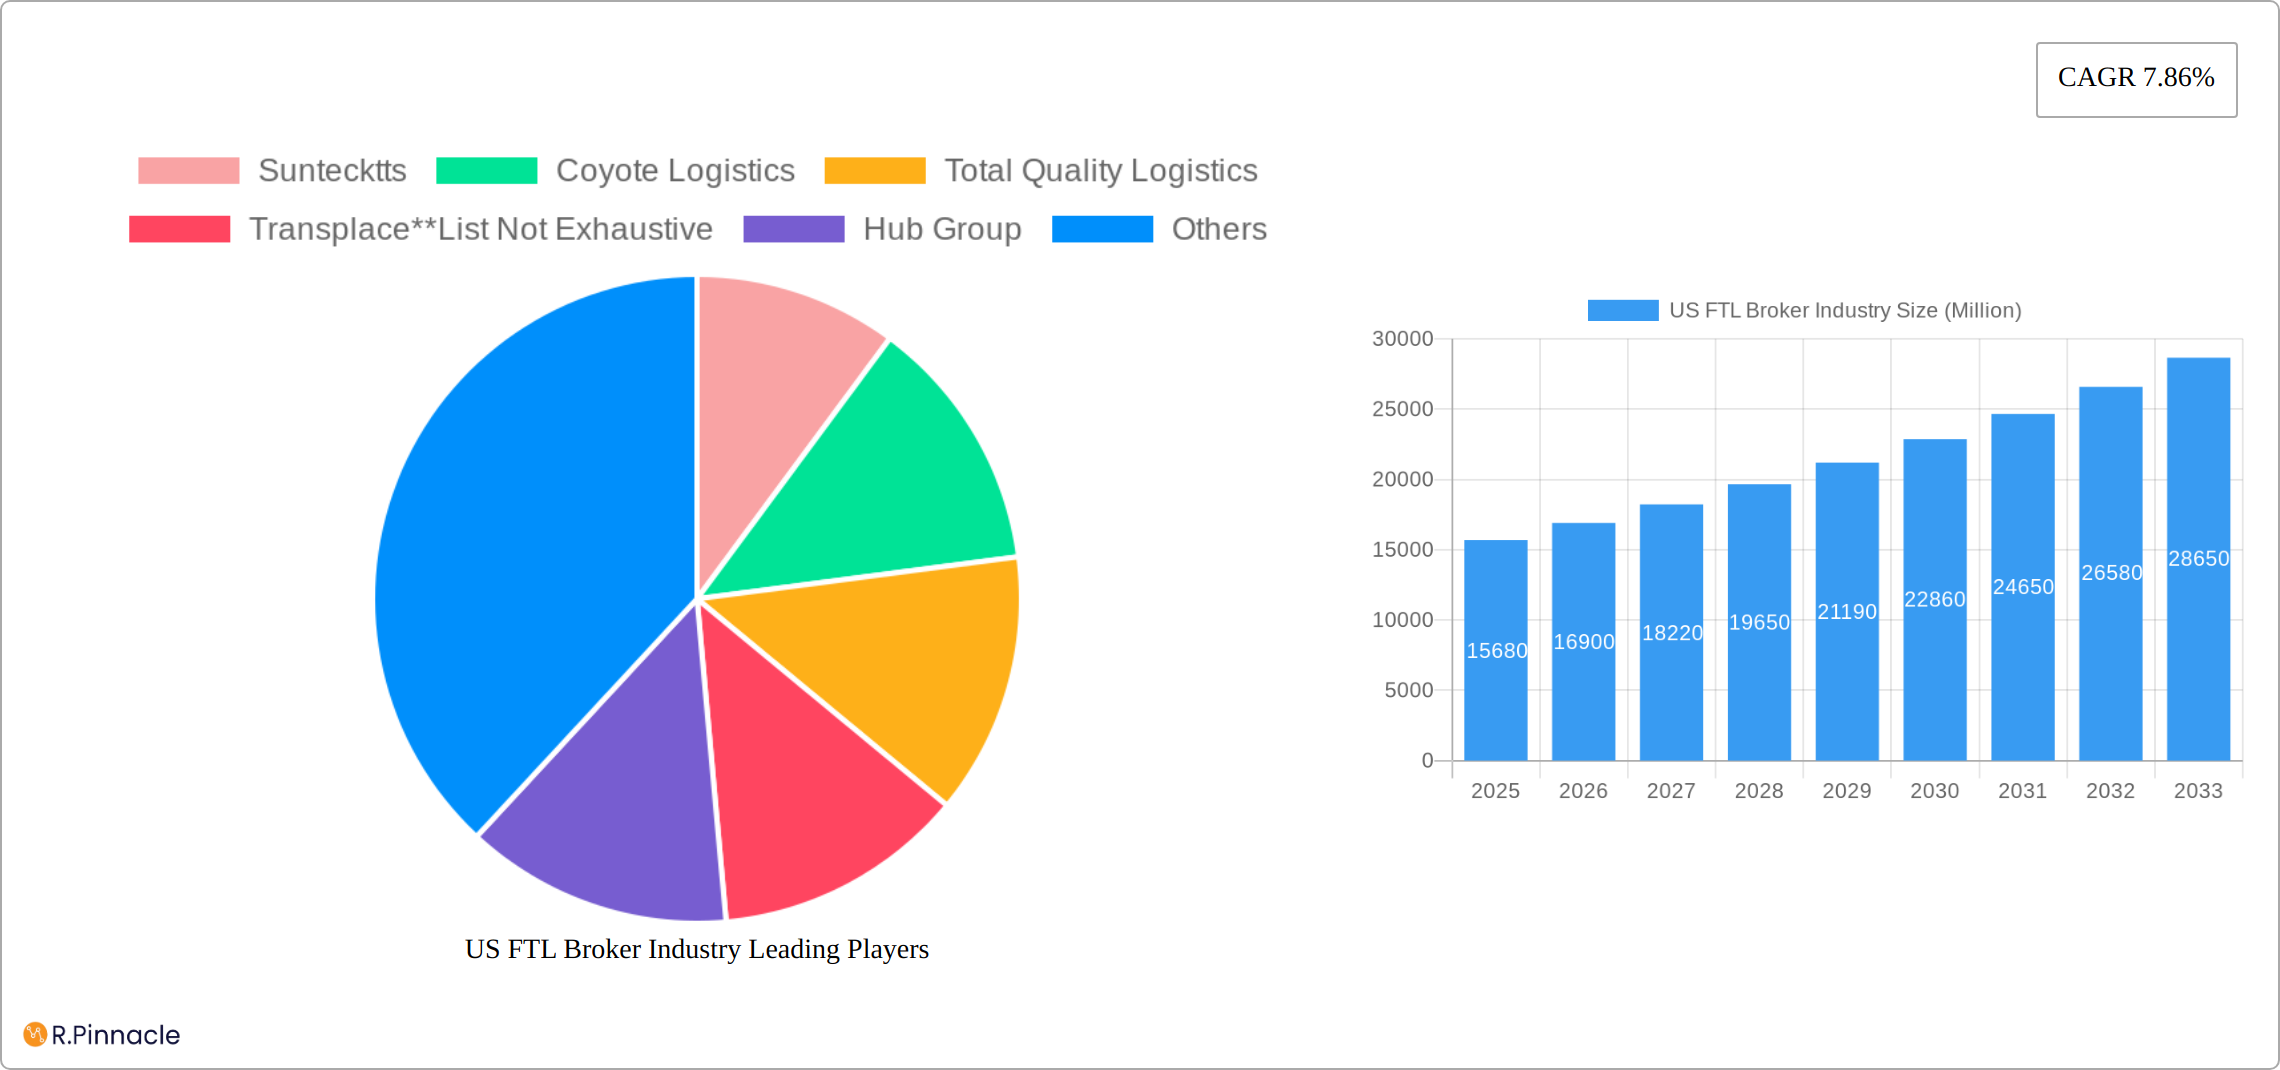
US FTL Broker Industry Market Size (In Billion)
The competitive landscape is highly fragmented, with a mix of large multinational corporations and smaller, specialized brokerage firms. Successful players are characterized by their robust technological infrastructure, strong carrier networks, and ability to offer comprehensive, customized solutions. While driver shortages and fuel price volatility present headwinds, the long-term outlook for the US FTL brokerage market remains positive, driven by consistent growth in e-commerce, manufacturing, and construction. The market's evolution will likely be characterized by increasing adoption of digital technologies, enhancing transparency and efficiency throughout the supply chain, and a continued focus on providing value-added services to clients seeking customized, cost-effective solutions. This will lead to further consolidation and potentially higher barriers to entry as companies invest in advanced technologies and talent acquisition.
US FTL Broker Industry Company Market Share
US FTL Broker Industry Report: 2019-2033
This comprehensive report provides an in-depth analysis of the US Full Truckload (FTL) Broker industry, offering invaluable insights for industry professionals, investors, and strategic planners. The report covers market size, growth trends, competitive landscape, and future outlook, using data from 2019 to 2024 (historical period), with projections extending to 2033. The base year for estimations is 2025.
US FTL Broker Industry Market Structure & Innovation Trends
The US Full Truckload (FTL) brokerage market is a dynamic landscape shaped by a complex interplay of established players, emerging technologies, and evolving regulatory environments. The market structure is characterized by a blend of large multinational corporations and smaller, specialized firms, resulting in moderate concentration. While precise market share figures for 2025 require further specification (replace "xx%" with accurate data), the top 10 players undoubtedly hold a significant portion. Intense mergers and acquisitions (M&A) activity, totaling an estimated [Insert Accurate Dollar Amount] in the past 5 years, underscores the ongoing consolidation within the sector. This consolidation is driven by a pursuit of economies of scale, broader service portfolios, and increased market dominance. The average deal size is estimated at [Insert Accurate Dollar Amount].
- Key Players: This is not an exhaustive list, but prominent players include SunteckTTS, Coyote Logistics, Total Quality Logistics (TQL), Transplace, Hub Group, Landstar System Inc., C.H. Robinson, BNSF Logistics LLC, XPO Logistics Inc., Worldwide Express, Schneider, Echo Global Logistics, J.B. Hunt Transport Inc., and KAG Logistics Inc. The competitive landscape also includes numerous regional and specialized brokers.
- Innovation Drivers: The industry is propelled by several key innovation drivers:
- Technological Advancements: Digital freight matching platforms, AI-powered route optimization, predictive analytics, and real-time tracking and visibility systems are transforming operational efficiency and decision-making.
- Regulatory Changes: Evolving federal and state regulations regarding safety, insurance, and pricing transparency directly impact operational strategies and competitive dynamics.
- Evolving Customer Demands: Shippers increasingly demand greater transparency, enhanced visibility, and integrated logistics solutions that extend beyond basic transportation.
- Regulatory Framework: The industry operates under a complex web of federal and state regulations covering safety standards (FMCSA regulations), insurance requirements, and pricing transparency (antitrust concerns). Compliance is crucial for maintaining operational viability and avoiding penalties.
- Product Substitutes: Businesses may consider alternative transportation modes such as Less-than-Truckload (LTL) shipping, intermodal transportation (rail and truck combinations), or even private fleets depending on their specific shipping needs and cost-benefit analysis.
- M&A Activities: Consolidation through mergers and acquisitions remains a powerful trend, allowing larger companies to expand their geographic reach, increase service offerings (e.g., adding warehousing or last-mile delivery), and improve overall operational efficiency.
US FTL Broker Industry Market Dynamics & Trends
The US FTL Broker market exhibits robust growth, driven by the expansion of e-commerce, increasing demand for efficient logistics solutions, and the rise of outsourcing in supply chain management. The market is expected to witness a Compound Annual Growth Rate (CAGR) of xx% during the forecast period (2025-2033), reaching a market value of $xx Million by 2033. Market penetration is increasing steadily, particularly in sectors such as manufacturing and e-commerce. Technological disruptions, such as the adoption of blockchain technology and the Internet of Things (IoT), are reshaping the competitive landscape, pushing companies to integrate advanced technologies to gain an edge. Consumer preference for faster and more transparent delivery solutions is also influencing market dynamics.
Dominant Regions & Segments in US FTL Broker Industry
The Manufacturing and Automotive sector represents the largest segment within the US FTL Broker market, accounting for approximately xx% of the total revenue in 2025. This dominance is fueled by high shipment volumes and the need for reliable transportation of finished goods and raw materials.
- Key Drivers for Manufacturing and Automotive Dominance:
- Robust manufacturing output and automotive production.
- Extensive supply chains and distribution networks.
- Demand for timely and cost-effective transportation solutions.
Other significant segments include Oil and Gas, Mining, and Quarrying, and Distributive Trade, each contributing significantly to the overall market size. The geographic distribution of the market is fairly widespread across the US, with significant concentrations in regions with high industrial activity and strong transportation infrastructure.
US FTL Broker Industry Product Innovations
The FTL brokerage sector is experiencing a wave of innovation focused on enhancing efficiency, transparency, and visibility throughout the supply chain. This manifests in several key areas:
- Advanced Digital Platforms: Sophisticated software platforms provide real-time tracking, automated shipment management, dynamic routing optimization, and improved communication between brokers, carriers, and shippers.
- Integrated Logistics Solutions: The trend is towards offering bundled services, combining FTL brokerage with warehousing, last-mile delivery, and other value-added services to provide comprehensive supply chain management solutions.
- Data Analytics and Predictive Modeling: Leveraging big data and AI, brokers can predict potential disruptions, optimize routes, and improve overall supply chain performance.
Report Scope & Segmentation Analysis
This report segments the US FTL Broker market by end-user industry: Manufacturing and Automotive, Oil and Gas, Mining, and Quarrying, Agriculture Fishing, and Forestry, Construction, Distributive Trade, and Other End Users. Each segment's analysis includes market size, growth projections, and competitive dynamics. The Manufacturing and Automotive segment is projected to maintain its leading position, while the Oil and Gas and Distributive Trade segments are expected to exhibit considerable growth during the forecast period. The growth projections for each segment are based on industry trends, economic forecasts, and expert assessments.
Key Drivers of US FTL Broker Industry Growth
The expansion of the US FTL brokerage industry is fueled by a confluence of factors:
- E-commerce Growth: The continued surge in online retail drives a relentless demand for efficient and reliable delivery services, boosting demand for FTL brokerage services.
- Technological Adoption: The increasing adoption of AI, machine learning, and advanced analytics is optimizing logistics operations, enabling more efficient routing, improved capacity utilization, and better cost management.
- Outsourcing Trend: Businesses across various sectors are increasingly outsourcing their logistics operations to focus on core competencies, creating demand for FTL brokerage services.
- Favorable Economic Conditions: A healthy economy supports robust freight volumes and increased business activity, fueling industry growth.
- Infrastructure Investments: Government investments in infrastructure development and modernization contribute to a more efficient transportation network.
Challenges in the US FTL Broker Industry Sector
The US FTL Broker industry faces challenges such as fluctuating fuel prices impacting transportation costs, driver shortages causing capacity constraints and delays, and intense competition among brokers leading to price pressure. Stringent regulatory compliance requirements and the need to invest in technology to remain competitive add to the operational complexity. These factors can collectively impact profitability and operational efficiency.
Emerging Opportunities in US FTL Broker Industry
Several compelling opportunities are emerging within the US FTL brokerage industry:
- Sustainable Transportation: Growing demand for environmentally friendly transportation solutions creates opportunities for brokers to specialize in carbon-neutral or low-emission shipping options.
- Niche Market Expansion: Focusing on specific industries or geographic regions with unique logistics needs can create competitive advantages.
- Blockchain Technology: Implementing blockchain technology can enhance supply chain security and transparency, improving traceability and reducing fraud.
- End-to-End Supply Chain Solutions: Expanding service offerings to encompass the entire supply chain, from origin to final delivery, strengthens customer relationships and increases market share.
- Global Expansion: International trade growth opens doors for FTL brokers to expand their services across borders.
Leading Players in the US FTL Broker Industry Market
- Suntecktts
- Coyote Logistics (Coyote Logistics)
- Total Quality Logistics (Total Quality Logistics)
- Transplace (Transplace)
- Hub Group (Hub Group)
- Landstar System Inc (Landstar System Inc)
- CH Robinson (CH Robinson)
- BNSF Logistics LLC (BNSF Logistics LLC)
- XPO Logistics Inc (XPO Logistics Inc)
- Worldwide Express (Worldwide Express)
- Schneider (Schneider)
- Echo Global Logistics (Echo Global Logistics)
- J B Hunt Transport Inc (J B Hunt Transport Inc)
- Kag Logistics Inc
- Globaltranz
Key Developments in US FTL Broker Industry
- September 2023: Rhenus acquires ITS Logistics Hungary KFT, expanding its air freight services and Hungarian market reach, demonstrating a trend towards geographic expansion and diversification of service offerings.
- September 2023: Rhenus Group acquires BLU Logistics, significantly bolstering its presence in LATAM and enhancing its Asia-LATAM trade lane capabilities. This highlights the strategic importance of expanding into high-growth regions and enhancing cross-continental connectivity.
Future Outlook for US FTL Broker Industry Market
The US FTL Broker market is poised for continued growth, driven by technological advancements, increasing e-commerce penetration, and the ongoing need for efficient and reliable logistics solutions. Strategic partnerships, acquisitions, and investments in innovative technologies will be key factors shaping the competitive landscape and fostering further market expansion. The focus on sustainability and improved supply chain resilience will also drive innovation and market growth in the coming years.
US FTL Broker Industry Segmentation
-
1. End User
- 1.1. Manufacturing and Automotive
- 1.2. Oil and Gas, Mining, and Quarrying
- 1.3. Agriculture Fishing, and Forestry
- 1.4. Construction
- 1.5. Distributive Trade
- 1.6. Other End Users
US FTL Broker Industry Segmentation By Geography
-
1. North America
- 1.1. United States
- 1.2. Canada
- 1.3. Mexico
-
2. South America
- 2.1. Brazil
- 2.2. Argentina
- 2.3. Rest of South America
-
3. Europe
- 3.1. United Kingdom
- 3.2. Germany
- 3.3. France
- 3.4. Italy
- 3.5. Spain
- 3.6. Russia
- 3.7. Benelux
- 3.8. Nordics
- 3.9. Rest of Europe
-
4. Middle East & Africa
- 4.1. Turkey
- 4.2. Israel
- 4.3. GCC
- 4.4. North Africa
- 4.5. South Africa
- 4.6. Rest of Middle East & Africa
-
5. Asia Pacific
- 5.1. China
- 5.2. India
- 5.3. Japan
- 5.4. South Korea
- 5.5. ASEAN
- 5.6. Oceania
- 5.7. Rest of Asia Pacific
US FTL Broker Industry Regional Market Share
Geographic Coverage of US FTL Broker Industry
US FTL Broker Industry REPORT HIGHLIGHTS
| Aspects | Details |
|---|---|
| Study Period | 2020-2034 |
| Base Year | 2025 |
| Estimated Year | 2026 |
| Forecast Period | 2026-2034 |
| Historical Period | 2020-2025 |
| Growth Rate | CAGR of 7.86% from 2020-2034 |
| Segmentation |
|
Table of Contents
- 1. Introduction
- 1.1. Research Scope
- 1.2. Market Segmentation
- 1.3. Research Objective
- 1.4. Definitions and Assumptions
- 2. Executive Summary
- 2.1. Market Snapshot
- 3. Market Dynamics
- 3.1. Market Drivers
- 3.2. Market Restrains
- 3.3. Market Trends
- 3.4. Market Opportunities
- 4. Market Factor Analysis
- 4.1. Porters Five Forces
- 4.1.1. Bargaining Power of Suppliers
- 4.1.2. Bargaining Power of Buyers
- 4.1.3. Threat of New Entrants
- 4.1.4. Threat of Substitutes
- 4.1.5. Competitive Rivalry
- 4.2. PESTEL analysis
- 4.3. BCG Analysis
- 4.3.1. Stars (High Growth, High Market Share)
- 4.3.2. Cash Cows (Low Growth, High Market Share)
- 4.3.3. Question Mark (High Growth, Low Market Share)
- 4.3.4. Dogs (Low Growth, Low Market Share)
- 4.4. Ansoff Matrix Analysis
- 4.5. Supply Chain Analysis
- 4.6. Regulatory Landscape
- 4.7. Current Market Potential and Opportunity Assessment (TAM–SAM–SOM Framework)
- 4.8. PRI Analyst Note
- 4.1. Porters Five Forces
- 5. Market Analysis, Insights and Forecast 2021-2033
- 5.1. Market Analysis, Insights and Forecast - by End User
- 5.1.1. Manufacturing and Automotive
- 5.1.2. Oil and Gas, Mining, and Quarrying
- 5.1.3. Agriculture Fishing, and Forestry
- 5.1.4. Construction
- 5.1.5. Distributive Trade
- 5.1.6. Other End Users
- 5.2. Market Analysis, Insights and Forecast - by Region
- 5.2.1. North America
- 5.2.2. South America
- 5.2.3. Europe
- 5.2.4. Middle East & Africa
- 5.2.5. Asia Pacific
- 5.1. Market Analysis, Insights and Forecast - by End User
- 6. Global US FTL Broker Industry Analysis, Insights and Forecast, 2021-2033
- 6.1. Market Analysis, Insights and Forecast - by End User
- 6.1.1. Manufacturing and Automotive
- 6.1.2. Oil and Gas, Mining, and Quarrying
- 6.1.3. Agriculture Fishing, and Forestry
- 6.1.4. Construction
- 6.1.5. Distributive Trade
- 6.1.6. Other End Users
- 6.1. Market Analysis, Insights and Forecast - by End User
- 7. North America US FTL Broker Industry Analysis, Insights and Forecast, 2020-2032
- 7.1. Market Analysis, Insights and Forecast - by End User
- 7.1.1. Manufacturing and Automotive
- 7.1.2. Oil and Gas, Mining, and Quarrying
- 7.1.3. Agriculture Fishing, and Forestry
- 7.1.4. Construction
- 7.1.5. Distributive Trade
- 7.1.6. Other End Users
- 7.1. Market Analysis, Insights and Forecast - by End User
- 8. South America US FTL Broker Industry Analysis, Insights and Forecast, 2020-2032
- 8.1. Market Analysis, Insights and Forecast - by End User
- 8.1.1. Manufacturing and Automotive
- 8.1.2. Oil and Gas, Mining, and Quarrying
- 8.1.3. Agriculture Fishing, and Forestry
- 8.1.4. Construction
- 8.1.5. Distributive Trade
- 8.1.6. Other End Users
- 8.1. Market Analysis, Insights and Forecast - by End User
- 9. Europe US FTL Broker Industry Analysis, Insights and Forecast, 2020-2032
- 9.1. Market Analysis, Insights and Forecast - by End User
- 9.1.1. Manufacturing and Automotive
- 9.1.2. Oil and Gas, Mining, and Quarrying
- 9.1.3. Agriculture Fishing, and Forestry
- 9.1.4. Construction
- 9.1.5. Distributive Trade
- 9.1.6. Other End Users
- 9.1. Market Analysis, Insights and Forecast - by End User
- 10. Middle East & Africa US FTL Broker Industry Analysis, Insights and Forecast, 2020-2032
- 10.1. Market Analysis, Insights and Forecast - by End User
- 10.1.1. Manufacturing and Automotive
- 10.1.2. Oil and Gas, Mining, and Quarrying
- 10.1.3. Agriculture Fishing, and Forestry
- 10.1.4. Construction
- 10.1.5. Distributive Trade
- 10.1.6. Other End Users
- 10.1. Market Analysis, Insights and Forecast - by End User
- 11. Asia Pacific US FTL Broker Industry Analysis, Insights and Forecast, 2020-2032
- 11.1. Market Analysis, Insights and Forecast - by End User
- 11.1.1. Manufacturing and Automotive
- 11.1.2. Oil and Gas, Mining, and Quarrying
- 11.1.3. Agriculture Fishing, and Forestry
- 11.1.4. Construction
- 11.1.5. Distributive Trade
- 11.1.6. Other End Users
- 11.1. Market Analysis, Insights and Forecast - by End User
- 12. Competitive Analysis
- 12.1. Company Profiles
- 12.1.1 Suntecktts
- 12.1.1.1. Company Overview
- 12.1.1.2. Products
- 12.1.1.3. Company Financials
- 12.1.1.4. SWOT Analysis
- 12.1.2 Coyote Logistics
- 12.1.2.1. Company Overview
- 12.1.2.2. Products
- 12.1.2.3. Company Financials
- 12.1.2.4. SWOT Analysis
- 12.1.3 Total Quality Logistics
- 12.1.3.1. Company Overview
- 12.1.3.2. Products
- 12.1.3.3. Company Financials
- 12.1.3.4. SWOT Analysis
- 12.1.4 Transplace**List Not Exhaustive
- 12.1.4.1. Company Overview
- 12.1.4.2. Products
- 12.1.4.3. Company Financials
- 12.1.4.4. SWOT Analysis
- 12.1.5 Hub Group
- 12.1.5.1. Company Overview
- 12.1.5.2. Products
- 12.1.5.3. Company Financials
- 12.1.5.4. SWOT Analysis
- 12.1.6 Landstar System Inc
- 12.1.6.1. Company Overview
- 12.1.6.2. Products
- 12.1.6.3. Company Financials
- 12.1.6.4. SWOT Analysis
- 12.1.7 CH Robinson
- 12.1.7.1. Company Overview
- 12.1.7.2. Products
- 12.1.7.3. Company Financials
- 12.1.7.4. SWOT Analysis
- 12.1.8 BNSF Logistics LLC
- 12.1.8.1. Company Overview
- 12.1.8.2. Products
- 12.1.8.3. Company Financials
- 12.1.8.4. SWOT Analysis
- 12.1.9 XPO Logistics Inc
- 12.1.9.1. Company Overview
- 12.1.9.2. Products
- 12.1.9.3. Company Financials
- 12.1.9.4. SWOT Analysis
- 12.1.10 Worldwide Express
- 12.1.10.1. Company Overview
- 12.1.10.2. Products
- 12.1.10.3. Company Financials
- 12.1.10.4. SWOT Analysis
- 12.1.11 Schneider
- 12.1.11.1. Company Overview
- 12.1.11.2. Products
- 12.1.11.3. Company Financials
- 12.1.11.4. SWOT Analysis
- 12.1.12 Echo Global Logistics
- 12.1.12.1. Company Overview
- 12.1.12.2. Products
- 12.1.12.3. Company Financials
- 12.1.12.4. SWOT Analysis
- 12.1.13 J B Hunt Transport Inc
- 12.1.13.1. Company Overview
- 12.1.13.2. Products
- 12.1.13.3. Company Financials
- 12.1.13.4. SWOT Analysis
- 12.1.14 Kag Logistics Inc
- 12.1.14.1. Company Overview
- 12.1.14.2. Products
- 12.1.14.3. Company Financials
- 12.1.14.4. SWOT Analysis
- 12.1.15 Globaltranz
- 12.1.15.1. Company Overview
- 12.1.15.2. Products
- 12.1.15.3. Company Financials
- 12.1.15.4. SWOT Analysis
- 12.1.1 Suntecktts
- 12.2. Market Entropy
- 12.2.1 Company's Key Areas Served
- 12.2.2 Recent Developments
- 12.3. Company Market Share Analysis 2025
- 12.3.1 Top 5 Companies Market Share Analysis
- 12.3.2 Top 3 Companies Market Share Analysis
- 12.4. List of Potential Customers
- 13. Research Methodology
List of Figures
- Figure 1: Global US FTL Broker Industry Revenue Breakdown (Million, %) by Region 2025 & 2033
- Figure 2: North America US FTL Broker Industry Revenue (Million), by End User 2025 & 2033
- Figure 3: North America US FTL Broker Industry Revenue Share (%), by End User 2025 & 2033
- Figure 4: North America US FTL Broker Industry Revenue (Million), by Country 2025 & 2033
- Figure 5: North America US FTL Broker Industry Revenue Share (%), by Country 2025 & 2033
- Figure 6: South America US FTL Broker Industry Revenue (Million), by End User 2025 & 2033
- Figure 7: South America US FTL Broker Industry Revenue Share (%), by End User 2025 & 2033
- Figure 8: South America US FTL Broker Industry Revenue (Million), by Country 2025 & 2033
- Figure 9: South America US FTL Broker Industry Revenue Share (%), by Country 2025 & 2033
- Figure 10: Europe US FTL Broker Industry Revenue (Million), by End User 2025 & 2033
- Figure 11: Europe US FTL Broker Industry Revenue Share (%), by End User 2025 & 2033
- Figure 12: Europe US FTL Broker Industry Revenue (Million), by Country 2025 & 2033
- Figure 13: Europe US FTL Broker Industry Revenue Share (%), by Country 2025 & 2033
- Figure 14: Middle East & Africa US FTL Broker Industry Revenue (Million), by End User 2025 & 2033
- Figure 15: Middle East & Africa US FTL Broker Industry Revenue Share (%), by End User 2025 & 2033
- Figure 16: Middle East & Africa US FTL Broker Industry Revenue (Million), by Country 2025 & 2033
- Figure 17: Middle East & Africa US FTL Broker Industry Revenue Share (%), by Country 2025 & 2033
- Figure 18: Asia Pacific US FTL Broker Industry Revenue (Million), by End User 2025 & 2033
- Figure 19: Asia Pacific US FTL Broker Industry Revenue Share (%), by End User 2025 & 2033
- Figure 20: Asia Pacific US FTL Broker Industry Revenue (Million), by Country 2025 & 2033
- Figure 21: Asia Pacific US FTL Broker Industry Revenue Share (%), by Country 2025 & 2033
List of Tables
- Table 1: Global US FTL Broker Industry Revenue Million Forecast, by End User 2020 & 2033
- Table 2: Global US FTL Broker Industry Revenue Million Forecast, by Region 2020 & 2033
- Table 3: Global US FTL Broker Industry Revenue Million Forecast, by End User 2020 & 2033
- Table 4: Global US FTL Broker Industry Revenue Million Forecast, by Country 2020 & 2033
- Table 5: United States US FTL Broker Industry Revenue (Million) Forecast, by Application 2020 & 2033
- Table 6: Canada US FTL Broker Industry Revenue (Million) Forecast, by Application 2020 & 2033
- Table 7: Mexico US FTL Broker Industry Revenue (Million) Forecast, by Application 2020 & 2033
- Table 8: Global US FTL Broker Industry Revenue Million Forecast, by End User 2020 & 2033
- Table 9: Global US FTL Broker Industry Revenue Million Forecast, by Country 2020 & 2033
- Table 10: Brazil US FTL Broker Industry Revenue (Million) Forecast, by Application 2020 & 2033
- Table 11: Argentina US FTL Broker Industry Revenue (Million) Forecast, by Application 2020 & 2033
- Table 12: Rest of South America US FTL Broker Industry Revenue (Million) Forecast, by Application 2020 & 2033
- Table 13: Global US FTL Broker Industry Revenue Million Forecast, by End User 2020 & 2033
- Table 14: Global US FTL Broker Industry Revenue Million Forecast, by Country 2020 & 2033
- Table 15: United Kingdom US FTL Broker Industry Revenue (Million) Forecast, by Application 2020 & 2033
- Table 16: Germany US FTL Broker Industry Revenue (Million) Forecast, by Application 2020 & 2033
- Table 17: France US FTL Broker Industry Revenue (Million) Forecast, by Application 2020 & 2033
- Table 18: Italy US FTL Broker Industry Revenue (Million) Forecast, by Application 2020 & 2033
- Table 19: Spain US FTL Broker Industry Revenue (Million) Forecast, by Application 2020 & 2033
- Table 20: Russia US FTL Broker Industry Revenue (Million) Forecast, by Application 2020 & 2033
- Table 21: Benelux US FTL Broker Industry Revenue (Million) Forecast, by Application 2020 & 2033
- Table 22: Nordics US FTL Broker Industry Revenue (Million) Forecast, by Application 2020 & 2033
- Table 23: Rest of Europe US FTL Broker Industry Revenue (Million) Forecast, by Application 2020 & 2033
- Table 24: Global US FTL Broker Industry Revenue Million Forecast, by End User 2020 & 2033
- Table 25: Global US FTL Broker Industry Revenue Million Forecast, by Country 2020 & 2033
- Table 26: Turkey US FTL Broker Industry Revenue (Million) Forecast, by Application 2020 & 2033
- Table 27: Israel US FTL Broker Industry Revenue (Million) Forecast, by Application 2020 & 2033
- Table 28: GCC US FTL Broker Industry Revenue (Million) Forecast, by Application 2020 & 2033
- Table 29: North Africa US FTL Broker Industry Revenue (Million) Forecast, by Application 2020 & 2033
- Table 30: South Africa US FTL Broker Industry Revenue (Million) Forecast, by Application 2020 & 2033
- Table 31: Rest of Middle East & Africa US FTL Broker Industry Revenue (Million) Forecast, by Application 2020 & 2033
- Table 32: Global US FTL Broker Industry Revenue Million Forecast, by End User 2020 & 2033
- Table 33: Global US FTL Broker Industry Revenue Million Forecast, by Country 2020 & 2033
- Table 34: China US FTL Broker Industry Revenue (Million) Forecast, by Application 2020 & 2033
- Table 35: India US FTL Broker Industry Revenue (Million) Forecast, by Application 2020 & 2033
- Table 36: Japan US FTL Broker Industry Revenue (Million) Forecast, by Application 2020 & 2033
- Table 37: South Korea US FTL Broker Industry Revenue (Million) Forecast, by Application 2020 & 2033
- Table 38: ASEAN US FTL Broker Industry Revenue (Million) Forecast, by Application 2020 & 2033
- Table 39: Oceania US FTL Broker Industry Revenue (Million) Forecast, by Application 2020 & 2033
- Table 40: Rest of Asia Pacific US FTL Broker Industry Revenue (Million) Forecast, by Application 2020 & 2033
Frequently Asked Questions
1. What is the projected Compound Annual Growth Rate (CAGR) of the US FTL Broker Industry?
The projected CAGR is approximately 7.86%.
2. Which companies are prominent players in the US FTL Broker Industry?
Key companies in the market include Suntecktts, Coyote Logistics, Total Quality Logistics, Transplace**List Not Exhaustive, Hub Group, Landstar System Inc, CH Robinson, BNSF Logistics LLC, XPO Logistics Inc, Worldwide Express, Schneider, Echo Global Logistics, J B Hunt Transport Inc, Kag Logistics Inc, Globaltranz.
3. What are the main segments of the US FTL Broker Industry?
The market segments include End User.
4. Can you provide details about the market size?
The market size is estimated to be USD 15.68 Million as of 2022.
5. What are some drivers contributing to market growth?
4.; Increasing demand for efficient transportation4.; Growing eCommerce industry.
6. What are the notable trends driving market growth?
Fluctuating Fuel prices Hampering the Growth of the Market.
7. Are there any restraints impacting market growth?
4.; Intense competition affecting the market4.; Fluctuating fuel prices.
8. Can you provide examples of recent developments in the market?
Sept 2023: Rhenus continues its growth trajectory with the strategic acquisition of the Hungarian freight forwarder ITS Logistics Hungary KFT. This move will enable them to better serve their customer's needs, particularly in relation to air freight services, while also expanding their reach in the Hungarian market.
9. What pricing options are available for accessing the report?
Pricing options include single-user, multi-user, and enterprise licenses priced at USD 3800, USD 4500, and USD 5800 respectively.
10. Is the market size provided in terms of value or volume?
The market size is provided in terms of value, measured in Million.
11. Are there any specific market keywords associated with the report?
Yes, the market keyword associated with the report is "US FTL Broker Industry," which aids in identifying and referencing the specific market segment covered.
12. How do I determine which pricing option suits my needs best?
The pricing options vary based on user requirements and access needs. Individual users may opt for single-user licenses, while businesses requiring broader access may choose multi-user or enterprise licenses for cost-effective access to the report.
13. Are there any additional resources or data provided in the US FTL Broker Industry report?
While the report offers comprehensive insights, it's advisable to review the specific contents or supplementary materials provided to ascertain if additional resources or data are available.
14. How can I stay updated on further developments or reports in the US FTL Broker Industry?
To stay informed about further developments, trends, and reports in the US FTL Broker Industry, consider subscribing to industry newsletters, following relevant companies and organizations, or regularly checking reputable industry news sources and publications.
Methodology
Step 1 - Identification of Relevant Samples Size from Population Database


Step 2 - Approaches for Defining Global Market Size (Value, Volume* & Price*)

Note*: In applicable scenarios
Step 3 - Data Sources
Primary Research
- Web Analytics
- Survey Reports
- Research Institute
- Latest Research Reports
- Opinion Leaders
Secondary Research
- Annual Reports
- White Paper
- Latest Press Release
- Industry Association
- Paid Database
- Investor Presentations

Step 4 - Data Triangulation
Involves using different sources of information in order to increase the validity of a study
These sources are likely to be stakeholders in a program - participants, other researchers, program staff, other community members, and so on.
Then we put all data in single framework & apply various statistical tools to find out the dynamic on the market.
During the analysis stage, feedback from the stakeholder groups would be compared to determine areas of agreement as well as areas of divergence