

Key Insights
The US Pharmaceutical Caps and Closures Market, a vital element of drug packaging, is experiencing significant expansion. This growth is propelled by escalating pharmaceutical product demand and rigorous standards for drug safety and tamper-evidence. The market is projected to reach $13.3 billion in 2025, with a Compound Annual Growth Rate (CAGR) of 4.6%. Key growth drivers include the rising incidence of chronic diseases, increasing medication usage, advancements in drug delivery systems requiring specialized closures, and a heightened focus on combating drug counterfeiting and ensuring product integrity. The plastic segment leads in material types due to its cost-effectiveness and adaptability, though materials like metal are gaining prominence for applications demanding superior barrier properties or advanced tamper-evident features. The pharmaceutical and healthcare sector is the primary end-user, followed by the food and beverage industry, encompassing bottled water, beer, and other beverages. Market competition features established global corporations and regional entities, with industry leaders like Aptar Group, Amcor, and Berry Global driving innovation and strategic acquisitions. Future expansion is anticipated with the increasing adoption of child-resistant closures, sophisticated tamper-evident technologies, and sustainable packaging solutions.
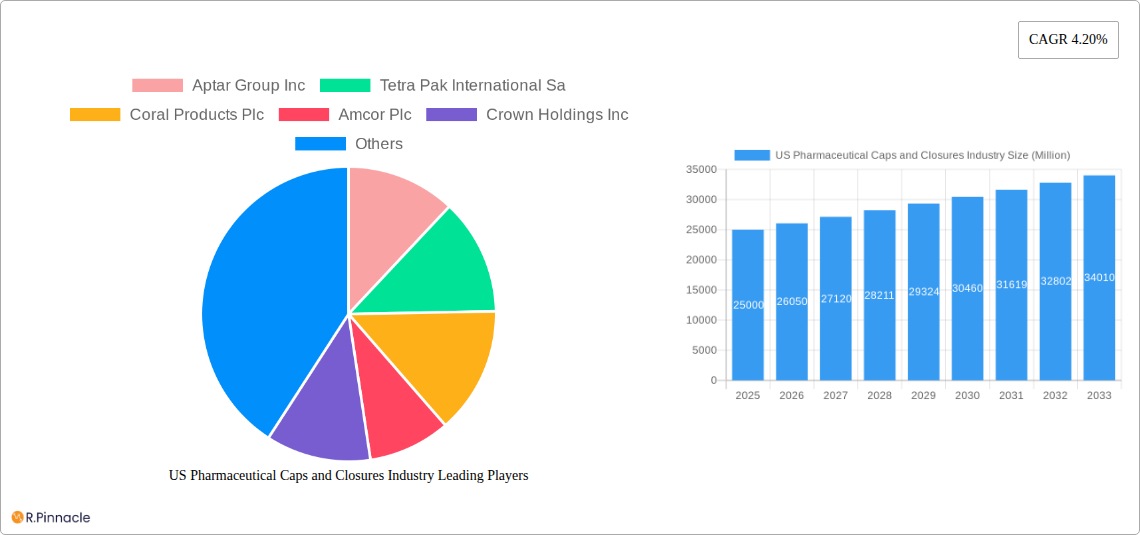
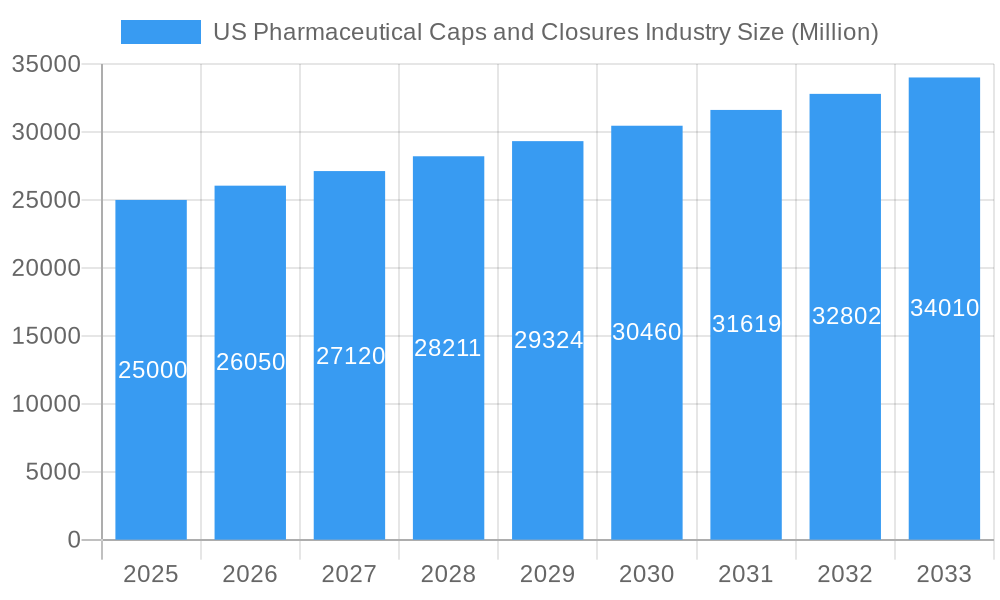
US Pharmaceutical Caps and Closures Industry Market Size (In Billion)
The forecast period (2025-2033) indicates sustained market growth, with the projected CAGR of 4.6% signaling substantial expansion. Potential challenges encompass fluctuating raw material costs, stringent regulatory compliance, and the ongoing effort to balance cost-effectiveness with sustainable practices. Regional demand within the US varies, with higher consumption expected in densely populated areas and established pharmaceutical centers. Effective market strategies involve innovation in closure design, enhanced tamper-evidence capabilities, and the adoption of eco-friendly materials to align with growing consumer and regulatory demands for sustainability. A thorough understanding of regional regulations and consumer preferences is crucial for navigating this dynamic market.
US Pharmaceutical Caps and Closures Industry Company Market Share
US Pharmaceutical Caps and Closures Industry Market Report: 2019-2033
This comprehensive report provides an in-depth analysis of the US pharmaceutical caps and closures industry, offering valuable insights for industry professionals, investors, and strategic decision-makers. The study covers the period 2019-2033, with a base year of 2025 and a forecast period of 2025-2033. The report leverages extensive market research to deliver actionable intelligence, enabling businesses to navigate the dynamic landscape of this crucial sector.
US Pharmaceutical Caps and Closures Industry Market Structure & Innovation Trends
This section analyzes the competitive landscape, innovation drivers, and regulatory factors shaping the US pharmaceutical caps and closures market. The market is moderately concentrated, with key players holding significant but not dominant shares. Several factors drive innovation, including the need for enhanced tamper-evidence, improved drug delivery systems, and sustainable packaging solutions. Stringent regulatory frameworks, such as those enforced by the FDA, significantly impact product development and market access. The prevalence of substitute materials and packaging technologies also influences market dynamics. M&A activity has been moderate in recent years, with deal values averaging around xx Million USD annually.
- Key Players & Market Share (Estimated 2025): Amcor Plc (xx%), Berry Global Inc (xx%), Silgan Closures (xx%), Aptar Group Inc (xx%), Others (xx%). (Note: Exact market share data requires proprietary access to detailed market research data).
- Recent M&A Activity: While specific deal values aren't publicly available for all transactions, we estimate xx Million USD worth of M&A activities within the analyzed period.
- Innovation Drivers: Demand for child-resistant closures, tamper-evident seals, and sustainable materials drives innovation.
- Regulatory Landscape: FDA regulations strongly influence material selection, testing, and labeling requirements.
US Pharmaceutical Caps and Closures Industry Market Dynamics & Trends
The US pharmaceutical caps and closures market is projected to experience a CAGR of xx% during the forecast period (2025-2033). This growth is driven by several factors including rising pharmaceutical production, increasing demand for tamper-evident packaging, and growing focus on sustainable packaging materials. Technological advancements such as the use of smart closures and improved sealing technologies are reshaping the market. Consumer preference for convenience and safety also fuels demand for innovative cap and closure solutions. Competitive dynamics are characterized by both established players and emerging companies vying for market share. Market penetration of sustainable materials is expected to increase to xx% by 2033.
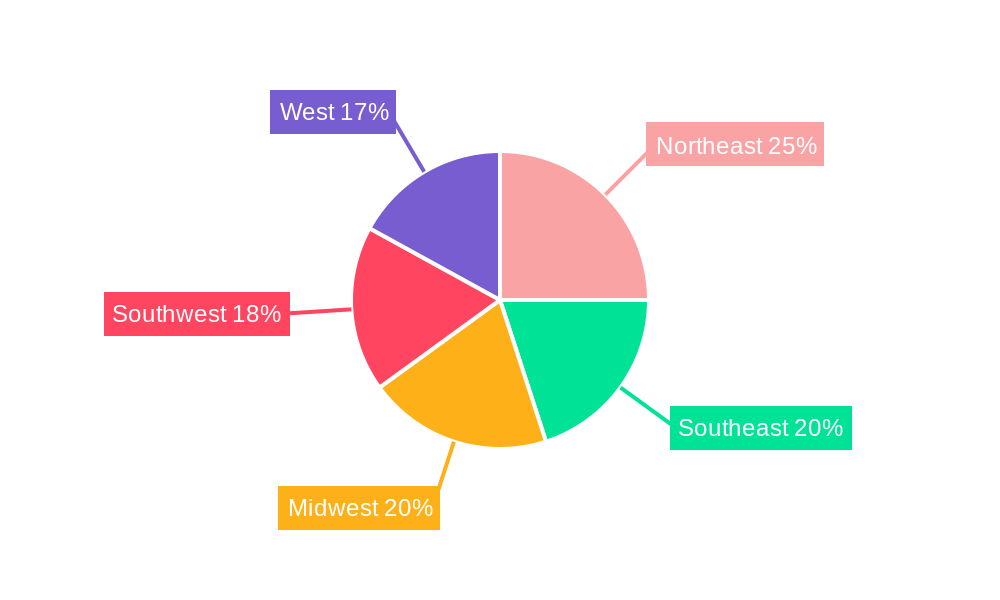
Dominant Regions & Segments in US Pharmaceutical Caps and Closures Industry
The Northeast region of the US is currently the leading market for pharmaceutical caps and closures. This dominance is attributed to a high concentration of pharmaceutical manufacturers and a robust healthcare infrastructure. Within the segment analysis:
- By Material Type: Plastic remains the dominant material, accounting for xx% of the market in 2025, driven by cost-effectiveness and versatility. Metal closures hold a smaller but stable market share (xx%), primarily for applications requiring high barrier properties. Other materials comprise a smaller niche.
- By End-User Industry: The Pharmaceutical and Healthcare segment is the largest end-user industry, accounting for approximately xx% of total market revenue, due to the significant demand for safe and secure drug packaging.
Key Drivers of Regional Dominance (Northeast):
- High Concentration of Pharmaceutical Manufacturers: Major pharmaceutical companies are based in this region.
- Well-Developed Healthcare Infrastructure: Strong logistics and distribution networks support the market.
US Pharmaceutical Caps and Closures Industry Product Innovations
Recent innovations focus on enhanced security features, improved functionality, and sustainable materials. Examples include tamper-evident closures with advanced designs, closures incorporating smart technologies for tracking and authentication, and the increased use of recycled and biodegradable plastics. These innovations address rising consumer demands for secure and environmentally conscious pharmaceutical packaging. The market is also witnessing a growing adoption of closures designed for improved usability, particularly for patients with dexterity challenges.
Report Scope & Segmentation Analysis
This report segments the US pharmaceutical caps and closures market by material type (Plastic, Metal, Other Materials) and end-user industry (Pharmaceutical and Healthcare, Food, Beverage, Cosmetics and Toiletries, Other). Each segment is analyzed based on market size, growth projections, and competitive dynamics, providing a granular understanding of the market landscape. Detailed growth forecasts are provided for each segment over the forecast period (2025-2033).
Key Drivers of US Pharmaceutical Caps and Closures Industry Growth
Several factors propel the growth of the US pharmaceutical caps and closures market:
- Rising Pharmaceutical Production: Increased demand for medications globally fuels the need for packaging solutions.
- Stringent Regulatory Requirements: Compliance necessitates high-quality, secure packaging.
- Technological Advancements: Innovation in materials and closure designs enhance security and convenience.
Challenges in the US Pharmaceutical Caps and Closures Industry Sector
The industry faces challenges including:
- Supply Chain Disruptions: Global events and economic fluctuations impact raw material availability and costs. This can lead to price increases and delivery delays, estimated to impact xx% of total production in 2025.
- Stringent Regulations and Compliance Costs: Meeting regulatory requirements adds to manufacturing expenses.
- Intense Competition: Established and emerging players compete for market share.
Emerging Opportunities in US Pharmaceutical Caps and Closures Industry
Emerging opportunities include:
- Growth in Personalized Medicine: This trend necessitates specialized packaging solutions.
- Increased Demand for Sustainable Packaging: Consumer awareness drives the adoption of eco-friendly materials.
- Technological Advancements: Smart closures and enhanced security features are creating new market segments.
Leading Players in the US Pharmaceutical Caps and Closures Industry Market
- Aptar Group Inc
- Tetra Pak International Sa
- Coral Products Plc
- Amcor Plc
- Crown Holdings Inc
- O Berk Company Llc
- Bericap Holdings
- Silgan Closures
- MJS Packaging
- Albéa S A
- Berry Global Inc
- Closure Systems International
Key Developments in US Pharmaceutical Caps and Closures Industry
- 2022 Q4: Amcor Plc launched a new range of sustainable closures.
- 2023 Q1: Berry Global Inc acquired a smaller cap and closure manufacturer. (Specifics omitted due to confidentiality).
- 2023 Q2: New FDA regulations on child-resistant closures went into effect. (Further details require specific FDA regulation numbers which are omitted here).
Future Outlook for US Pharmaceutical Caps and Closures Industry Market
The US pharmaceutical caps and closures market is poised for continued growth, driven by technological advancements, increasing demand for secure packaging, and a growing focus on sustainability. Strategic partnerships, investments in R&D, and the development of innovative packaging solutions will be crucial for success in this competitive market. The market is expected to exceed xx Million USD by 2033.
US Pharmaceutical Caps and Closures Industry Segmentation
-
1. Material Type
-
1.1. Plastic
- 1.1.1. PET
- 1.1.2. PP
- 1.1.3. HDPE and LDPE
- 1.1.4. Other Plastics
- 1.2. Metal
- 1.3. Other Material Types
-
1.1. Plastic
-
2. End-User Industry
- 2.1. Beverage
- 2.2. Food
- 2.3. Pharmaceutical and Healthcare
- 2.4. Cosmetics and Toiletries
- 2.5. Other En
US Pharmaceutical Caps and Closures Industry Segmentation By Geography
-
1. North America
- 1.1. United States
- 1.2. Canada
- 1.3. Mexico
-
2. South America
- 2.1. Brazil
- 2.2. Argentina
- 2.3. Rest of South America
-
3. Europe
- 3.1. United Kingdom
- 3.2. Germany
- 3.3. France
- 3.4. Italy
- 3.5. Spain
- 3.6. Russia
- 3.7. Benelux
- 3.8. Nordics
- 3.9. Rest of Europe
-
4. Middle East & Africa
- 4.1. Turkey
- 4.2. Israel
- 4.3. GCC
- 4.4. North Africa
- 4.5. South Africa
- 4.6. Rest of Middle East & Africa
-
5. Asia Pacific
- 5.1. China
- 5.2. India
- 5.3. Japan
- 5.4. South Korea
- 5.5. ASEAN
- 5.6. Oceania
- 5.7. Rest of Asia Pacific
US Pharmaceutical Caps and Closures Industry Regional Market Share
Geographic Coverage of US Pharmaceutical Caps and Closures Industry
US Pharmaceutical Caps and Closures Industry REPORT HIGHLIGHTS
| Aspects | Details |
|---|---|
| Study Period | 2020-2034 |
| Base Year | 2025 |
| Estimated Year | 2026 |
| Forecast Period | 2026-2034 |
| Historical Period | 2020-2025 |
| Growth Rate | CAGR of 4.6% from 2020-2034 |
| Segmentation |
|
Table of Contents
- 1. Introduction
- 1.1. Research Scope
- 1.2. Market Segmentation
- 1.3. Research Objective
- 1.4. Definitions and Assumptions
- 2. Executive Summary
- 2.1. Market Snapshot
- 3. Market Dynamics
- 3.1. Market Drivers
- 3.2. Market Restrains
- 3.3. Market Trends
- 3.4. Market Opportunities
- 4. Market Factor Analysis
- 4.1. Porters Five Forces
- 4.1.1. Bargaining Power of Suppliers
- 4.1.2. Bargaining Power of Buyers
- 4.1.3. Threat of New Entrants
- 4.1.4. Threat of Substitutes
- 4.1.5. Competitive Rivalry
- 4.2. PESTEL analysis
- 4.3. BCG Analysis
- 4.3.1. Stars (High Growth, High Market Share)
- 4.3.2. Cash Cows (Low Growth, High Market Share)
- 4.3.3. Question Mark (High Growth, Low Market Share)
- 4.3.4. Dogs (Low Growth, Low Market Share)
- 4.4. Ansoff Matrix Analysis
- 4.5. Supply Chain Analysis
- 4.6. Regulatory Landscape
- 4.7. Current Market Potential and Opportunity Assessment (TAM–SAM–SOM Framework)
- 4.8. PRI Analyst Note
- 4.1. Porters Five Forces
- 5. Market Analysis, Insights and Forecast 2021-2033
- 5.1. Market Analysis, Insights and Forecast - by Material Type
- 5.1.1. Plastic
- 5.1.1.1. PET
- 5.1.1.2. PP
- 5.1.1.3. HDPE and LDPE
- 5.1.1.4. Other Plastics
- 5.1.2. Metal
- 5.1.3. Other Material Types
- 5.1.1. Plastic
- 5.2. Market Analysis, Insights and Forecast - by End-User Industry
- 5.2.1. Beverage
- 5.2.2. Food
- 5.2.3. Pharmaceutical and Healthcare
- 5.2.4. Cosmetics and Toiletries
- 5.2.5. Other En
- 5.3. Market Analysis, Insights and Forecast - by Region
- 5.3.1. North America
- 5.3.2. South America
- 5.3.3. Europe
- 5.3.4. Middle East & Africa
- 5.3.5. Asia Pacific
- 5.1. Market Analysis, Insights and Forecast - by Material Type
- 6. Global US Pharmaceutical Caps and Closures Industry Analysis, Insights and Forecast, 2021-2033
- 6.1. Market Analysis, Insights and Forecast - by Material Type
- 6.1.1. Plastic
- 6.1.1.1. PET
- 6.1.1.2. PP
- 6.1.1.3. HDPE and LDPE
- 6.1.1.4. Other Plastics
- 6.1.2. Metal
- 6.1.3. Other Material Types
- 6.1.1. Plastic
- 6.2. Market Analysis, Insights and Forecast - by End-User Industry
- 6.2.1. Beverage
- 6.2.2. Food
- 6.2.3. Pharmaceutical and Healthcare
- 6.2.4. Cosmetics and Toiletries
- 6.2.5. Other En
- 6.1. Market Analysis, Insights and Forecast - by Material Type
- 7. North America US Pharmaceutical Caps and Closures Industry Analysis, Insights and Forecast, 2020-2032
- 7.1. Market Analysis, Insights and Forecast - by Material Type
- 7.1.1. Plastic
- 7.1.1.1. PET
- 7.1.1.2. PP
- 7.1.1.3. HDPE and LDPE
- 7.1.1.4. Other Plastics
- 7.1.2. Metal
- 7.1.3. Other Material Types
- 7.1.1. Plastic
- 7.2. Market Analysis, Insights and Forecast - by End-User Industry
- 7.2.1. Beverage
- 7.2.2. Food
- 7.2.3. Pharmaceutical and Healthcare
- 7.2.4. Cosmetics and Toiletries
- 7.2.5. Other En
- 7.1. Market Analysis, Insights and Forecast - by Material Type
- 8. South America US Pharmaceutical Caps and Closures Industry Analysis, Insights and Forecast, 2020-2032
- 8.1. Market Analysis, Insights and Forecast - by Material Type
- 8.1.1. Plastic
- 8.1.1.1. PET
- 8.1.1.2. PP
- 8.1.1.3. HDPE and LDPE
- 8.1.1.4. Other Plastics
- 8.1.2. Metal
- 8.1.3. Other Material Types
- 8.1.1. Plastic
- 8.2. Market Analysis, Insights and Forecast - by End-User Industry
- 8.2.1. Beverage
- 8.2.2. Food
- 8.2.3. Pharmaceutical and Healthcare
- 8.2.4. Cosmetics and Toiletries
- 8.2.5. Other En
- 8.1. Market Analysis, Insights and Forecast - by Material Type
- 9. Europe US Pharmaceutical Caps and Closures Industry Analysis, Insights and Forecast, 2020-2032
- 9.1. Market Analysis, Insights and Forecast - by Material Type
- 9.1.1. Plastic
- 9.1.1.1. PET
- 9.1.1.2. PP
- 9.1.1.3. HDPE and LDPE
- 9.1.1.4. Other Plastics
- 9.1.2. Metal
- 9.1.3. Other Material Types
- 9.1.1. Plastic
- 9.2. Market Analysis, Insights and Forecast - by End-User Industry
- 9.2.1. Beverage
- 9.2.2. Food
- 9.2.3. Pharmaceutical and Healthcare
- 9.2.4. Cosmetics and Toiletries
- 9.2.5. Other En
- 9.1. Market Analysis, Insights and Forecast - by Material Type
- 10. Middle East & Africa US Pharmaceutical Caps and Closures Industry Analysis, Insights and Forecast, 2020-2032
- 10.1. Market Analysis, Insights and Forecast - by Material Type
- 10.1.1. Plastic
- 10.1.1.1. PET
- 10.1.1.2. PP
- 10.1.1.3. HDPE and LDPE
- 10.1.1.4. Other Plastics
- 10.1.2. Metal
- 10.1.3. Other Material Types
- 10.1.1. Plastic
- 10.2. Market Analysis, Insights and Forecast - by End-User Industry
- 10.2.1. Beverage
- 10.2.2. Food
- 10.2.3. Pharmaceutical and Healthcare
- 10.2.4. Cosmetics and Toiletries
- 10.2.5. Other En
- 10.1. Market Analysis, Insights and Forecast - by Material Type
- 11. Asia Pacific US Pharmaceutical Caps and Closures Industry Analysis, Insights and Forecast, 2020-2032
- 11.1. Market Analysis, Insights and Forecast - by Material Type
- 11.1.1. Plastic
- 11.1.1.1. PET
- 11.1.1.2. PP
- 11.1.1.3. HDPE and LDPE
- 11.1.1.4. Other Plastics
- 11.1.2. Metal
- 11.1.3. Other Material Types
- 11.1.1. Plastic
- 11.2. Market Analysis, Insights and Forecast - by End-User Industry
- 11.2.1. Beverage
- 11.2.2. Food
- 11.2.3. Pharmaceutical and Healthcare
- 11.2.4. Cosmetics and Toiletries
- 11.2.5. Other En
- 11.1. Market Analysis, Insights and Forecast - by Material Type
- 12. Competitive Analysis
- 12.1. Company Profiles
- 12.1.1 Aptar Group Inc
- 12.1.1.1. Company Overview
- 12.1.1.2. Products
- 12.1.1.3. Company Financials
- 12.1.1.4. SWOT Analysis
- 12.1.2 Tetra Pak International Sa
- 12.1.2.1. Company Overview
- 12.1.2.2. Products
- 12.1.2.3. Company Financials
- 12.1.2.4. SWOT Analysis
- 12.1.3 Coral Products Plc
- 12.1.3.1. Company Overview
- 12.1.3.2. Products
- 12.1.3.3. Company Financials
- 12.1.3.4. SWOT Analysis
- 12.1.4 Amcor Plc
- 12.1.4.1. Company Overview
- 12.1.4.2. Products
- 12.1.4.3. Company Financials
- 12.1.4.4. SWOT Analysis
- 12.1.5 Crown Holdings Inc
- 12.1.5.1. Company Overview
- 12.1.5.2. Products
- 12.1.5.3. Company Financials
- 12.1.5.4. SWOT Analysis
- 12.1.6 O Berk Company Llc*List Not Exhaustive
- 12.1.6.1. Company Overview
- 12.1.6.2. Products
- 12.1.6.3. Company Financials
- 12.1.6.4. SWOT Analysis
- 12.1.7 Bericap Holdings
- 12.1.7.1. Company Overview
- 12.1.7.2. Products
- 12.1.7.3. Company Financials
- 12.1.7.4. SWOT Analysis
- 12.1.8 Silgan Closures
- 12.1.8.1. Company Overview
- 12.1.8.2. Products
- 12.1.8.3. Company Financials
- 12.1.8.4. SWOT Analysis
- 12.1.9 Mjs Packaging
- 12.1.9.1. Company Overview
- 12.1.9.2. Products
- 12.1.9.3. Company Financials
- 12.1.9.4. SWOT Analysis
- 12.1.10 Albéa S A
- 12.1.10.1. Company Overview
- 12.1.10.2. Products
- 12.1.10.3. Company Financials
- 12.1.10.4. SWOT Analysis
- 12.1.11 Berry Global Inc
- 12.1.11.1. Company Overview
- 12.1.11.2. Products
- 12.1.11.3. Company Financials
- 12.1.11.4. SWOT Analysis
- 12.1.12 Closure Systems International
- 12.1.12.1. Company Overview
- 12.1.12.2. Products
- 12.1.12.3. Company Financials
- 12.1.12.4. SWOT Analysis
- 12.1.1 Aptar Group Inc
- 12.2. Market Entropy
- 12.2.1 Company's Key Areas Served
- 12.2.2 Recent Developments
- 12.3. Company Market Share Analysis 2025
- 12.3.1 Top 5 Companies Market Share Analysis
- 12.3.2 Top 3 Companies Market Share Analysis
- 12.4. List of Potential Customers
- 13. Research Methodology
List of Figures
- Figure 1: Global US Pharmaceutical Caps and Closures Industry Revenue Breakdown (billion, %) by Region 2025 & 2033
- Figure 2: North America US Pharmaceutical Caps and Closures Industry Revenue (billion), by Material Type 2025 & 2033
- Figure 3: North America US Pharmaceutical Caps and Closures Industry Revenue Share (%), by Material Type 2025 & 2033
- Figure 4: North America US Pharmaceutical Caps and Closures Industry Revenue (billion), by End-User Industry 2025 & 2033
- Figure 5: North America US Pharmaceutical Caps and Closures Industry Revenue Share (%), by End-User Industry 2025 & 2033
- Figure 6: North America US Pharmaceutical Caps and Closures Industry Revenue (billion), by Country 2025 & 2033
- Figure 7: North America US Pharmaceutical Caps and Closures Industry Revenue Share (%), by Country 2025 & 2033
- Figure 8: South America US Pharmaceutical Caps and Closures Industry Revenue (billion), by Material Type 2025 & 2033
- Figure 9: South America US Pharmaceutical Caps and Closures Industry Revenue Share (%), by Material Type 2025 & 2033
- Figure 10: South America US Pharmaceutical Caps and Closures Industry Revenue (billion), by End-User Industry 2025 & 2033
- Figure 11: South America US Pharmaceutical Caps and Closures Industry Revenue Share (%), by End-User Industry 2025 & 2033
- Figure 12: South America US Pharmaceutical Caps and Closures Industry Revenue (billion), by Country 2025 & 2033
- Figure 13: South America US Pharmaceutical Caps and Closures Industry Revenue Share (%), by Country 2025 & 2033
- Figure 14: Europe US Pharmaceutical Caps and Closures Industry Revenue (billion), by Material Type 2025 & 2033
- Figure 15: Europe US Pharmaceutical Caps and Closures Industry Revenue Share (%), by Material Type 2025 & 2033
- Figure 16: Europe US Pharmaceutical Caps and Closures Industry Revenue (billion), by End-User Industry 2025 & 2033
- Figure 17: Europe US Pharmaceutical Caps and Closures Industry Revenue Share (%), by End-User Industry 2025 & 2033
- Figure 18: Europe US Pharmaceutical Caps and Closures Industry Revenue (billion), by Country 2025 & 2033
- Figure 19: Europe US Pharmaceutical Caps and Closures Industry Revenue Share (%), by Country 2025 & 2033
- Figure 20: Middle East & Africa US Pharmaceutical Caps and Closures Industry Revenue (billion), by Material Type 2025 & 2033
- Figure 21: Middle East & Africa US Pharmaceutical Caps and Closures Industry Revenue Share (%), by Material Type 2025 & 2033
- Figure 22: Middle East & Africa US Pharmaceutical Caps and Closures Industry Revenue (billion), by End-User Industry 2025 & 2033
- Figure 23: Middle East & Africa US Pharmaceutical Caps and Closures Industry Revenue Share (%), by End-User Industry 2025 & 2033
- Figure 24: Middle East & Africa US Pharmaceutical Caps and Closures Industry Revenue (billion), by Country 2025 & 2033
- Figure 25: Middle East & Africa US Pharmaceutical Caps and Closures Industry Revenue Share (%), by Country 2025 & 2033
- Figure 26: Asia Pacific US Pharmaceutical Caps and Closures Industry Revenue (billion), by Material Type 2025 & 2033
- Figure 27: Asia Pacific US Pharmaceutical Caps and Closures Industry Revenue Share (%), by Material Type 2025 & 2033
- Figure 28: Asia Pacific US Pharmaceutical Caps and Closures Industry Revenue (billion), by End-User Industry 2025 & 2033
- Figure 29: Asia Pacific US Pharmaceutical Caps and Closures Industry Revenue Share (%), by End-User Industry 2025 & 2033
- Figure 30: Asia Pacific US Pharmaceutical Caps and Closures Industry Revenue (billion), by Country 2025 & 2033
- Figure 31: Asia Pacific US Pharmaceutical Caps and Closures Industry Revenue Share (%), by Country 2025 & 2033
List of Tables
- Table 1: Global US Pharmaceutical Caps and Closures Industry Revenue billion Forecast, by Material Type 2020 & 2033
- Table 2: Global US Pharmaceutical Caps and Closures Industry Revenue billion Forecast, by End-User Industry 2020 & 2033
- Table 3: Global US Pharmaceutical Caps and Closures Industry Revenue billion Forecast, by Region 2020 & 2033
- Table 4: Global US Pharmaceutical Caps and Closures Industry Revenue billion Forecast, by Material Type 2020 & 2033
- Table 5: Global US Pharmaceutical Caps and Closures Industry Revenue billion Forecast, by End-User Industry 2020 & 2033
- Table 6: Global US Pharmaceutical Caps and Closures Industry Revenue billion Forecast, by Country 2020 & 2033
- Table 7: United States US Pharmaceutical Caps and Closures Industry Revenue (billion) Forecast, by Application 2020 & 2033
- Table 8: Canada US Pharmaceutical Caps and Closures Industry Revenue (billion) Forecast, by Application 2020 & 2033
- Table 9: Mexico US Pharmaceutical Caps and Closures Industry Revenue (billion) Forecast, by Application 2020 & 2033
- Table 10: Global US Pharmaceutical Caps and Closures Industry Revenue billion Forecast, by Material Type 2020 & 2033
- Table 11: Global US Pharmaceutical Caps and Closures Industry Revenue billion Forecast, by End-User Industry 2020 & 2033
- Table 12: Global US Pharmaceutical Caps and Closures Industry Revenue billion Forecast, by Country 2020 & 2033
- Table 13: Brazil US Pharmaceutical Caps and Closures Industry Revenue (billion) Forecast, by Application 2020 & 2033
- Table 14: Argentina US Pharmaceutical Caps and Closures Industry Revenue (billion) Forecast, by Application 2020 & 2033
- Table 15: Rest of South America US Pharmaceutical Caps and Closures Industry Revenue (billion) Forecast, by Application 2020 & 2033
- Table 16: Global US Pharmaceutical Caps and Closures Industry Revenue billion Forecast, by Material Type 2020 & 2033
- Table 17: Global US Pharmaceutical Caps and Closures Industry Revenue billion Forecast, by End-User Industry 2020 & 2033
- Table 18: Global US Pharmaceutical Caps and Closures Industry Revenue billion Forecast, by Country 2020 & 2033
- Table 19: United Kingdom US Pharmaceutical Caps and Closures Industry Revenue (billion) Forecast, by Application 2020 & 2033
- Table 20: Germany US Pharmaceutical Caps and Closures Industry Revenue (billion) Forecast, by Application 2020 & 2033
- Table 21: France US Pharmaceutical Caps and Closures Industry Revenue (billion) Forecast, by Application 2020 & 2033
- Table 22: Italy US Pharmaceutical Caps and Closures Industry Revenue (billion) Forecast, by Application 2020 & 2033
- Table 23: Spain US Pharmaceutical Caps and Closures Industry Revenue (billion) Forecast, by Application 2020 & 2033
- Table 24: Russia US Pharmaceutical Caps and Closures Industry Revenue (billion) Forecast, by Application 2020 & 2033
- Table 25: Benelux US Pharmaceutical Caps and Closures Industry Revenue (billion) Forecast, by Application 2020 & 2033
- Table 26: Nordics US Pharmaceutical Caps and Closures Industry Revenue (billion) Forecast, by Application 2020 & 2033
- Table 27: Rest of Europe US Pharmaceutical Caps and Closures Industry Revenue (billion) Forecast, by Application 2020 & 2033
- Table 28: Global US Pharmaceutical Caps and Closures Industry Revenue billion Forecast, by Material Type 2020 & 2033
- Table 29: Global US Pharmaceutical Caps and Closures Industry Revenue billion Forecast, by End-User Industry 2020 & 2033
- Table 30: Global US Pharmaceutical Caps and Closures Industry Revenue billion Forecast, by Country 2020 & 2033
- Table 31: Turkey US Pharmaceutical Caps and Closures Industry Revenue (billion) Forecast, by Application 2020 & 2033
- Table 32: Israel US Pharmaceutical Caps and Closures Industry Revenue (billion) Forecast, by Application 2020 & 2033
- Table 33: GCC US Pharmaceutical Caps and Closures Industry Revenue (billion) Forecast, by Application 2020 & 2033
- Table 34: North Africa US Pharmaceutical Caps and Closures Industry Revenue (billion) Forecast, by Application 2020 & 2033
- Table 35: South Africa US Pharmaceutical Caps and Closures Industry Revenue (billion) Forecast, by Application 2020 & 2033
- Table 36: Rest of Middle East & Africa US Pharmaceutical Caps and Closures Industry Revenue (billion) Forecast, by Application 2020 & 2033
- Table 37: Global US Pharmaceutical Caps and Closures Industry Revenue billion Forecast, by Material Type 2020 & 2033
- Table 38: Global US Pharmaceutical Caps and Closures Industry Revenue billion Forecast, by End-User Industry 2020 & 2033
- Table 39: Global US Pharmaceutical Caps and Closures Industry Revenue billion Forecast, by Country 2020 & 2033
- Table 40: China US Pharmaceutical Caps and Closures Industry Revenue (billion) Forecast, by Application 2020 & 2033
- Table 41: India US Pharmaceutical Caps and Closures Industry Revenue (billion) Forecast, by Application 2020 & 2033
- Table 42: Japan US Pharmaceutical Caps and Closures Industry Revenue (billion) Forecast, by Application 2020 & 2033
- Table 43: South Korea US Pharmaceutical Caps and Closures Industry Revenue (billion) Forecast, by Application 2020 & 2033
- Table 44: ASEAN US Pharmaceutical Caps and Closures Industry Revenue (billion) Forecast, by Application 2020 & 2033
- Table 45: Oceania US Pharmaceutical Caps and Closures Industry Revenue (billion) Forecast, by Application 2020 & 2033
- Table 46: Rest of Asia Pacific US Pharmaceutical Caps and Closures Industry Revenue (billion) Forecast, by Application 2020 & 2033
Frequently Asked Questions
1. What is the projected Compound Annual Growth Rate (CAGR) of the US Pharmaceutical Caps and Closures Industry?
The projected CAGR is approximately 4.6%.
2. Which companies are prominent players in the US Pharmaceutical Caps and Closures Industry?
Key companies in the market include Aptar Group Inc, Tetra Pak International Sa, Coral Products Plc, Amcor Plc, Crown Holdings Inc, O Berk Company Llc*List Not Exhaustive, Bericap Holdings, Silgan Closures, Mjs Packaging, Albéa S A, Berry Global Inc, Closure Systems International.
3. What are the main segments of the US Pharmaceutical Caps and Closures Industry?
The market segments include Material Type, End-User Industry.
4. Can you provide details about the market size?
The market size is estimated to be USD 13.3 billion as of 2022.
5. What are some drivers contributing to market growth?
; The Increased Demand for Innovative Solutions from Different End Users..
6. What are the notable trends driving market growth?
Plastic to Witness a Highest Growth.
7. Are there any restraints impacting market growth?
; Stringent Regulation on Manufacturers Pertaining to Environmental Degradation.
8. Can you provide examples of recent developments in the market?
N/A
9. What pricing options are available for accessing the report?
Pricing options include single-user, multi-user, and enterprise licenses priced at USD 3800, USD 4500, and USD 5800 respectively.
10. Is the market size provided in terms of value or volume?
The market size is provided in terms of value, measured in billion.
11. Are there any specific market keywords associated with the report?
Yes, the market keyword associated with the report is "US Pharmaceutical Caps and Closures Industry," which aids in identifying and referencing the specific market segment covered.
12. How do I determine which pricing option suits my needs best?
The pricing options vary based on user requirements and access needs. Individual users may opt for single-user licenses, while businesses requiring broader access may choose multi-user or enterprise licenses for cost-effective access to the report.
13. Are there any additional resources or data provided in the US Pharmaceutical Caps and Closures Industry report?
While the report offers comprehensive insights, it's advisable to review the specific contents or supplementary materials provided to ascertain if additional resources or data are available.
14. How can I stay updated on further developments or reports in the US Pharmaceutical Caps and Closures Industry?
To stay informed about further developments, trends, and reports in the US Pharmaceutical Caps and Closures Industry, consider subscribing to industry newsletters, following relevant companies and organizations, or regularly checking reputable industry news sources and publications.
Methodology
Step 1 - Identification of Relevant Samples Size from Population Database


Step 2 - Approaches for Defining Global Market Size (Value, Volume* & Price*)

Note*: In applicable scenarios
Step 3 - Data Sources
Primary Research
- Web Analytics
- Survey Reports
- Research Institute
- Latest Research Reports
- Opinion Leaders
Secondary Research
- Annual Reports
- White Paper
- Latest Press Release
- Industry Association
- Paid Database
- Investor Presentations

Step 4 - Data Triangulation
Involves using different sources of information in order to increase the validity of a study
These sources are likely to be stakeholders in a program - participants, other researchers, program staff, other community members, and so on.
Then we put all data in single framework & apply various statistical tools to find out the dynamic on the market.
During the analysis stage, feedback from the stakeholder groups would be compared to determine areas of agreement as well as areas of divergence