

Key Insights
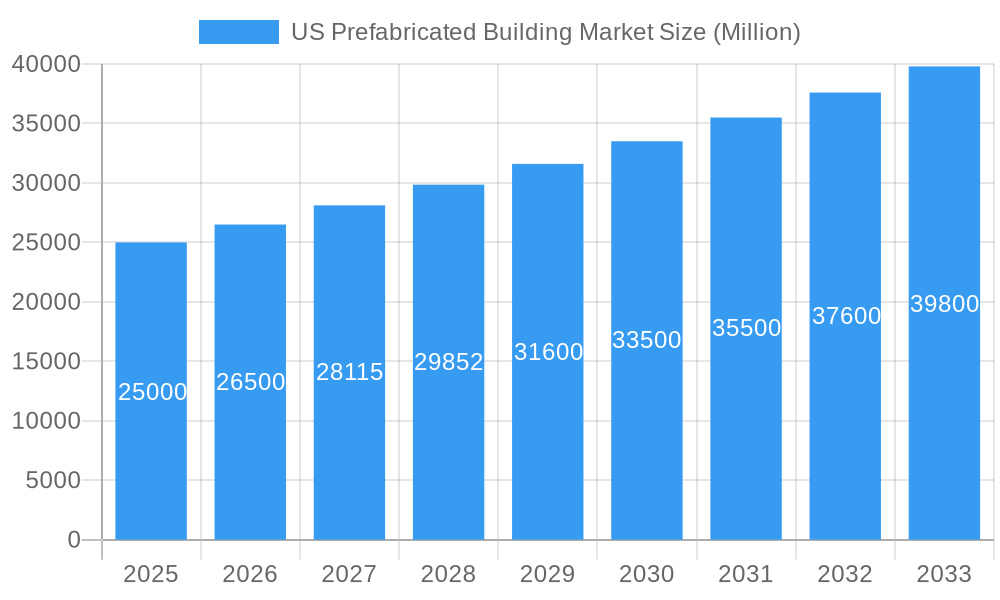
The US prefabricated building market is experiencing robust growth, driven by increasing demand for cost-effective, sustainable, and faster construction solutions. The market, valued at approximately $25 billion in 2025, is projected to maintain a Compound Annual Growth Rate (CAGR) exceeding 6% through 2033. This expansion is fueled by several key factors. Firstly, the surge in residential construction, particularly in high-growth urban areas, is significantly boosting demand for prefabricated homes and modular units. Secondly, the commercial sector is embracing prefabrication for its efficiency in constructing offices, retail spaces, and other commercial buildings. The infrastructure sector is also adopting this approach for projects needing rapid deployment, contributing to market growth. Furthermore, advancements in building materials and construction techniques are leading to higher quality, more sustainable, and aesthetically pleasing prefabricated structures. The growing awareness of the environmental benefits associated with prefabrication—reduced construction waste and lower carbon emissions—is further driving market adoption.
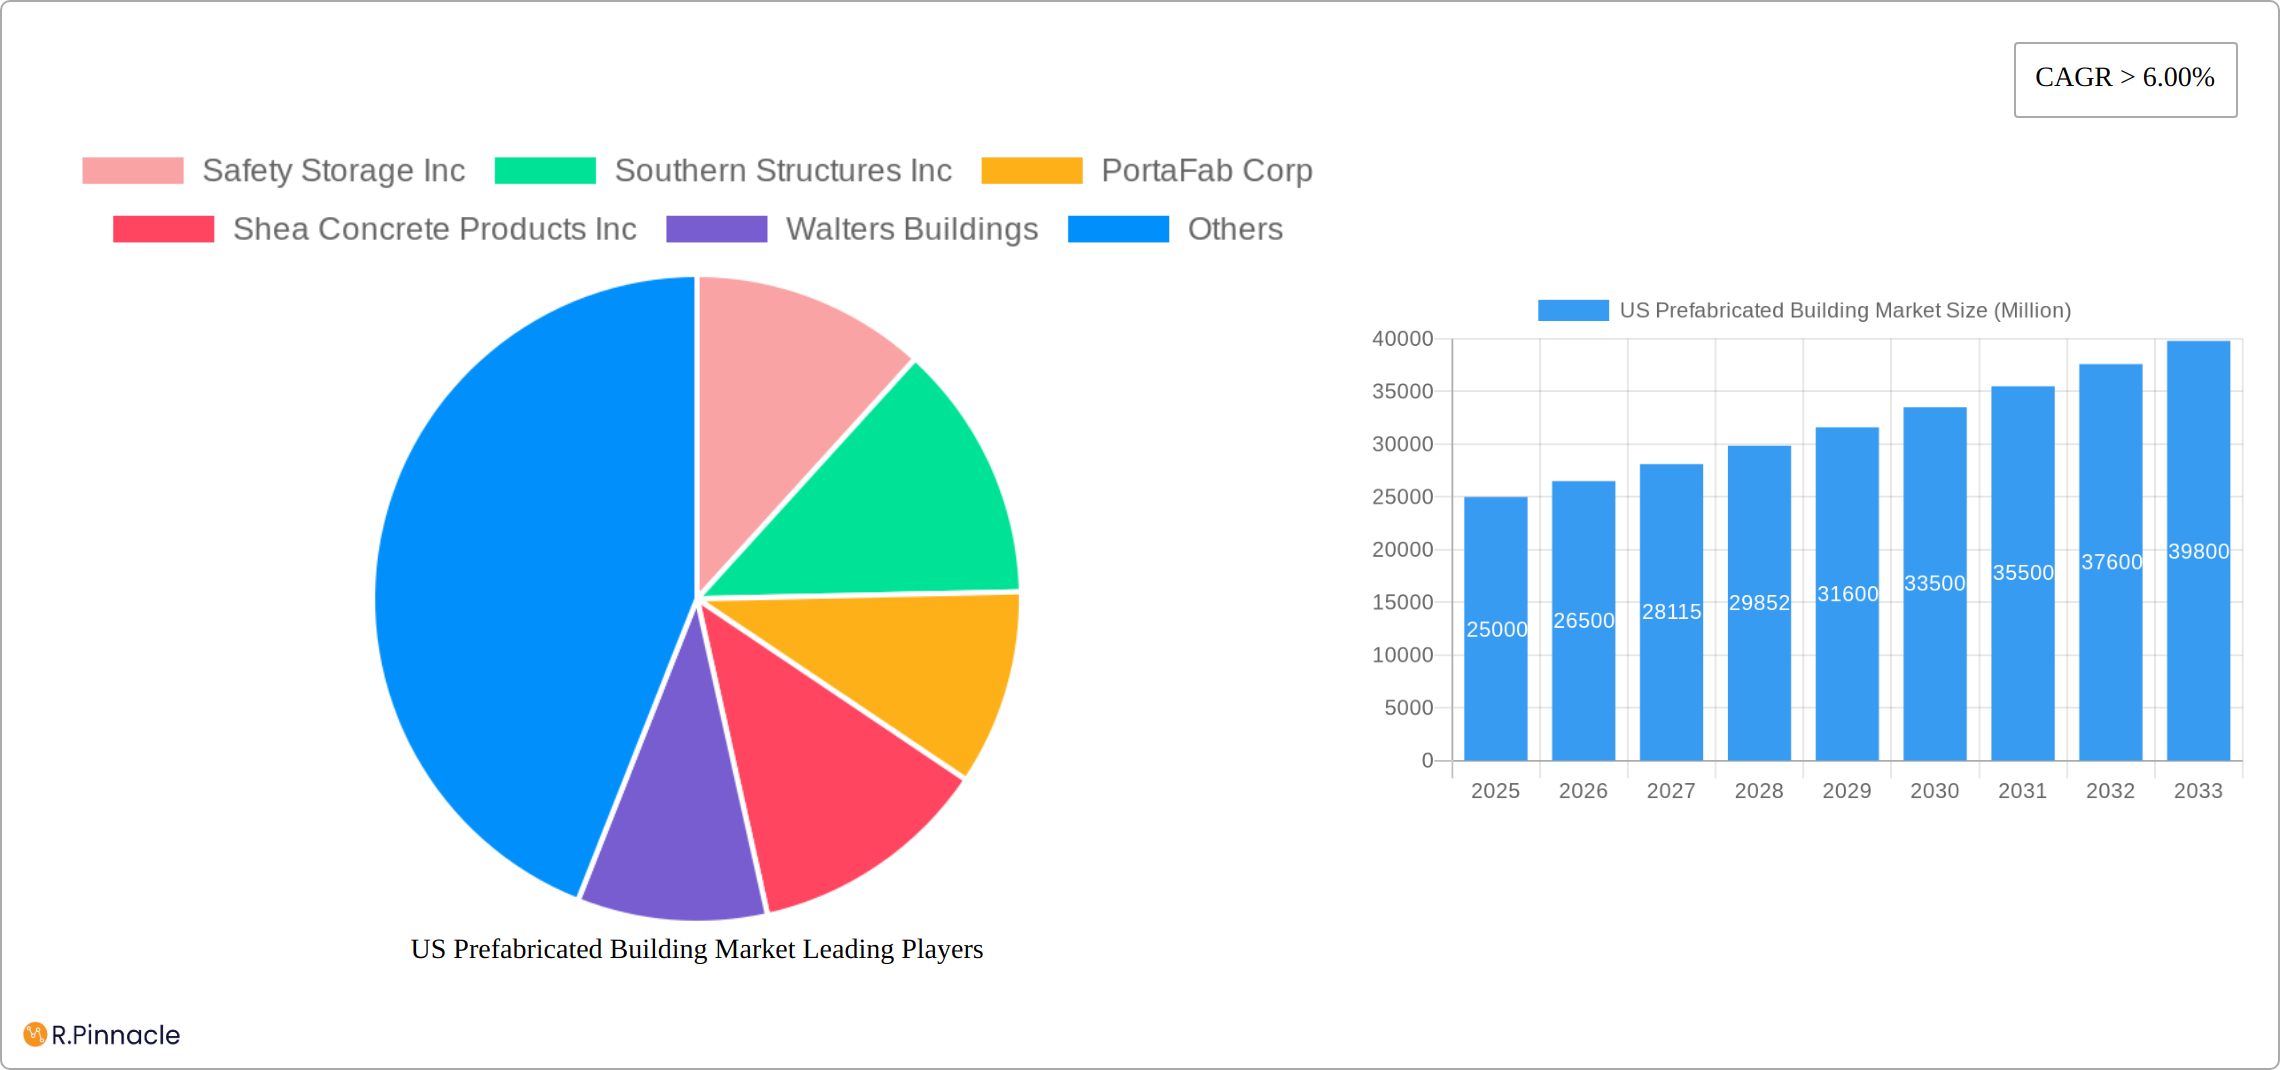
US Prefabricated Building Market Market Size (In Billion)
The market is segmented by material type (concrete, glass, metal, timber, and other materials) and application (residential, commercial, and other applications including infrastructure and industrial). While exact segment proportions are unavailable, the data suggests a strong presence across all segments, with metal and concrete likely dominating the material type segment due to their durability and versatility. Similarly, residential and commercial applications are expected to represent the largest portions of the application segment. Key players like Safety Storage Inc., Southern Structures Inc., and PortaFab Corp. are leading the market innovation, with competition intensifying as new entrants emerge, particularly within specialized niches like sustainable prefab construction. Regional variations exist across the United States, with faster growth predicted in regions experiencing robust population growth and construction activity. The forecast period of 2025-2033 anticipates continued market expansion, driven by sustained demand and ongoing technological advancements within the industry.
US Prefabricated Building Market Company Market Share
US Prefabricated Building Market Report: 2019-2033
This comprehensive report provides a detailed analysis of the US Prefabricated Building Market, offering invaluable insights for industry professionals, investors, and strategic decision-makers. With a study period spanning 2019-2033, a base year of 2025, and a forecast period of 2025-2033, this report delivers actionable intelligence on market size, growth drivers, challenges, and emerging opportunities. The report incorporates data from the historical period (2019-2024) and projects market trends through 2033.
US Prefabricated Building Market Structure & Innovation Trends
This section analyzes the competitive landscape of the US prefabricated building market, examining market concentration, key innovation drivers, regulatory frameworks, and market dynamics. We explore the impact of product substitutes and end-user demographics, alongside a review of recent mergers and acquisitions (M&A) activities.
Market Concentration: The market exhibits a moderately concentrated structure, with several major players holding significant market share. The exact market share percentages are detailed in the full report. However, key players include Safety Storage Inc, Southern Structures Inc, PortaFab Corp, Shea Concrete Products Inc, Walters Buildings, Commercial Structures Corp, Rubb Building Systems, Modular Connections LLC, Deluxe Building Solutions, and Panel Built Inc. The list is not exhaustive.
Innovation Drivers: Increasing demand for sustainable and efficient construction methods is a primary driver of innovation. Advancements in materials science, design software, and manufacturing technologies are leading to lighter, stronger, and more cost-effective prefabricated structures.
Regulatory Frameworks: Building codes and regulations at the federal, state, and local levels significantly impact the market. Compliance requirements and permitting processes influence project timelines and costs.
Product Substitutes: Traditional construction methods represent the primary substitute. However, the increasing cost-effectiveness and speed of prefabrication are gradually eroding this advantage.
End-User Demographics: The primary end-users are residential builders, commercial developers, and infrastructure projects. The specific demographic breakdown is analyzed further in the report.
M&A Activities: The report details recent M&A activity in the sector, including deal values (in Millions) and their impact on market consolidation. While specific deal values aren't publicly available for all transactions, the report provides estimates where possible. For example, xx Million in M&A activity was observed in 2024.
US Prefabricated Building Market Market Dynamics & Trends
This section delves into the key dynamics shaping the US prefabricated building market. We examine market growth drivers, technological disruptions, evolving consumer preferences, and the competitive dynamics among major and emerging players. The analysis incorporates quantitative data, including the Compound Annual Growth Rate (CAGR) and market penetration rates for various segments.
The market is experiencing robust growth, fueled by factors such as rising construction activity, increasing demand for sustainable building solutions, and advancements in prefabrication technologies. Technological disruptions, including the adoption of Building Information Modeling (BIM) and advanced manufacturing techniques, are transforming the industry. Consumer preferences are shifting towards faster, more efficient, and environmentally friendly construction methods, creating a favorable environment for prefabricated buildings. The competitive dynamics are characterized by intense rivalry among established players and the emergence of innovative startups. The full report provides a detailed analysis of the market's CAGR (projected at xx%) and market penetration. Specific growth forecasts for each segment are provided.
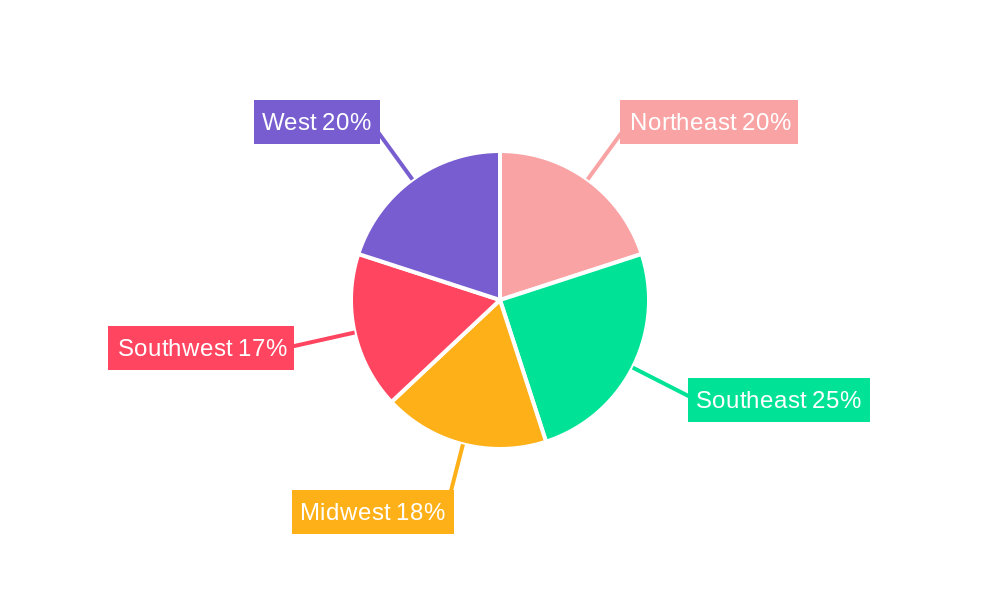
Dominant Regions & Segments in US Prefabricated Building Market
The US prefabricated building market is experiencing significant growth, driven by factors such as increasing demand for faster construction, sustainable building practices, and cost-effectiveness. This section details the leading regions and segments, analyzing the key factors contributing to their market dominance.
By Building Material Type:
Metal: The metal segment maintains its leading position due to its durability, cost-effectiveness, design flexibility, and suitability for various applications. Increased infrastructure spending and the burgeoning demand for industrial and commercial buildings are primary growth drivers. Further advancements in steel fabrication techniques and the incorporation of sustainable materials are expected to enhance this segment's dominance.
Concrete: Concrete prefabricated buildings remain a significant market segment, particularly in residential and infrastructure projects. The material's inherent strength and longevity contribute to its enduring popularity. Innovations in concrete mix designs and precast technologies are pushing the boundaries of design and functionality.
Timber: The timber segment showcases robust growth, fueled by its sustainability, aesthetic appeal, and advancements in engineered wood products. The introduction of innovative timber frame systems, like Knauf's advanced wall system, further enhances its appeal to eco-conscious builders and developers. This trend is expected to continue as sustainability concerns gain prominence.
Glass: While holding a smaller market share, the glass segment is steadily expanding, driven by its architectural appeal and the desire for increased natural light in buildings. This is particularly prevalent in commercial and high-end residential projects where aesthetics are paramount. Technological advancements in glass production and energy-efficient glazing options are supporting this growth.
Other Material Types: This diverse segment encompasses composite materials and other specialized materials tailored to specific applications. While currently a niche market, ongoing research and development suggest significant potential for future growth as these materials become more cost-effective and widely adopted.
By Application:
Commercial: The commercial sector represents a substantial portion of the market. The demand for faster construction timelines, efficient space utilization, and cost savings continues to drive growth in this segment. Prefabricated solutions are increasingly attractive to businesses aiming for quick occupancy and optimized operational efficiency.
Residential: The residential segment is exhibiting remarkable growth potential, fueled by the rising demand for housing, particularly in urban areas. Prefabricated homes offer faster construction times, cost savings, and design flexibility, appealing to a wider range of homebuyers. This trend is anticipated to continue as housing shortages and affordability concerns persist.
Infrastructure & Industrial: This segment demonstrates consistent and substantial growth, largely driven by large-scale infrastructure projects (e.g., schools, hospitals, transportation hubs) and the evolving needs of the industrial sector. Prefabricated solutions provide efficient and cost-effective options for these large-scale construction endeavors.
US Prefabricated Building Market Product Innovations
Recent product innovations focus on improved sustainability, enhanced design flexibility, and optimized construction processes. New materials, such as high-performance composites and recycled materials, are being incorporated into prefabricated structures. Innovations in modular design are enabling greater customization and faster assembly times. These advancements enhance the competitive advantage of prefabricated buildings by reducing construction costs and improving efficiency.
Report Scope & Segmentation Analysis
This report comprehensively segments the US prefabricated building market by type (Concrete, Glass, Metal, Timber, Other Material Types) and application (Residential, Commercial, Other Applications). Each segment's growth projections, market size (in Millions), and competitive dynamics are thoroughly analyzed. For example, the metal segment is expected to maintain its dominance with a xx% CAGR over the forecast period. Specific growth figures and market sizes for each segment are detailed in the full report.
Key Drivers of US Prefabricated Building Market Growth
Several factors are driving the growth of the US prefabricated building market. These include increasing urbanization and housing demand, government initiatives promoting sustainable construction, and technological advancements that lead to improved efficiency and lower costs. The rising adoption of prefabrication techniques in infrastructure and industrial projects also contributes significantly to market growth.
Challenges in the US Prefabricated Building Market Sector
The market faces challenges including fluctuating raw material prices, supply chain disruptions, and potential skills gaps in the workforce. Regulatory hurdles and stringent building codes can also increase project complexity and costs. Furthermore, overcoming consumer perceptions about the quality and aesthetics of prefabricated structures remains an ongoing challenge.
Emerging Opportunities in US Prefabricated Building Market
The market presents numerous opportunities, including the growing demand for sustainable and eco-friendly building materials. The integration of smart technologies and Internet of Things (IoT) devices into prefabricated structures offers potential for significant value creation. The expansion into new market segments, such as off-grid and disaster relief housing, presents further growth opportunities.
Leading Players in the US Prefabricated Building Market Market
- Safety Storage Inc
- Southern Structures Inc
- PortaFab Corp
- Shea Concrete Products Inc
- Walters Buildings
- Commercial Structures Corp
- Rubb Building Systems
- Modular Connections LLC
- Deluxe Building Solutions
- Panel Built Inc
Key Developments in US Prefabricated Building Market Industry
October 2022: Knauf's partnership to create a new timber frame wall system signifies a major innovation driving the adoption of prefabricated and modular building systems.
April 2022: Walters Inc.'s contract win for an electric arc steelmaking facility highlights the increasing use of prefabricated buildings in industrial applications.
Future Outlook for US Prefabricated Building Market Market
The US prefabricated building market is poised for continued robust growth, driven by technological advancements, increasing demand for sustainable construction, and favorable government policies. Strategic partnerships, expansion into new applications, and the development of innovative building materials will further shape the market’s future. The report projects significant market expansion over the forecast period, with substantial growth opportunities for key players.
US Prefabricated Building Market Segmentation
-
1. Type
- 1.1. Concrete
- 1.2. Glass
- 1.3. Metal
- 1.4. Timber
- 1.5. Other Material Types
-
2. Application
- 2.1. Residential
- 2.2. Commercial
- 2.3. Other Applications (Infrastructure and Industrial)
US Prefabricated Building Market Segmentation By Geography
-
1. North America
- 1.1. United States
- 1.2. Canada
- 1.3. Mexico
-
2. South America
- 2.1. Brazil
- 2.2. Argentina
- 2.3. Rest of South America
-
3. Europe
- 3.1. United Kingdom
- 3.2. Germany
- 3.3. France
- 3.4. Italy
- 3.5. Spain
- 3.6. Russia
- 3.7. Benelux
- 3.8. Nordics
- 3.9. Rest of Europe
-
4. Middle East & Africa
- 4.1. Turkey
- 4.2. Israel
- 4.3. GCC
- 4.4. North Africa
- 4.5. South Africa
- 4.6. Rest of Middle East & Africa
-
5. Asia Pacific
- 5.1. China
- 5.2. India
- 5.3. Japan
- 5.4. South Korea
- 5.5. ASEAN
- 5.6. Oceania
- 5.7. Rest of Asia Pacific
US Prefabricated Building Market Regional Market Share
Geographic Coverage of US Prefabricated Building Market
US Prefabricated Building Market REPORT HIGHLIGHTS
| Aspects | Details |
|---|---|
| Study Period | 2020-2034 |
| Base Year | 2025 |
| Estimated Year | 2026 |
| Forecast Period | 2026-2034 |
| Historical Period | 2020-2025 |
| Growth Rate | CAGR of > 6.00% from 2020-2034 |
| Segmentation |
|
Table of Contents
- 1. Introduction
- 1.1. Research Scope
- 1.2. Market Segmentation
- 1.3. Research Methodology
- 1.4. Definitions and Assumptions
- 2. Executive Summary
- 2.1. Introduction
- 3. Market Dynamics
- 3.1. Introduction
- 3.2. Market Drivers
- 3.2.1. 4.; Expansion of Mass Township Projects4.; Growing adoption of modular construction in the hospitality sector
- 3.3. Market Restrains
- 3.3.1. 4.; Logitsics and transport issue4.; Volatility in raw material prices
- 3.4. Market Trends
- 3.4.1. Increased Demand for Residential Houses Driving the Market
- 4. Market Factor Analysis
- 4.1. Porters Five Forces
- 4.2. Supply/Value Chain
- 4.3. PESTEL analysis
- 4.4. Market Entropy
- 4.5. Patent/Trademark Analysis
- 5. Global US Prefabricated Building Market Analysis, Insights and Forecast, 2020-2032
- 5.1. Market Analysis, Insights and Forecast - by Type
- 5.1.1. Concrete
- 5.1.2. Glass
- 5.1.3. Metal
- 5.1.4. Timber
- 5.1.5. Other Material Types
- 5.2. Market Analysis, Insights and Forecast - by Application
- 5.2.1. Residential
- 5.2.2. Commercial
- 5.2.3. Other Applications (Infrastructure and Industrial)
- 5.3. Market Analysis, Insights and Forecast - by Region
- 5.3.1. North America
- 5.3.2. South America
- 5.3.3. Europe
- 5.3.4. Middle East & Africa
- 5.3.5. Asia Pacific
- 5.1. Market Analysis, Insights and Forecast - by Type
- 6. North America US Prefabricated Building Market Analysis, Insights and Forecast, 2020-2032
- 6.1. Market Analysis, Insights and Forecast - by Type
- 6.1.1. Concrete
- 6.1.2. Glass
- 6.1.3. Metal
- 6.1.4. Timber
- 6.1.5. Other Material Types
- 6.2. Market Analysis, Insights and Forecast - by Application
- 6.2.1. Residential
- 6.2.2. Commercial
- 6.2.3. Other Applications (Infrastructure and Industrial)
- 6.1. Market Analysis, Insights and Forecast - by Type
- 7. South America US Prefabricated Building Market Analysis, Insights and Forecast, 2020-2032
- 7.1. Market Analysis, Insights and Forecast - by Type
- 7.1.1. Concrete
- 7.1.2. Glass
- 7.1.3. Metal
- 7.1.4. Timber
- 7.1.5. Other Material Types
- 7.2. Market Analysis, Insights and Forecast - by Application
- 7.2.1. Residential
- 7.2.2. Commercial
- 7.2.3. Other Applications (Infrastructure and Industrial)
- 7.1. Market Analysis, Insights and Forecast - by Type
- 8. Europe US Prefabricated Building Market Analysis, Insights and Forecast, 2020-2032
- 8.1. Market Analysis, Insights and Forecast - by Type
- 8.1.1. Concrete
- 8.1.2. Glass
- 8.1.3. Metal
- 8.1.4. Timber
- 8.1.5. Other Material Types
- 8.2. Market Analysis, Insights and Forecast - by Application
- 8.2.1. Residential
- 8.2.2. Commercial
- 8.2.3. Other Applications (Infrastructure and Industrial)
- 8.1. Market Analysis, Insights and Forecast - by Type
- 9. Middle East & Africa US Prefabricated Building Market Analysis, Insights and Forecast, 2020-2032
- 9.1. Market Analysis, Insights and Forecast - by Type
- 9.1.1. Concrete
- 9.1.2. Glass
- 9.1.3. Metal
- 9.1.4. Timber
- 9.1.5. Other Material Types
- 9.2. Market Analysis, Insights and Forecast - by Application
- 9.2.1. Residential
- 9.2.2. Commercial
- 9.2.3. Other Applications (Infrastructure and Industrial)
- 9.1. Market Analysis, Insights and Forecast - by Type
- 10. Asia Pacific US Prefabricated Building Market Analysis, Insights and Forecast, 2020-2032
- 10.1. Market Analysis, Insights and Forecast - by Type
- 10.1.1. Concrete
- 10.1.2. Glass
- 10.1.3. Metal
- 10.1.4. Timber
- 10.1.5. Other Material Types
- 10.2. Market Analysis, Insights and Forecast - by Application
- 10.2.1. Residential
- 10.2.2. Commercial
- 10.2.3. Other Applications (Infrastructure and Industrial)
- 10.1. Market Analysis, Insights and Forecast - by Type
- 11. Competitive Analysis
- 11.1. Global Market Share Analysis 2025
- 11.2. Company Profiles
- 11.2.1 Safety Storage Inc
- 11.2.1.1. Overview
- 11.2.1.2. Products
- 11.2.1.3. SWOT Analysis
- 11.2.1.4. Recent Developments
- 11.2.1.5. Financials (Based on Availability)
- 11.2.2 Southern Structures Inc
- 11.2.2.1. Overview
- 11.2.2.2. Products
- 11.2.2.3. SWOT Analysis
- 11.2.2.4. Recent Developments
- 11.2.2.5. Financials (Based on Availability)
- 11.2.3 PortaFab Corp
- 11.2.3.1. Overview
- 11.2.3.2. Products
- 11.2.3.3. SWOT Analysis
- 11.2.3.4. Recent Developments
- 11.2.3.5. Financials (Based on Availability)
- 11.2.4 Shea Concrete Products Inc
- 11.2.4.1. Overview
- 11.2.4.2. Products
- 11.2.4.3. SWOT Analysis
- 11.2.4.4. Recent Developments
- 11.2.4.5. Financials (Based on Availability)
- 11.2.5 Walters Buildings
- 11.2.5.1. Overview
- 11.2.5.2. Products
- 11.2.5.3. SWOT Analysis
- 11.2.5.4. Recent Developments
- 11.2.5.5. Financials (Based on Availability)
- 11.2.6 Commercial Structures Corp
- 11.2.6.1. Overview
- 11.2.6.2. Products
- 11.2.6.3. SWOT Analysis
- 11.2.6.4. Recent Developments
- 11.2.6.5. Financials (Based on Availability)
- 11.2.7 Rubb Building Systems
- 11.2.7.1. Overview
- 11.2.7.2. Products
- 11.2.7.3. SWOT Analysis
- 11.2.7.4. Recent Developments
- 11.2.7.5. Financials (Based on Availability)
- 11.2.8 Modular Connections LLC**List Not Exhaustive
- 11.2.8.1. Overview
- 11.2.8.2. Products
- 11.2.8.3. SWOT Analysis
- 11.2.8.4. Recent Developments
- 11.2.8.5. Financials (Based on Availability)
- 11.2.9 Deluxe Building Solutions
- 11.2.9.1. Overview
- 11.2.9.2. Products
- 11.2.9.3. SWOT Analysis
- 11.2.9.4. Recent Developments
- 11.2.9.5. Financials (Based on Availability)
- 11.2.10 Panel Built Inc
- 11.2.10.1. Overview
- 11.2.10.2. Products
- 11.2.10.3. SWOT Analysis
- 11.2.10.4. Recent Developments
- 11.2.10.5. Financials (Based on Availability)
- 11.2.1 Safety Storage Inc
List of Figures
- Figure 1: Global US Prefabricated Building Market Revenue Breakdown (Million, %) by Region 2025 & 2033
- Figure 2: North America US Prefabricated Building Market Revenue (Million), by Type 2025 & 2033
- Figure 3: North America US Prefabricated Building Market Revenue Share (%), by Type 2025 & 2033
- Figure 4: North America US Prefabricated Building Market Revenue (Million), by Application 2025 & 2033
- Figure 5: North America US Prefabricated Building Market Revenue Share (%), by Application 2025 & 2033
- Figure 6: North America US Prefabricated Building Market Revenue (Million), by Country 2025 & 2033
- Figure 7: North America US Prefabricated Building Market Revenue Share (%), by Country 2025 & 2033
- Figure 8: South America US Prefabricated Building Market Revenue (Million), by Type 2025 & 2033
- Figure 9: South America US Prefabricated Building Market Revenue Share (%), by Type 2025 & 2033
- Figure 10: South America US Prefabricated Building Market Revenue (Million), by Application 2025 & 2033
- Figure 11: South America US Prefabricated Building Market Revenue Share (%), by Application 2025 & 2033
- Figure 12: South America US Prefabricated Building Market Revenue (Million), by Country 2025 & 2033
- Figure 13: South America US Prefabricated Building Market Revenue Share (%), by Country 2025 & 2033
- Figure 14: Europe US Prefabricated Building Market Revenue (Million), by Type 2025 & 2033
- Figure 15: Europe US Prefabricated Building Market Revenue Share (%), by Type 2025 & 2033
- Figure 16: Europe US Prefabricated Building Market Revenue (Million), by Application 2025 & 2033
- Figure 17: Europe US Prefabricated Building Market Revenue Share (%), by Application 2025 & 2033
- Figure 18: Europe US Prefabricated Building Market Revenue (Million), by Country 2025 & 2033
- Figure 19: Europe US Prefabricated Building Market Revenue Share (%), by Country 2025 & 2033
- Figure 20: Middle East & Africa US Prefabricated Building Market Revenue (Million), by Type 2025 & 2033
- Figure 21: Middle East & Africa US Prefabricated Building Market Revenue Share (%), by Type 2025 & 2033
- Figure 22: Middle East & Africa US Prefabricated Building Market Revenue (Million), by Application 2025 & 2033
- Figure 23: Middle East & Africa US Prefabricated Building Market Revenue Share (%), by Application 2025 & 2033
- Figure 24: Middle East & Africa US Prefabricated Building Market Revenue (Million), by Country 2025 & 2033
- Figure 25: Middle East & Africa US Prefabricated Building Market Revenue Share (%), by Country 2025 & 2033
- Figure 26: Asia Pacific US Prefabricated Building Market Revenue (Million), by Type 2025 & 2033
- Figure 27: Asia Pacific US Prefabricated Building Market Revenue Share (%), by Type 2025 & 2033
- Figure 28: Asia Pacific US Prefabricated Building Market Revenue (Million), by Application 2025 & 2033
- Figure 29: Asia Pacific US Prefabricated Building Market Revenue Share (%), by Application 2025 & 2033
- Figure 30: Asia Pacific US Prefabricated Building Market Revenue (Million), by Country 2025 & 2033
- Figure 31: Asia Pacific US Prefabricated Building Market Revenue Share (%), by Country 2025 & 2033
List of Tables
- Table 1: Global US Prefabricated Building Market Revenue Million Forecast, by Type 2020 & 2033
- Table 2: Global US Prefabricated Building Market Revenue Million Forecast, by Application 2020 & 2033
- Table 3: Global US Prefabricated Building Market Revenue Million Forecast, by Region 2020 & 2033
- Table 4: Global US Prefabricated Building Market Revenue Million Forecast, by Type 2020 & 2033
- Table 5: Global US Prefabricated Building Market Revenue Million Forecast, by Application 2020 & 2033
- Table 6: Global US Prefabricated Building Market Revenue Million Forecast, by Country 2020 & 2033
- Table 7: United States US Prefabricated Building Market Revenue (Million) Forecast, by Application 2020 & 2033
- Table 8: Canada US Prefabricated Building Market Revenue (Million) Forecast, by Application 2020 & 2033
- Table 9: Mexico US Prefabricated Building Market Revenue (Million) Forecast, by Application 2020 & 2033
- Table 10: Global US Prefabricated Building Market Revenue Million Forecast, by Type 2020 & 2033
- Table 11: Global US Prefabricated Building Market Revenue Million Forecast, by Application 2020 & 2033
- Table 12: Global US Prefabricated Building Market Revenue Million Forecast, by Country 2020 & 2033
- Table 13: Brazil US Prefabricated Building Market Revenue (Million) Forecast, by Application 2020 & 2033
- Table 14: Argentina US Prefabricated Building Market Revenue (Million) Forecast, by Application 2020 & 2033
- Table 15: Rest of South America US Prefabricated Building Market Revenue (Million) Forecast, by Application 2020 & 2033
- Table 16: Global US Prefabricated Building Market Revenue Million Forecast, by Type 2020 & 2033
- Table 17: Global US Prefabricated Building Market Revenue Million Forecast, by Application 2020 & 2033
- Table 18: Global US Prefabricated Building Market Revenue Million Forecast, by Country 2020 & 2033
- Table 19: United Kingdom US Prefabricated Building Market Revenue (Million) Forecast, by Application 2020 & 2033
- Table 20: Germany US Prefabricated Building Market Revenue (Million) Forecast, by Application 2020 & 2033
- Table 21: France US Prefabricated Building Market Revenue (Million) Forecast, by Application 2020 & 2033
- Table 22: Italy US Prefabricated Building Market Revenue (Million) Forecast, by Application 2020 & 2033
- Table 23: Spain US Prefabricated Building Market Revenue (Million) Forecast, by Application 2020 & 2033
- Table 24: Russia US Prefabricated Building Market Revenue (Million) Forecast, by Application 2020 & 2033
- Table 25: Benelux US Prefabricated Building Market Revenue (Million) Forecast, by Application 2020 & 2033
- Table 26: Nordics US Prefabricated Building Market Revenue (Million) Forecast, by Application 2020 & 2033
- Table 27: Rest of Europe US Prefabricated Building Market Revenue (Million) Forecast, by Application 2020 & 2033
- Table 28: Global US Prefabricated Building Market Revenue Million Forecast, by Type 2020 & 2033
- Table 29: Global US Prefabricated Building Market Revenue Million Forecast, by Application 2020 & 2033
- Table 30: Global US Prefabricated Building Market Revenue Million Forecast, by Country 2020 & 2033
- Table 31: Turkey US Prefabricated Building Market Revenue (Million) Forecast, by Application 2020 & 2033
- Table 32: Israel US Prefabricated Building Market Revenue (Million) Forecast, by Application 2020 & 2033
- Table 33: GCC US Prefabricated Building Market Revenue (Million) Forecast, by Application 2020 & 2033
- Table 34: North Africa US Prefabricated Building Market Revenue (Million) Forecast, by Application 2020 & 2033
- Table 35: South Africa US Prefabricated Building Market Revenue (Million) Forecast, by Application 2020 & 2033
- Table 36: Rest of Middle East & Africa US Prefabricated Building Market Revenue (Million) Forecast, by Application 2020 & 2033
- Table 37: Global US Prefabricated Building Market Revenue Million Forecast, by Type 2020 & 2033
- Table 38: Global US Prefabricated Building Market Revenue Million Forecast, by Application 2020 & 2033
- Table 39: Global US Prefabricated Building Market Revenue Million Forecast, by Country 2020 & 2033
- Table 40: China US Prefabricated Building Market Revenue (Million) Forecast, by Application 2020 & 2033
- Table 41: India US Prefabricated Building Market Revenue (Million) Forecast, by Application 2020 & 2033
- Table 42: Japan US Prefabricated Building Market Revenue (Million) Forecast, by Application 2020 & 2033
- Table 43: South Korea US Prefabricated Building Market Revenue (Million) Forecast, by Application 2020 & 2033
- Table 44: ASEAN US Prefabricated Building Market Revenue (Million) Forecast, by Application 2020 & 2033
- Table 45: Oceania US Prefabricated Building Market Revenue (Million) Forecast, by Application 2020 & 2033
- Table 46: Rest of Asia Pacific US Prefabricated Building Market Revenue (Million) Forecast, by Application 2020 & 2033
Frequently Asked Questions
1. What is the projected Compound Annual Growth Rate (CAGR) of the US Prefabricated Building Market?
The projected CAGR is approximately > 6.00%.
2. Which companies are prominent players in the US Prefabricated Building Market?
Key companies in the market include Safety Storage Inc, Southern Structures Inc, PortaFab Corp, Shea Concrete Products Inc, Walters Buildings, Commercial Structures Corp, Rubb Building Systems, Modular Connections LLC**List Not Exhaustive, Deluxe Building Solutions, Panel Built Inc.
3. What are the main segments of the US Prefabricated Building Market?
The market segments include Type, Application.
4. Can you provide details about the market size?
The market size is estimated to be USD XX Million as of 2022.
5. What are some drivers contributing to market growth?
4.; Expansion of Mass Township Projects4.; Growing adoption of modular construction in the hospitality sector.
6. What are the notable trends driving market growth?
Increased Demand for Residential Houses Driving the Market.
7. Are there any restraints impacting market growth?
4.; Logitsics and transport issue4.; Volatility in raw material prices.
8. Can you provide examples of recent developments in the market?
October 2022: Knauf is at the forefront of the change in timber frame construction. This development toward prefabricated and modular building systems is being driven by a unique partnership between Knauf Gips and Knauf Insulation within the Knauf Group, creating a wall system that is prepared for the future of timber frame construction and prefabrication. The approach provides a single point of contact for specialized builders, developers, and architects to get high-quality timber frame walls from a reliable partner.
9. What pricing options are available for accessing the report?
Pricing options include single-user, multi-user, and enterprise licenses priced at USD 3800, USD 4500, and USD 5800 respectively.
10. Is the market size provided in terms of value or volume?
The market size is provided in terms of value, measured in Million.
11. Are there any specific market keywords associated with the report?
Yes, the market keyword associated with the report is "US Prefabricated Building Market," which aids in identifying and referencing the specific market segment covered.
12. How do I determine which pricing option suits my needs best?
The pricing options vary based on user requirements and access needs. Individual users may opt for single-user licenses, while businesses requiring broader access may choose multi-user or enterprise licenses for cost-effective access to the report.
13. Are there any additional resources or data provided in the US Prefabricated Building Market report?
While the report offers comprehensive insights, it's advisable to review the specific contents or supplementary materials provided to ascertain if additional resources or data are available.
14. How can I stay updated on further developments or reports in the US Prefabricated Building Market?
To stay informed about further developments, trends, and reports in the US Prefabricated Building Market, consider subscribing to industry newsletters, following relevant companies and organizations, or regularly checking reputable industry news sources and publications.
Methodology
Step 1 - Identification of Relevant Samples Size from Population Database


Step 2 - Approaches for Defining Global Market Size (Value, Volume* & Price*)

Note*: In applicable scenarios
Step 3 - Data Sources
Primary Research
- Web Analytics
- Survey Reports
- Research Institute
- Latest Research Reports
- Opinion Leaders
Secondary Research
- Annual Reports
- White Paper
- Latest Press Release
- Industry Association
- Paid Database
- Investor Presentations

Step 4 - Data Triangulation
Involves using different sources of information in order to increase the validity of a study
These sources are likely to be stakeholders in a program - participants, other researchers, program staff, other community members, and so on.
Then we put all data in single framework & apply various statistical tools to find out the dynamic on the market.
During the analysis stage, feedback from the stakeholder groups would be compared to determine areas of agreement as well as areas of divergence