

Key Insights
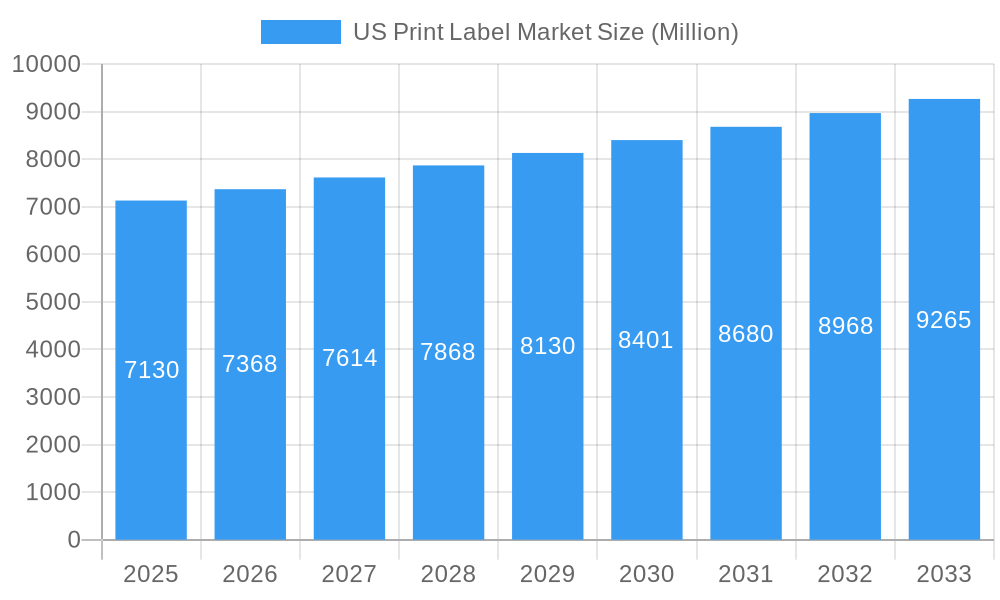
The US print label market, valued at $7.13 billion in 2025, is projected to experience steady growth, driven by the expanding food and beverage, healthcare, and e-commerce sectors. The increasing demand for product identification, brand enhancement, and tamper-evident features fuels market expansion. Pressure-sensitive labels dominate the format segment due to their ease of application and versatility across various end-user industries. Offset lithography remains a prominent print process, although flexography is gaining traction due to its cost-effectiveness for high-volume production and suitability for flexible substrates. Growth is further stimulated by technological advancements in digital printing, enabling personalized and short-run label production. However, environmental concerns surrounding adhesive and ink composition, along with increasing competition from digital labeling solutions, present challenges to market growth. The market segmentation reflects a diverse landscape, with significant contributions from major players like Avery Dennison and others, each catering to specific segments and technological advancements. Regional variations within the US, influenced by factors like consumer spending patterns and manufacturing hubs, also contribute to the overall market dynamics. The consistent CAGR of 3.19% indicates a stable, albeit not explosive, growth trajectory.
US Print Label Market Market Size (In Billion)
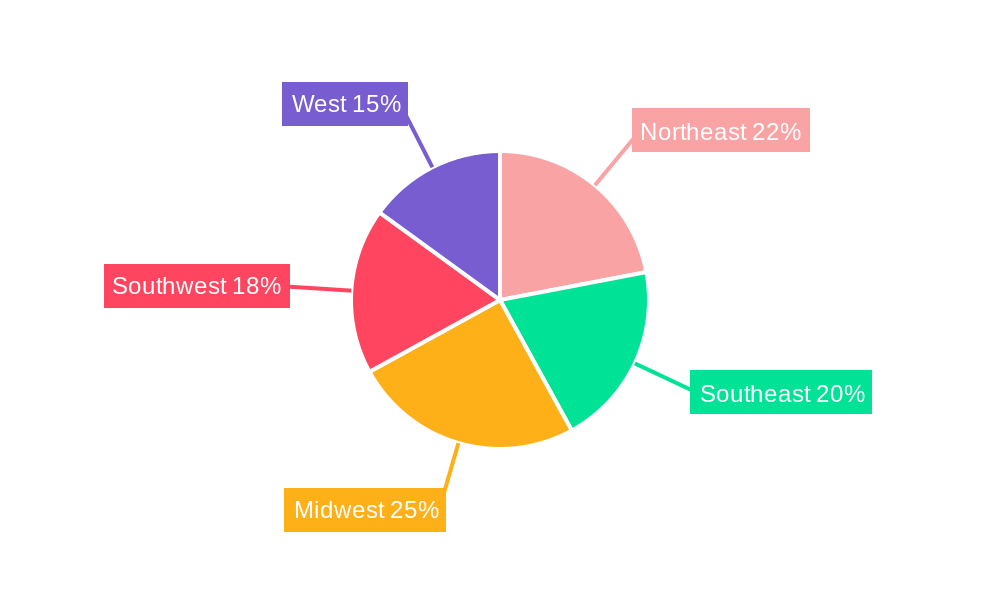
Looking forward to 2033, the US print label market is expected to continue its upward trajectory. Factors such as the increasing adoption of sustainable labeling practices, innovations in material science leading to more durable and eco-friendly label options, and the rise of advanced labeling technologies supporting traceability and brand authentication will be key drivers. Competition will remain intense, with companies focused on expanding their product portfolios, optimizing production processes, and investing in research and development to remain at the forefront of innovation. The regional breakdown within the US will continue to show variances, driven by economic conditions, regional manufacturing trends, and evolving consumer preferences across different segments like the Northeast's strong focus on cosmetics and the Midwest's predominance in food and beverage. The ongoing focus on automation and advanced manufacturing technologies within the labeling industry further shapes future market trends.
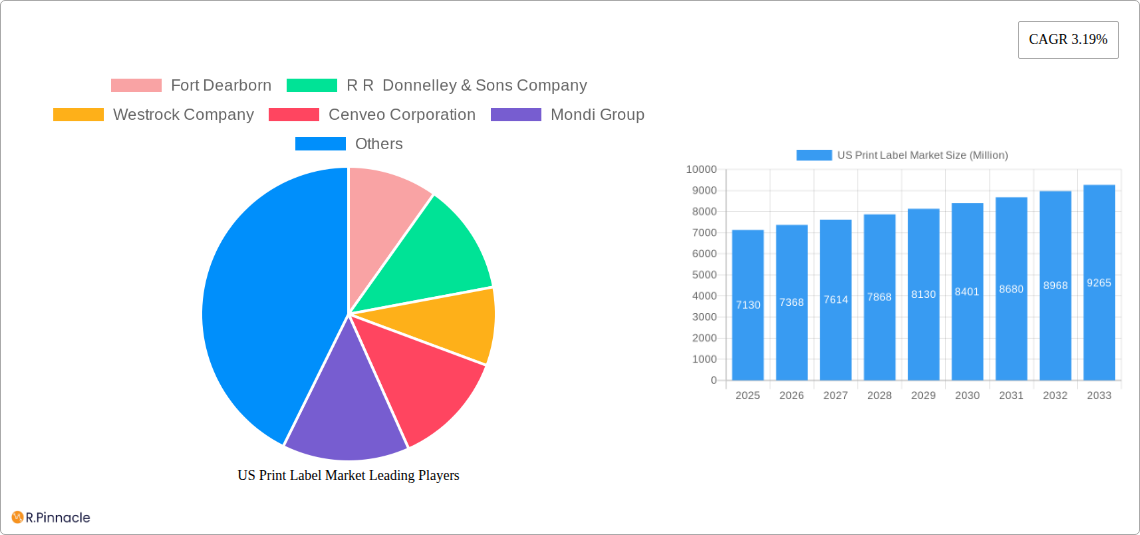
US Print Label Market Company Market Share
US Print Label Market Report: 2019-2033 Forecast
This comprehensive report provides a detailed analysis of the US print label market, offering invaluable insights for industry professionals, investors, and strategic decision-makers. Covering the period 2019-2033, with a focus on 2025, this report unveils the market's structure, dynamics, and future potential. We delve into key segments, leading players, and emerging trends, equipping you with the knowledge to navigate this dynamic landscape.
US Print Label Market Structure & Innovation Trends
The US print label market is a dynamic sector characterized by a mix of large multinational corporations and smaller specialized players. Market concentration is moderate, with several key players holding significant market share. For example, companies like Avery Dennison Corporation, R R Donnelley & Sons Company, and Fort Dearborn command substantial portions of the market. However, numerous smaller firms contribute significantly to the overall market volume. Innovation in the sector is driven by advancements in print technology (e.g., inkjet, digital printing), the demand for sustainable materials, and evolving end-user requirements for enhanced product labeling. Regulatory frameworks, such as those concerning food safety and environmental compliance, significantly impact the industry. Product substitutes, like digital displays and RFID tags, present ongoing competitive pressure. The market also experiences considerable M&A activity, as evidenced by the USD 24 Million acquisition of JDC Solutions by Avery Dennison in March 2021. This highlights the consolidation trend within the market. Analyzing end-user demographics reveals a diverse landscape including food, beverage, healthcare, and industrial sectors, each with specific labeling needs. The overall market structure reflects a balance between established players and innovative newcomers, constantly adapting to technological advancements and evolving consumer demands.
- Market Share: Avery Dennison: xx%, R R Donnelley & Sons: xx%, Fort Dearborn: xx%, Others: xx%
- M&A Activity: Total deal value (2019-2024): USD xx Million
US Print Label Market Dynamics & Trends
The US print label market exhibits robust growth, driven by several key factors. The increasing demand for packaged goods across various sectors fuels market expansion. Technological disruptions, primarily the adoption of digital printing technologies, are revolutionizing production efficiency and customization options. Consumers increasingly demand clear, informative, and aesthetically pleasing labels, influencing label design and materials. Competitive dynamics are characterized by ongoing innovation, price competition, and strategic partnerships. The market demonstrates a significant CAGR of xx% during the forecast period (2025-2033) with pressure-sensitive labels dominating the market, reaching a market penetration of xx%. The shift towards sustainable and eco-friendly labeling materials is gaining momentum, further shaping market dynamics. The increasing adoption of e-commerce is also contributing to a heightened demand for labels, especially those suitable for automated packaging and shipping processes.
Dominant Regions & Segments in US Print Label Market
The US print label market shows regional variations in growth and segment dominance. While a precise ranking of individual states is unavailable, several factors influence regional performance. Population density, industrial concentration, and proximity to key manufacturing hubs are all influential. Within the segment breakdown, several trends emerge:
By Print Process: Flexography holds a dominant share due to its versatility and cost-effectiveness. Digital printing technologies are experiencing rapid growth, driven by the demand for customized and short-run labels.
By Label Format: Pressure-sensitive labels dominate, followed by wet-glue labels. Linerless labels are gaining traction, driven by sustainability concerns.
By End-user Industry: Food and beverage, and healthcare are major sectors driving market growth, followed by the industrial sector. Growth in these sectors is primarily influenced by:
- Food & Beverage: Increased consumption of packaged foods and beverages.
- Healthcare: Stringent regulatory requirements and the need for accurate product information.
- Industrial: Growing demand for product identification and traceability in various industrial applications.
US Print Label Market Product Innovations
Recent product innovations focus on enhanced functionalities, sustainability, and customization. New materials are being developed to meet diverse application needs, including those requiring durability, temperature resistance, and chemical inertness. Advancements in digital printing offer improved design flexibility and cost-effectiveness for shorter print runs. The market sees increased adoption of smart labels incorporating RFID technology, enabling enhanced product tracking and consumer engagement. Overall, product innovation is driven by both technological advancements and the desire to provide better and more sustainable solutions for end-users.
Report Scope & Segmentation Analysis
This report segments the US print label market across print processes (Offset Lithography, Gravure, Flexography, Screen, Letterpress, Electrophotography, Inkjet), label formats (Wet-glue Labels, Pressure-sensitive Labels, Linerless Labels, Multi-part Tracking Labels, In-mold Labels, Shrink and Stretch Sleeves), and end-user industries (Food, Beverage, Healthcare, Cosmetics, Household, Industrial (Automotive, Industrial Chemicals, Consumer and Non-consumer Durables), Logistics, Other End-user Industries). Each segment's analysis includes growth projections, market size estimations, and competitive dynamics for the historical period (2019-2024), base year (2025), and forecast period (2025-2033). Detailed market sizing and growth projections are provided for each segment within the full report.
Key Drivers of US Print Label Market Growth
The US print label market's growth is propelled by several key factors: Firstly, the flourishing e-commerce sector demands efficient and reliable labeling solutions. Secondly, technological advancements, such as digital printing and smart label technologies, offer enhanced customization and traceability. Thirdly, regulatory mandates driving product labeling compliance across various industries contribute to growth. Finally, the increased demand for packaged goods across diverse sectors continuously fuels market expansion.
Challenges in the US Print Label Market Sector
The US print label market faces challenges including fluctuating raw material prices impacting production costs, intense competition among established players and new entrants, and environmental concerns regarding label waste and sustainability. Supply chain disruptions can cause production delays and increased costs. Meeting ever-evolving regulatory requirements concerning product labeling adds complexity and cost. These challenges necessitate strategic adaptations by market participants to maintain competitiveness and profitability.
Emerging Opportunities in US Print Label Market
Emerging opportunities lie in sustainable and eco-friendly labels utilizing recycled materials and biodegradable options. Growth is also seen in specialized label types, such as tamper-evident and smart labels, meeting the growing demands for product security and consumer engagement. Expanding into niche markets with unique labeling requirements, such as pharmaceutical and cosmetics packaging, presents further growth prospects. Investment in advanced technologies like augmented reality (AR) and RFID for smart labels also presents significant potential.
Leading Players in the US Print Label Market Market
- Fort Dearborn
- R R Donnelley & Sons Company
- Westrock Company
- Cenveo Corporation
- Mondi Group
- Multi Color Corporation
- Avery Dennison Corporation
- Taylor Corporation
- Ahlstrom-munksjö Oyj
- Brady Corporation
Key Developments in US Print Label Market Industry
- March 2021: Avery Dennison Corporation acquired JDC Solutions, Inc. for USD 24 Million, expanding its pressure-sensitive tape portfolio.
- February 2021: R.R. Donnelley & Sons Company expanded operations in Sacramento, boosting its commercial print capabilities.
Future Outlook for US Print Label Market Market
The US print label market is poised for sustained growth, driven by technological advancements, e-commerce expansion, and increased demand across various sectors. Strategic investments in automation, sustainable materials, and innovative label technologies will be crucial for companies to capitalize on future opportunities. The market's evolution will be shaped by consumer preferences, regulatory changes, and ongoing technological innovations. The focus on sustainability and smart labeling solutions will further drive market expansion and shape the competitive landscape in the years to come.
US Print Label Market Segmentation
-
1. Print Process
- 1.1. Offset Lithography
- 1.2. Gravure
- 1.3. Flexography
- 1.4. Screen
- 1.5. Letterpress
- 1.6. Electrophotography
- 1.7. Inkjet
-
2. Label Format
- 2.1. Wet-glue Labels
- 2.2. Pressure-sensitive Labels
- 2.3. Linerless Labels
- 2.4. Multi-part Tracking Labels
- 2.5. In-mold Labels
- 2.6. Shrink and Stretch Sleeves
-
3. End-user Industry
- 3.1. Food
- 3.2. Beverage
- 3.3. Healthcare
- 3.4. Cosmetics
- 3.5. Household
- 3.6. Industri
- 3.7. Logistics
- 3.8. Other End-user Industries
US Print Label Market Segmentation By Geography
-
1. North America
- 1.1. United States
- 1.2. Canada
- 1.3. Mexico
-
2. South America
- 2.1. Brazil
- 2.2. Argentina
- 2.3. Rest of South America
-
3. Europe
- 3.1. United Kingdom
- 3.2. Germany
- 3.3. France
- 3.4. Italy
- 3.5. Spain
- 3.6. Russia
- 3.7. Benelux
- 3.8. Nordics
- 3.9. Rest of Europe
-
4. Middle East & Africa
- 4.1. Turkey
- 4.2. Israel
- 4.3. GCC
- 4.4. North Africa
- 4.5. South Africa
- 4.6. Rest of Middle East & Africa
-
5. Asia Pacific
- 5.1. China
- 5.2. India
- 5.3. Japan
- 5.4. South Korea
- 5.5. ASEAN
- 5.6. Oceania
- 5.7. Rest of Asia Pacific
US Print Label Market Regional Market Share
Geographic Coverage of US Print Label Market
US Print Label Market REPORT HIGHLIGHTS
| Aspects | Details |
|---|---|
| Study Period | 2020-2034 |
| Base Year | 2025 |
| Estimated Year | 2026 |
| Forecast Period | 2026-2034 |
| Historical Period | 2020-2025 |
| Growth Rate | CAGR of 3.19% from 2020-2034 |
| Segmentation |
|
Table of Contents
- 1. Introduction
- 1.1. Research Scope
- 1.2. Market Segmentation
- 1.3. Research Objective
- 1.4. Definitions and Assumptions
- 2. Executive Summary
- 2.1. Market Snapshot
- 3. Market Dynamics
- 3.1. Market Drivers
- 3.2. Market Restrains
- 3.3. Market Trends
- 3.4. Market Opportunities
- 4. Market Factor Analysis
- 4.1. Porters Five Forces
- 4.1.1. Bargaining Power of Suppliers
- 4.1.2. Bargaining Power of Buyers
- 4.1.3. Threat of New Entrants
- 4.1.4. Threat of Substitutes
- 4.1.5. Competitive Rivalry
- 4.2. PESTEL analysis
- 4.3. BCG Analysis
- 4.3.1. Stars (High Growth, High Market Share)
- 4.3.2. Cash Cows (Low Growth, High Market Share)
- 4.3.3. Question Mark (High Growth, Low Market Share)
- 4.3.4. Dogs (Low Growth, Low Market Share)
- 4.4. Ansoff Matrix Analysis
- 4.5. Supply Chain Analysis
- 4.6. Regulatory Landscape
- 4.7. Current Market Potential and Opportunity Assessment (TAM–SAM–SOM Framework)
- 4.8. PRI Analyst Note
- 4.1. Porters Five Forces
- 5. Market Analysis, Insights and Forecast 2021-2033
- 5.1. Market Analysis, Insights and Forecast - by Print Process
- 5.1.1. Offset Lithography
- 5.1.2. Gravure
- 5.1.3. Flexography
- 5.1.4. Screen
- 5.1.5. Letterpress
- 5.1.6. Electrophotography
- 5.1.7. Inkjet
- 5.2. Market Analysis, Insights and Forecast - by Label Format
- 5.2.1. Wet-glue Labels
- 5.2.2. Pressure-sensitive Labels
- 5.2.3. Linerless Labels
- 5.2.4. Multi-part Tracking Labels
- 5.2.5. In-mold Labels
- 5.2.6. Shrink and Stretch Sleeves
- 5.3. Market Analysis, Insights and Forecast - by End-user Industry
- 5.3.1. Food
- 5.3.2. Beverage
- 5.3.3. Healthcare
- 5.3.4. Cosmetics
- 5.3.5. Household
- 5.3.6. Industri
- 5.3.7. Logistics
- 5.3.8. Other End-user Industries
- 5.4. Market Analysis, Insights and Forecast - by Region
- 5.4.1. North America
- 5.4.2. South America
- 5.4.3. Europe
- 5.4.4. Middle East & Africa
- 5.4.5. Asia Pacific
- 5.1. Market Analysis, Insights and Forecast - by Print Process
- 6. Global US Print Label Market Analysis, Insights and Forecast, 2021-2033
- 6.1. Market Analysis, Insights and Forecast - by Print Process
- 6.1.1. Offset Lithography
- 6.1.2. Gravure
- 6.1.3. Flexography
- 6.1.4. Screen
- 6.1.5. Letterpress
- 6.1.6. Electrophotography
- 6.1.7. Inkjet
- 6.2. Market Analysis, Insights and Forecast - by Label Format
- 6.2.1. Wet-glue Labels
- 6.2.2. Pressure-sensitive Labels
- 6.2.3. Linerless Labels
- 6.2.4. Multi-part Tracking Labels
- 6.2.5. In-mold Labels
- 6.2.6. Shrink and Stretch Sleeves
- 6.3. Market Analysis, Insights and Forecast - by End-user Industry
- 6.3.1. Food
- 6.3.2. Beverage
- 6.3.3. Healthcare
- 6.3.4. Cosmetics
- 6.3.5. Household
- 6.3.6. Industri
- 6.3.7. Logistics
- 6.3.8. Other End-user Industries
- 6.1. Market Analysis, Insights and Forecast - by Print Process
- 7. North America US Print Label Market Analysis, Insights and Forecast, 2020-2032
- 7.1. Market Analysis, Insights and Forecast - by Print Process
- 7.1.1. Offset Lithography
- 7.1.2. Gravure
- 7.1.3. Flexography
- 7.1.4. Screen
- 7.1.5. Letterpress
- 7.1.6. Electrophotography
- 7.1.7. Inkjet
- 7.2. Market Analysis, Insights and Forecast - by Label Format
- 7.2.1. Wet-glue Labels
- 7.2.2. Pressure-sensitive Labels
- 7.2.3. Linerless Labels
- 7.2.4. Multi-part Tracking Labels
- 7.2.5. In-mold Labels
- 7.2.6. Shrink and Stretch Sleeves
- 7.3. Market Analysis, Insights and Forecast - by End-user Industry
- 7.3.1. Food
- 7.3.2. Beverage
- 7.3.3. Healthcare
- 7.3.4. Cosmetics
- 7.3.5. Household
- 7.3.6. Industri
- 7.3.7. Logistics
- 7.3.8. Other End-user Industries
- 7.1. Market Analysis, Insights and Forecast - by Print Process
- 8. South America US Print Label Market Analysis, Insights and Forecast, 2020-2032
- 8.1. Market Analysis, Insights and Forecast - by Print Process
- 8.1.1. Offset Lithography
- 8.1.2. Gravure
- 8.1.3. Flexography
- 8.1.4. Screen
- 8.1.5. Letterpress
- 8.1.6. Electrophotography
- 8.1.7. Inkjet
- 8.2. Market Analysis, Insights and Forecast - by Label Format
- 8.2.1. Wet-glue Labels
- 8.2.2. Pressure-sensitive Labels
- 8.2.3. Linerless Labels
- 8.2.4. Multi-part Tracking Labels
- 8.2.5. In-mold Labels
- 8.2.6. Shrink and Stretch Sleeves
- 8.3. Market Analysis, Insights and Forecast - by End-user Industry
- 8.3.1. Food
- 8.3.2. Beverage
- 8.3.3. Healthcare
- 8.3.4. Cosmetics
- 8.3.5. Household
- 8.3.6. Industri
- 8.3.7. Logistics
- 8.3.8. Other End-user Industries
- 8.1. Market Analysis, Insights and Forecast - by Print Process
- 9. Europe US Print Label Market Analysis, Insights and Forecast, 2020-2032
- 9.1. Market Analysis, Insights and Forecast - by Print Process
- 9.1.1. Offset Lithography
- 9.1.2. Gravure
- 9.1.3. Flexography
- 9.1.4. Screen
- 9.1.5. Letterpress
- 9.1.6. Electrophotography
- 9.1.7. Inkjet
- 9.2. Market Analysis, Insights and Forecast - by Label Format
- 9.2.1. Wet-glue Labels
- 9.2.2. Pressure-sensitive Labels
- 9.2.3. Linerless Labels
- 9.2.4. Multi-part Tracking Labels
- 9.2.5. In-mold Labels
- 9.2.6. Shrink and Stretch Sleeves
- 9.3. Market Analysis, Insights and Forecast - by End-user Industry
- 9.3.1. Food
- 9.3.2. Beverage
- 9.3.3. Healthcare
- 9.3.4. Cosmetics
- 9.3.5. Household
- 9.3.6. Industri
- 9.3.7. Logistics
- 9.3.8. Other End-user Industries
- 9.1. Market Analysis, Insights and Forecast - by Print Process
- 10. Middle East & Africa US Print Label Market Analysis, Insights and Forecast, 2020-2032
- 10.1. Market Analysis, Insights and Forecast - by Print Process
- 10.1.1. Offset Lithography
- 10.1.2. Gravure
- 10.1.3. Flexography
- 10.1.4. Screen
- 10.1.5. Letterpress
- 10.1.6. Electrophotography
- 10.1.7. Inkjet
- 10.2. Market Analysis, Insights and Forecast - by Label Format
- 10.2.1. Wet-glue Labels
- 10.2.2. Pressure-sensitive Labels
- 10.2.3. Linerless Labels
- 10.2.4. Multi-part Tracking Labels
- 10.2.5. In-mold Labels
- 10.2.6. Shrink and Stretch Sleeves
- 10.3. Market Analysis, Insights and Forecast - by End-user Industry
- 10.3.1. Food
- 10.3.2. Beverage
- 10.3.3. Healthcare
- 10.3.4. Cosmetics
- 10.3.5. Household
- 10.3.6. Industri
- 10.3.7. Logistics
- 10.3.8. Other End-user Industries
- 10.1. Market Analysis, Insights and Forecast - by Print Process
- 11. Asia Pacific US Print Label Market Analysis, Insights and Forecast, 2020-2032
- 11.1. Market Analysis, Insights and Forecast - by Print Process
- 11.1.1. Offset Lithography
- 11.1.2. Gravure
- 11.1.3. Flexography
- 11.1.4. Screen
- 11.1.5. Letterpress
- 11.1.6. Electrophotography
- 11.1.7. Inkjet
- 11.2. Market Analysis, Insights and Forecast - by Label Format
- 11.2.1. Wet-glue Labels
- 11.2.2. Pressure-sensitive Labels
- 11.2.3. Linerless Labels
- 11.2.4. Multi-part Tracking Labels
- 11.2.5. In-mold Labels
- 11.2.6. Shrink and Stretch Sleeves
- 11.3. Market Analysis, Insights and Forecast - by End-user Industry
- 11.3.1. Food
- 11.3.2. Beverage
- 11.3.3. Healthcare
- 11.3.4. Cosmetics
- 11.3.5. Household
- 11.3.6. Industri
- 11.3.7. Logistics
- 11.3.8. Other End-user Industries
- 11.1. Market Analysis, Insights and Forecast - by Print Process
- 12. Competitive Analysis
- 12.1. Company Profiles
- 12.1.1 Fort Dearborn
- 12.1.1.1. Company Overview
- 12.1.1.2. Products
- 12.1.1.3. Company Financials
- 12.1.1.4. SWOT Analysis
- 12.1.2 R R Donnelley & Sons Company
- 12.1.2.1. Company Overview
- 12.1.2.2. Products
- 12.1.2.3. Company Financials
- 12.1.2.4. SWOT Analysis
- 12.1.3 Westrock Company
- 12.1.3.1. Company Overview
- 12.1.3.2. Products
- 12.1.3.3. Company Financials
- 12.1.3.4. SWOT Analysis
- 12.1.4 Cenveo Corporation
- 12.1.4.1. Company Overview
- 12.1.4.2. Products
- 12.1.4.3. Company Financials
- 12.1.4.4. SWOT Analysis
- 12.1.5 Mondi Group
- 12.1.5.1. Company Overview
- 12.1.5.2. Products
- 12.1.5.3. Company Financials
- 12.1.5.4. SWOT Analysis
- 12.1.6 Multi Color Corporation
- 12.1.6.1. Company Overview
- 12.1.6.2. Products
- 12.1.6.3. Company Financials
- 12.1.6.4. SWOT Analysis
- 12.1.7 Avery Dennison Corporation
- 12.1.7.1. Company Overview
- 12.1.7.2. Products
- 12.1.7.3. Company Financials
- 12.1.7.4. SWOT Analysis
- 12.1.8 Taylor Corporation*List Not Exhaustive
- 12.1.8.1. Company Overview
- 12.1.8.2. Products
- 12.1.8.3. Company Financials
- 12.1.8.4. SWOT Analysis
- 12.1.9 Ahlstrom-munksjö Oyj
- 12.1.9.1. Company Overview
- 12.1.9.2. Products
- 12.1.9.3. Company Financials
- 12.1.9.4. SWOT Analysis
- 12.1.10 Brady Corporation
- 12.1.10.1. Company Overview
- 12.1.10.2. Products
- 12.1.10.3. Company Financials
- 12.1.10.4. SWOT Analysis
- 12.1.1 Fort Dearborn
- 12.2. Market Entropy
- 12.2.1 Company's Key Areas Served
- 12.2.2 Recent Developments
- 12.3. Company Market Share Analysis 2025
- 12.3.1 Top 5 Companies Market Share Analysis
- 12.3.2 Top 3 Companies Market Share Analysis
- 12.4. List of Potential Customers
- 13. Research Methodology
List of Figures
- Figure 1: Global US Print Label Market Revenue Breakdown (Million, %) by Region 2025 & 2033
- Figure 2: North America US Print Label Market Revenue (Million), by Print Process 2025 & 2033
- Figure 3: North America US Print Label Market Revenue Share (%), by Print Process 2025 & 2033
- Figure 4: North America US Print Label Market Revenue (Million), by Label Format 2025 & 2033
- Figure 5: North America US Print Label Market Revenue Share (%), by Label Format 2025 & 2033
- Figure 6: North America US Print Label Market Revenue (Million), by End-user Industry 2025 & 2033
- Figure 7: North America US Print Label Market Revenue Share (%), by End-user Industry 2025 & 2033
- Figure 8: North America US Print Label Market Revenue (Million), by Country 2025 & 2033
- Figure 9: North America US Print Label Market Revenue Share (%), by Country 2025 & 2033
- Figure 10: South America US Print Label Market Revenue (Million), by Print Process 2025 & 2033
- Figure 11: South America US Print Label Market Revenue Share (%), by Print Process 2025 & 2033
- Figure 12: South America US Print Label Market Revenue (Million), by Label Format 2025 & 2033
- Figure 13: South America US Print Label Market Revenue Share (%), by Label Format 2025 & 2033
- Figure 14: South America US Print Label Market Revenue (Million), by End-user Industry 2025 & 2033
- Figure 15: South America US Print Label Market Revenue Share (%), by End-user Industry 2025 & 2033
- Figure 16: South America US Print Label Market Revenue (Million), by Country 2025 & 2033
- Figure 17: South America US Print Label Market Revenue Share (%), by Country 2025 & 2033
- Figure 18: Europe US Print Label Market Revenue (Million), by Print Process 2025 & 2033
- Figure 19: Europe US Print Label Market Revenue Share (%), by Print Process 2025 & 2033
- Figure 20: Europe US Print Label Market Revenue (Million), by Label Format 2025 & 2033
- Figure 21: Europe US Print Label Market Revenue Share (%), by Label Format 2025 & 2033
- Figure 22: Europe US Print Label Market Revenue (Million), by End-user Industry 2025 & 2033
- Figure 23: Europe US Print Label Market Revenue Share (%), by End-user Industry 2025 & 2033
- Figure 24: Europe US Print Label Market Revenue (Million), by Country 2025 & 2033
- Figure 25: Europe US Print Label Market Revenue Share (%), by Country 2025 & 2033
- Figure 26: Middle East & Africa US Print Label Market Revenue (Million), by Print Process 2025 & 2033
- Figure 27: Middle East & Africa US Print Label Market Revenue Share (%), by Print Process 2025 & 2033
- Figure 28: Middle East & Africa US Print Label Market Revenue (Million), by Label Format 2025 & 2033
- Figure 29: Middle East & Africa US Print Label Market Revenue Share (%), by Label Format 2025 & 2033
- Figure 30: Middle East & Africa US Print Label Market Revenue (Million), by End-user Industry 2025 & 2033
- Figure 31: Middle East & Africa US Print Label Market Revenue Share (%), by End-user Industry 2025 & 2033
- Figure 32: Middle East & Africa US Print Label Market Revenue (Million), by Country 2025 & 2033
- Figure 33: Middle East & Africa US Print Label Market Revenue Share (%), by Country 2025 & 2033
- Figure 34: Asia Pacific US Print Label Market Revenue (Million), by Print Process 2025 & 2033
- Figure 35: Asia Pacific US Print Label Market Revenue Share (%), by Print Process 2025 & 2033
- Figure 36: Asia Pacific US Print Label Market Revenue (Million), by Label Format 2025 & 2033
- Figure 37: Asia Pacific US Print Label Market Revenue Share (%), by Label Format 2025 & 2033
- Figure 38: Asia Pacific US Print Label Market Revenue (Million), by End-user Industry 2025 & 2033
- Figure 39: Asia Pacific US Print Label Market Revenue Share (%), by End-user Industry 2025 & 2033
- Figure 40: Asia Pacific US Print Label Market Revenue (Million), by Country 2025 & 2033
- Figure 41: Asia Pacific US Print Label Market Revenue Share (%), by Country 2025 & 2033
List of Tables
- Table 1: Global US Print Label Market Revenue Million Forecast, by Print Process 2020 & 2033
- Table 2: Global US Print Label Market Revenue Million Forecast, by Label Format 2020 & 2033
- Table 3: Global US Print Label Market Revenue Million Forecast, by End-user Industry 2020 & 2033
- Table 4: Global US Print Label Market Revenue Million Forecast, by Region 2020 & 2033
- Table 5: Global US Print Label Market Revenue Million Forecast, by Print Process 2020 & 2033
- Table 6: Global US Print Label Market Revenue Million Forecast, by Label Format 2020 & 2033
- Table 7: Global US Print Label Market Revenue Million Forecast, by End-user Industry 2020 & 2033
- Table 8: Global US Print Label Market Revenue Million Forecast, by Country 2020 & 2033
- Table 9: United States US Print Label Market Revenue (Million) Forecast, by Application 2020 & 2033
- Table 10: Canada US Print Label Market Revenue (Million) Forecast, by Application 2020 & 2033
- Table 11: Mexico US Print Label Market Revenue (Million) Forecast, by Application 2020 & 2033
- Table 12: Global US Print Label Market Revenue Million Forecast, by Print Process 2020 & 2033
- Table 13: Global US Print Label Market Revenue Million Forecast, by Label Format 2020 & 2033
- Table 14: Global US Print Label Market Revenue Million Forecast, by End-user Industry 2020 & 2033
- Table 15: Global US Print Label Market Revenue Million Forecast, by Country 2020 & 2033
- Table 16: Brazil US Print Label Market Revenue (Million) Forecast, by Application 2020 & 2033
- Table 17: Argentina US Print Label Market Revenue (Million) Forecast, by Application 2020 & 2033
- Table 18: Rest of South America US Print Label Market Revenue (Million) Forecast, by Application 2020 & 2033
- Table 19: Global US Print Label Market Revenue Million Forecast, by Print Process 2020 & 2033
- Table 20: Global US Print Label Market Revenue Million Forecast, by Label Format 2020 & 2033
- Table 21: Global US Print Label Market Revenue Million Forecast, by End-user Industry 2020 & 2033
- Table 22: Global US Print Label Market Revenue Million Forecast, by Country 2020 & 2033
- Table 23: United Kingdom US Print Label Market Revenue (Million) Forecast, by Application 2020 & 2033
- Table 24: Germany US Print Label Market Revenue (Million) Forecast, by Application 2020 & 2033
- Table 25: France US Print Label Market Revenue (Million) Forecast, by Application 2020 & 2033
- Table 26: Italy US Print Label Market Revenue (Million) Forecast, by Application 2020 & 2033
- Table 27: Spain US Print Label Market Revenue (Million) Forecast, by Application 2020 & 2033
- Table 28: Russia US Print Label Market Revenue (Million) Forecast, by Application 2020 & 2033
- Table 29: Benelux US Print Label Market Revenue (Million) Forecast, by Application 2020 & 2033
- Table 30: Nordics US Print Label Market Revenue (Million) Forecast, by Application 2020 & 2033
- Table 31: Rest of Europe US Print Label Market Revenue (Million) Forecast, by Application 2020 & 2033
- Table 32: Global US Print Label Market Revenue Million Forecast, by Print Process 2020 & 2033
- Table 33: Global US Print Label Market Revenue Million Forecast, by Label Format 2020 & 2033
- Table 34: Global US Print Label Market Revenue Million Forecast, by End-user Industry 2020 & 2033
- Table 35: Global US Print Label Market Revenue Million Forecast, by Country 2020 & 2033
- Table 36: Turkey US Print Label Market Revenue (Million) Forecast, by Application 2020 & 2033
- Table 37: Israel US Print Label Market Revenue (Million) Forecast, by Application 2020 & 2033
- Table 38: GCC US Print Label Market Revenue (Million) Forecast, by Application 2020 & 2033
- Table 39: North Africa US Print Label Market Revenue (Million) Forecast, by Application 2020 & 2033
- Table 40: South Africa US Print Label Market Revenue (Million) Forecast, by Application 2020 & 2033
- Table 41: Rest of Middle East & Africa US Print Label Market Revenue (Million) Forecast, by Application 2020 & 2033
- Table 42: Global US Print Label Market Revenue Million Forecast, by Print Process 2020 & 2033
- Table 43: Global US Print Label Market Revenue Million Forecast, by Label Format 2020 & 2033
- Table 44: Global US Print Label Market Revenue Million Forecast, by End-user Industry 2020 & 2033
- Table 45: Global US Print Label Market Revenue Million Forecast, by Country 2020 & 2033
- Table 46: China US Print Label Market Revenue (Million) Forecast, by Application 2020 & 2033
- Table 47: India US Print Label Market Revenue (Million) Forecast, by Application 2020 & 2033
- Table 48: Japan US Print Label Market Revenue (Million) Forecast, by Application 2020 & 2033
- Table 49: South Korea US Print Label Market Revenue (Million) Forecast, by Application 2020 & 2033
- Table 50: ASEAN US Print Label Market Revenue (Million) Forecast, by Application 2020 & 2033
- Table 51: Oceania US Print Label Market Revenue (Million) Forecast, by Application 2020 & 2033
- Table 52: Rest of Asia Pacific US Print Label Market Revenue (Million) Forecast, by Application 2020 & 2033
Frequently Asked Questions
1. What is the projected Compound Annual Growth Rate (CAGR) of the US Print Label Market?
The projected CAGR is approximately 3.19%.
2. Which companies are prominent players in the US Print Label Market?
Key companies in the market include Fort Dearborn, R R Donnelley & Sons Company, Westrock Company, Cenveo Corporation, Mondi Group, Multi Color Corporation, Avery Dennison Corporation, Taylor Corporation*List Not Exhaustive, Ahlstrom-munksjö Oyj, Brady Corporation.
3. What are the main segments of the US Print Label Market?
The market segments include Print Process, Label Format, End-user Industry.
4. Can you provide details about the market size?
The market size is estimated to be USD 7.13 Million as of 2022.
5. What are some drivers contributing to market growth?
Growing Demand for Labels Manufactured with Digital Print Technologies; High Adoption From Healthcare and Cosmetics Segment.
6. What are the notable trends driving market growth?
Pressure-sensitive Labels Accounts for the Largest Market Share.
7. Are there any restraints impacting market growth?
Lack of Products with Ability to Withstand Harsh Climatic Conditions.
8. Can you provide examples of recent developments in the market?
March 2021 - Avery Dennison Corporation acquired JDC Solutions, Inc., a privately-held manufacturer of pressure-sensitive specialty tapes in Mount Juliet, Tennessee, at USD 24 million. JDC's manufacturing operations, workforce, and product portfolio will become part of Avery Dennison's Performance Tapes North America business.
9. What pricing options are available for accessing the report?
Pricing options include single-user, multi-user, and enterprise licenses priced at USD 3800, USD 4500, and USD 5800 respectively.
10. Is the market size provided in terms of value or volume?
The market size is provided in terms of value, measured in Million.
11. Are there any specific market keywords associated with the report?
Yes, the market keyword associated with the report is "US Print Label Market," which aids in identifying and referencing the specific market segment covered.
12. How do I determine which pricing option suits my needs best?
The pricing options vary based on user requirements and access needs. Individual users may opt for single-user licenses, while businesses requiring broader access may choose multi-user or enterprise licenses for cost-effective access to the report.
13. Are there any additional resources or data provided in the US Print Label Market report?
While the report offers comprehensive insights, it's advisable to review the specific contents or supplementary materials provided to ascertain if additional resources or data are available.
14. How can I stay updated on further developments or reports in the US Print Label Market?
To stay informed about further developments, trends, and reports in the US Print Label Market, consider subscribing to industry newsletters, following relevant companies and organizations, or regularly checking reputable industry news sources and publications.
Methodology
Step 1 - Identification of Relevant Samples Size from Population Database


Step 2 - Approaches for Defining Global Market Size (Value, Volume* & Price*)

Note*: In applicable scenarios
Step 3 - Data Sources
Primary Research
- Web Analytics
- Survey Reports
- Research Institute
- Latest Research Reports
- Opinion Leaders
Secondary Research
- Annual Reports
- White Paper
- Latest Press Release
- Industry Association
- Paid Database
- Investor Presentations

Step 4 - Data Triangulation
Involves using different sources of information in order to increase the validity of a study
These sources are likely to be stakeholders in a program - participants, other researchers, program staff, other community members, and so on.
Then we put all data in single framework & apply various statistical tools to find out the dynamic on the market.
During the analysis stage, feedback from the stakeholder groups would be compared to determine areas of agreement as well as areas of divergence