
Key Insights
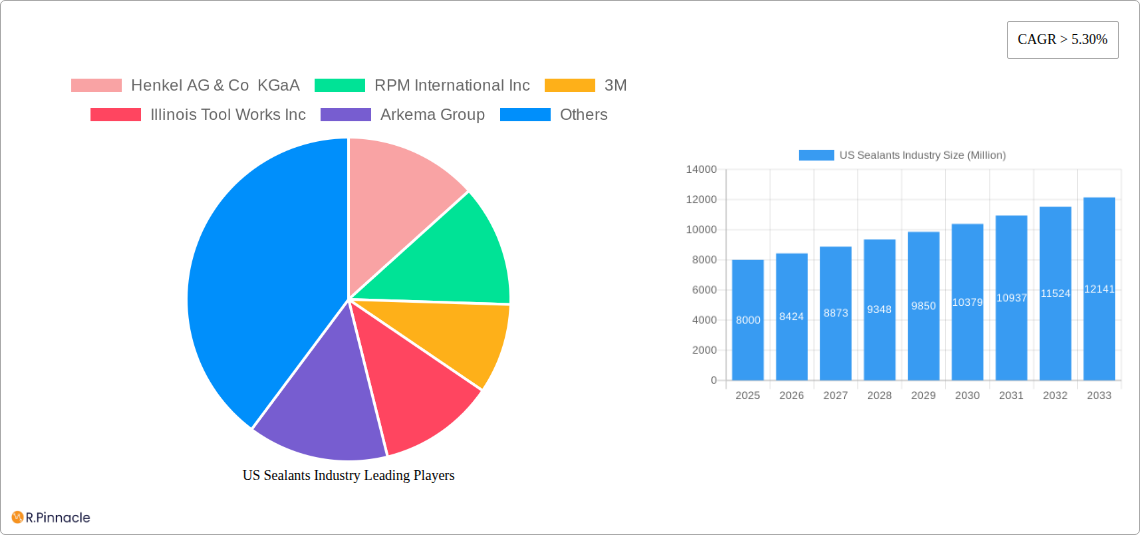
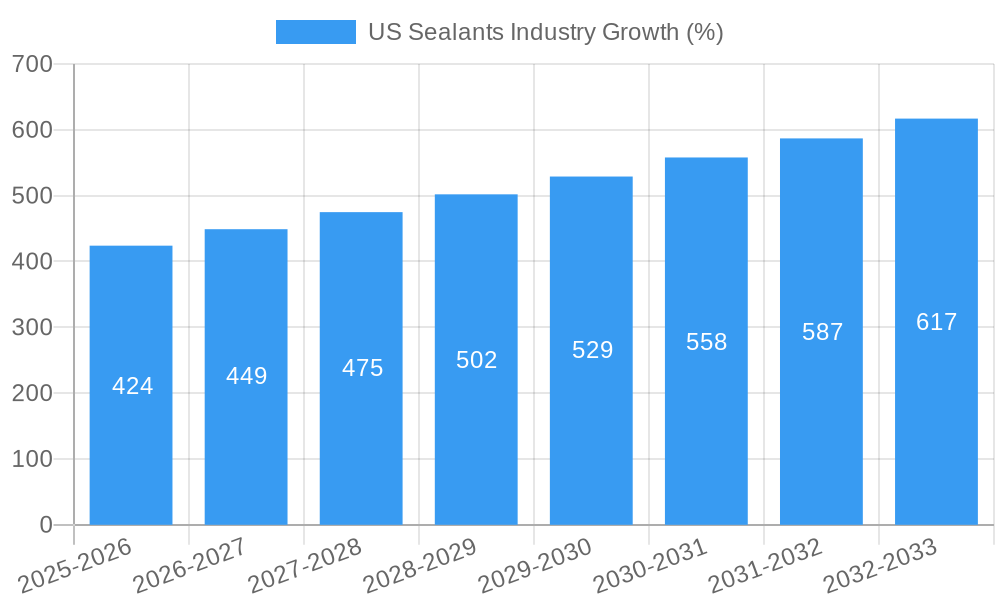
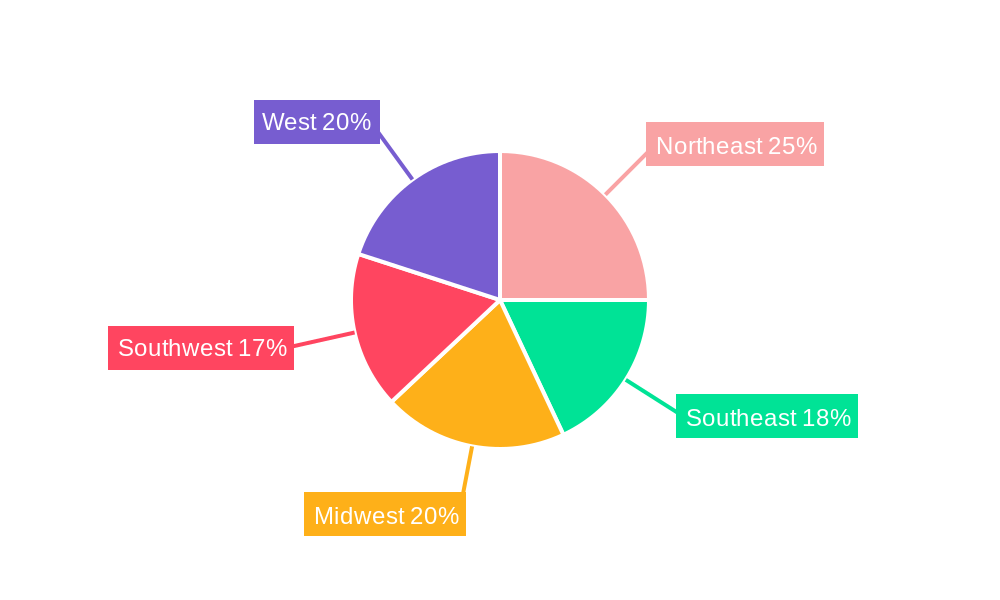
The US sealants market, valued at approximately $8 billion in 2025, is projected to experience robust growth, exceeding a 5.3% CAGR through 2033. This expansion is fueled by several key drivers. The burgeoning construction industry, particularly in residential and commercial sectors across regions like the Northeast and West, significantly boosts demand. Furthermore, the increasing adoption of sealants in automotive manufacturing, driven by lightweighting trends and enhanced vehicle durability requirements, contributes substantially. The aerospace industry's reliance on high-performance sealants for aircraft and spacecraft assembly further propels market growth. Technological advancements leading to improved sealant properties, such as enhanced durability, flexibility, and environmental friendliness (e.g., low-VOC options), are also significant factors. The increasing preference for energy-efficient buildings, requiring superior sealing solutions for insulation and weatherproofing, further fuels market expansion. While raw material price fluctuations and potential economic downturns pose some constraints, the overall market outlook remains positive, driven by the aforementioned factors and strong demand across various end-use sectors.
Market segmentation reveals a diversified landscape. Acrylic sealants hold a significant market share due to their cost-effectiveness and versatility across applications. Epoxy and polyurethane sealants are favored in high-performance applications demanding superior strength and durability, prevalent in aerospace and automotive sectors. Silicone sealants, known for their excellent weather resistance, are widely used in construction and building applications. The “Other Resins” category encompasses specialized sealants tailored for niche applications. Geographic distribution indicates strong market concentration in the West and Northeast due to significant construction activities and industrial hubs. Competition is intense, with major players like Henkel, 3M, and Dow dominating the market through their extensive product portfolios and established distribution networks. Smaller, specialized companies focus on niche segments, offering tailored solutions and contributing to the market’s diversity.
US Sealants Industry Market Report: 2019-2033
This comprehensive report provides an in-depth analysis of the US sealants industry, offering valuable insights for industry professionals, investors, and strategic decision-makers. The study period covers 2019-2033, with 2025 as the base year and a forecast period extending to 2033. The report segments the market by key end-user industries (Aerospace, Automotive, Building & Construction, Healthcare, Other) and resin types (Acrylic, Epoxy, Polyurethane, Silicone, Other), providing a granular understanding of market dynamics and growth potential. The report also profiles leading players like Henkel AG & Co KGaA, RPM International Inc, 3M, Illinois Tool Works Inc, Arkema Group, Dow, H B Fuller Company, Sika A, MAPEI S p A, and Pecora Corporation, analyzing their market share, strategies, and recent activities. Expect detailed analysis of market size (in Millions), CAGR, and key trends driving future growth.
US Sealants Industry Market Structure & Innovation Trends
The US sealants market exhibits a moderately concentrated structure, with the top 10 players holding an estimated xx% market share in 2025. Innovation is driven by the increasing demand for high-performance, specialized sealants across diverse end-user industries. Stringent environmental regulations and the need for sustainable solutions are also shaping innovation. The market is witnessing significant M&A activity, with notable transactions including RPM International Inc.'s expansion and Sika AG's acquisition of Hamatite. These activities underscore the industry's consolidation and efforts to expand product portfolios and geographical reach.
- Market Concentration: Top 10 players hold xx% market share (2025).
- Innovation Drivers: Demand for high-performance sealants, sustainable materials, and stringent environmental regulations.
- Regulatory Framework: EPA regulations and industry-specific standards influence product development and manufacturing.
- Product Substitutes: Competition from alternative materials like tapes and adhesives.
- M&A Activity: Significant acquisitions aimed at expanding market reach and product lines (e.g., RPM International Inc.'s facility expansion, Sika AG's acquisition of Hamatite). Estimated total M&A deal value in the past five years: $xx Million.
US Sealants Industry Market Dynamics & Trends
The US sealants market is projected to experience robust growth, with a CAGR of xx% during the forecast period (2025-2033). Growth is fueled by several factors including the booming construction industry, rising demand for automobiles, and increasing aerospace activities. Technological advancements, such as the development of advanced materials with enhanced properties (e.g., improved durability, temperature resistance, and adhesion), are driving market expansion. Consumer preferences are shifting towards environmentally friendly and high-performance sealants, prompting manufacturers to innovate in this direction. Competitive dynamics are characterized by intense rivalry among established players and emerging entrants, leading to product diversification and pricing strategies. Market penetration of advanced sealants is expected to increase by xx% by 2033.
Dominant Regions & Segments in US Sealants Industry
The Building and Construction segment holds the largest market share within the US sealants industry, driven by robust infrastructure development and residential construction activities. Geographically, the xx region dominates, benefiting from strong economic growth and favorable government policies.
- Leading End-User Industry: Building and Construction (xx% market share in 2025) – Key Drivers: Government infrastructure projects, residential construction boom.
- Leading Resin Type: Silicone (xx% market share in 2025) – Key Drivers: Superior performance characteristics, durability, and resistance to extreme weather conditions.
- Leading Region: xx (xx% market share in 2025) – Key Drivers: Strong economic growth, favorable construction policies.
US Sealants Industry Product Innovations
Recent years have witnessed significant product innovations in the US sealants market, focusing on enhanced performance characteristics, sustainability, and ease of application. Manufacturers are introducing sealants with improved durability, weather resistance, and adhesion properties. Bio-based and low-VOC sealants are gaining traction, driven by environmental concerns. These innovations are improving the overall value proposition for end-users, expanding market applications, and driving market growth.
Report Scope & Segmentation Analysis
This report comprehensively segments the US sealants market by both end-user industry and resin type. Each segment presents detailed analysis on market size, growth projections, and competitive dynamics. Growth rates vary across segments, with the Building & Construction sector projected to see the highest growth during the forecast period. Market size projections for each segment are provided for the historical period (2019-2024), base year (2025), and forecast period (2025-2033). Competitive landscape analysis for each segment includes leading players and their market strategies.
Key Drivers of US Sealants Industry Growth
The US sealants market's growth is primarily driven by strong demand from the construction and automotive industries. Government initiatives promoting infrastructure development and increased investments in renewable energy projects are further boosting demand. Technological advancements in sealant formulations are also contributing to the market's expansion. The increasing preference for high-performance and sustainable sealants is shaping market trends.
Challenges in the US Sealants Industry Sector
The US sealants industry faces challenges like fluctuating raw material prices, supply chain disruptions, and intense competition. Stringent environmental regulations also necessitate significant investments in research and development of eco-friendly sealants. These factors can impact profitability and constrain growth if not effectively managed.
Emerging Opportunities in US Sealants Industry
The increasing adoption of green building practices presents significant opportunities for manufacturers of eco-friendly sealants. The growth of the aerospace and healthcare sectors is also creating new demand for specialized sealants with advanced properties. Expansion into emerging markets and strategic partnerships are key to capturing these opportunities.
Leading Players in the US Sealants Industry Market
- Henkel AG & Co KGaA
- RPM International Inc
- 3M
- Illinois Tool Works Inc
- Arkema Group
- Dow
- H B Fuller Company
- Sika A
- MAPEI S p A
- Pecora Corporation
Key Developments in US Sealants Industry Industry
- July 2021: RPM International Inc. expanded its manufacturing capacity with a new 178,000-square-foot facility in Texas, strengthening its supply chain and ability to meet growing customer demand.
- April 2021: Sika AG acquired Hamatite, expanding its presence in the automotive and construction sealants markets with polyurethane, hot melt, and modified silicone technologies.
- January 2020: H.B. Fuller Company launched a new line of Gorilla professional-grade adhesives and sealants targeting the MRO industrial sector.
Future Outlook for US Sealants Industry Market
The US sealants market is poised for continued growth driven by sustained demand from key end-use sectors, technological advancements resulting in improved product performance and sustainability, and supportive government policies. Strategic partnerships, investments in R&D, and expansion into new geographical markets will be crucial for players to capitalize on future growth opportunities.
US Sealants Industry Segmentation
-
1. End User Industry
- 1.1. Aerospace
- 1.2. Automotive
- 1.3. Building and Construction
- 1.4. Healthcare
- 1.5. Other End-user Industries
-
2. Resin
- 2.1. Acrylic
- 2.2. Epoxy
- 2.3. Polyurethane
- 2.4. Silicone
- 2.5. Other Resins
US Sealants Industry Segmentation By Geography
-
1. North America
- 1.1. United States
- 1.2. Canada
- 1.3. Mexico
-
2. South America
- 2.1. Brazil
- 2.2. Argentina
- 2.3. Rest of South America
-
3. Europe
- 3.1. United Kingdom
- 3.2. Germany
- 3.3. France
- 3.4. Italy
- 3.5. Spain
- 3.6. Russia
- 3.7. Benelux
- 3.8. Nordics
- 3.9. Rest of Europe
-
4. Middle East & Africa
- 4.1. Turkey
- 4.2. Israel
- 4.3. GCC
- 4.4. North Africa
- 4.5. South Africa
- 4.6. Rest of Middle East & Africa
-
5. Asia Pacific
- 5.1. China
- 5.2. India
- 5.3. Japan
- 5.4. South Korea
- 5.5. ASEAN
- 5.6. Oceania
- 5.7. Rest of Asia Pacific
US Sealants Industry REPORT HIGHLIGHTS
| Aspects | Details |
|---|---|
| Study Period | 2019-2033 |
| Base Year | 2024 |
| Estimated Year | 2025 |
| Forecast Period | 2025-2033 |
| Historical Period | 2019-2024 |
| Growth Rate | CAGR of > 5.30% from 2019-2033 |
| Segmentation |
|
Table of Contents
- 1. Introduction
- 1.1. Research Scope
- 1.2. Market Segmentation
- 1.3. Research Methodology
- 1.4. Definitions and Assumptions
- 2. Executive Summary
- 2.1. Introduction
- 3. Market Dynamics
- 3.1. Introduction
- 3.2. Market Drivers
- 3.2.1. Rising Demand from the Construction Industry in Saudi Arabia; Other Drivers
- 3.3. Market Restrains
- 3.3.1. ; Impact of COVID-19 Pandemic on Global Economy
- 3.4. Market Trends
- 3.4.1. OTHER KEY INDUSTRY TRENDS COVERED IN THE REPORT
- 4. Market Factor Analysis
- 4.1. Porters Five Forces
- 4.2. Supply/Value Chain
- 4.3. PESTEL analysis
- 4.4. Market Entropy
- 4.5. Patent/Trademark Analysis
- 5. Global US Sealants Industry Analysis, Insights and Forecast, 2019-2031
- 5.1. Market Analysis, Insights and Forecast - by End User Industry
- 5.1.1. Aerospace
- 5.1.2. Automotive
- 5.1.3. Building and Construction
- 5.1.4. Healthcare
- 5.1.5. Other End-user Industries
- 5.2. Market Analysis, Insights and Forecast - by Resin
- 5.2.1. Acrylic
- 5.2.2. Epoxy
- 5.2.3. Polyurethane
- 5.2.4. Silicone
- 5.2.5. Other Resins
- 5.3. Market Analysis, Insights and Forecast - by Region
- 5.3.1. North America
- 5.3.2. South America
- 5.3.3. Europe
- 5.3.4. Middle East & Africa
- 5.3.5. Asia Pacific
- 5.1. Market Analysis, Insights and Forecast - by End User Industry
- 6. North America US Sealants Industry Analysis, Insights and Forecast, 2019-2031
- 6.1. Market Analysis, Insights and Forecast - by End User Industry
- 6.1.1. Aerospace
- 6.1.2. Automotive
- 6.1.3. Building and Construction
- 6.1.4. Healthcare
- 6.1.5. Other End-user Industries
- 6.2. Market Analysis, Insights and Forecast - by Resin
- 6.2.1. Acrylic
- 6.2.2. Epoxy
- 6.2.3. Polyurethane
- 6.2.4. Silicone
- 6.2.5. Other Resins
- 6.1. Market Analysis, Insights and Forecast - by End User Industry
- 7. South America US Sealants Industry Analysis, Insights and Forecast, 2019-2031
- 7.1. Market Analysis, Insights and Forecast - by End User Industry
- 7.1.1. Aerospace
- 7.1.2. Automotive
- 7.1.3. Building and Construction
- 7.1.4. Healthcare
- 7.1.5. Other End-user Industries
- 7.2. Market Analysis, Insights and Forecast - by Resin
- 7.2.1. Acrylic
- 7.2.2. Epoxy
- 7.2.3. Polyurethane
- 7.2.4. Silicone
- 7.2.5. Other Resins
- 7.1. Market Analysis, Insights and Forecast - by End User Industry
- 8. Europe US Sealants Industry Analysis, Insights and Forecast, 2019-2031
- 8.1. Market Analysis, Insights and Forecast - by End User Industry
- 8.1.1. Aerospace
- 8.1.2. Automotive
- 8.1.3. Building and Construction
- 8.1.4. Healthcare
- 8.1.5. Other End-user Industries
- 8.2. Market Analysis, Insights and Forecast - by Resin
- 8.2.1. Acrylic
- 8.2.2. Epoxy
- 8.2.3. Polyurethane
- 8.2.4. Silicone
- 8.2.5. Other Resins
- 8.1. Market Analysis, Insights and Forecast - by End User Industry
- 9. Middle East & Africa US Sealants Industry Analysis, Insights and Forecast, 2019-2031
- 9.1. Market Analysis, Insights and Forecast - by End User Industry
- 9.1.1. Aerospace
- 9.1.2. Automotive
- 9.1.3. Building and Construction
- 9.1.4. Healthcare
- 9.1.5. Other End-user Industries
- 9.2. Market Analysis, Insights and Forecast - by Resin
- 9.2.1. Acrylic
- 9.2.2. Epoxy
- 9.2.3. Polyurethane
- 9.2.4. Silicone
- 9.2.5. Other Resins
- 9.1. Market Analysis, Insights and Forecast - by End User Industry
- 10. Asia Pacific US Sealants Industry Analysis, Insights and Forecast, 2019-2031
- 10.1. Market Analysis, Insights and Forecast - by End User Industry
- 10.1.1. Aerospace
- 10.1.2. Automotive
- 10.1.3. Building and Construction
- 10.1.4. Healthcare
- 10.1.5. Other End-user Industries
- 10.2. Market Analysis, Insights and Forecast - by Resin
- 10.2.1. Acrylic
- 10.2.2. Epoxy
- 10.2.3. Polyurethane
- 10.2.4. Silicone
- 10.2.5. Other Resins
- 10.1. Market Analysis, Insights and Forecast - by End User Industry
- 11. Northeast US Sealants Industry Analysis, Insights and Forecast, 2019-2031
- 12. Southeast US Sealants Industry Analysis, Insights and Forecast, 2019-2031
- 13. Midwest US Sealants Industry Analysis, Insights and Forecast, 2019-2031
- 14. Southwest US Sealants Industry Analysis, Insights and Forecast, 2019-2031
- 15. West US Sealants Industry Analysis, Insights and Forecast, 2019-2031
- 16. Competitive Analysis
- 16.1. Global Market Share Analysis 2024
- 16.2. Company Profiles
- 16.2.1 Henkel AG & Co KGaA
- 16.2.1.1. Overview
- 16.2.1.2. Products
- 16.2.1.3. SWOT Analysis
- 16.2.1.4. Recent Developments
- 16.2.1.5. Financials (Based on Availability)
- 16.2.2 RPM International Inc
- 16.2.2.1. Overview
- 16.2.2.2. Products
- 16.2.2.3. SWOT Analysis
- 16.2.2.4. Recent Developments
- 16.2.2.5. Financials (Based on Availability)
- 16.2.3 3M
- 16.2.3.1. Overview
- 16.2.3.2. Products
- 16.2.3.3. SWOT Analysis
- 16.2.3.4. Recent Developments
- 16.2.3.5. Financials (Based on Availability)
- 16.2.4 Illinois Tool Works Inc
- 16.2.4.1. Overview
- 16.2.4.2. Products
- 16.2.4.3. SWOT Analysis
- 16.2.4.4. Recent Developments
- 16.2.4.5. Financials (Based on Availability)
- 16.2.5 Arkema Group
- 16.2.5.1. Overview
- 16.2.5.2. Products
- 16.2.5.3. SWOT Analysis
- 16.2.5.4. Recent Developments
- 16.2.5.5. Financials (Based on Availability)
- 16.2.6 Dow
- 16.2.6.1. Overview
- 16.2.6.2. Products
- 16.2.6.3. SWOT Analysis
- 16.2.6.4. Recent Developments
- 16.2.6.5. Financials (Based on Availability)
- 16.2.7 H B Fuller Company
- 16.2.7.1. Overview
- 16.2.7.2. Products
- 16.2.7.3. SWOT Analysis
- 16.2.7.4. Recent Developments
- 16.2.7.5. Financials (Based on Availability)
- 16.2.8 Sika A
- 16.2.8.1. Overview
- 16.2.8.2. Products
- 16.2.8.3. SWOT Analysis
- 16.2.8.4. Recent Developments
- 16.2.8.5. Financials (Based on Availability)
- 16.2.9 MAPEI S p A
- 16.2.9.1. Overview
- 16.2.9.2. Products
- 16.2.9.3. SWOT Analysis
- 16.2.9.4. Recent Developments
- 16.2.9.5. Financials (Based on Availability)
- 16.2.10 Pecora Corporation
- 16.2.10.1. Overview
- 16.2.10.2. Products
- 16.2.10.3. SWOT Analysis
- 16.2.10.4. Recent Developments
- 16.2.10.5. Financials (Based on Availability)
- 16.2.1 Henkel AG & Co KGaA
List of Figures
- Figure 1: Global US Sealants Industry Revenue Breakdown (Million, %) by Region 2024 & 2032
- Figure 2: United states US Sealants Industry Revenue (Million), by Country 2024 & 2032
- Figure 3: United states US Sealants Industry Revenue Share (%), by Country 2024 & 2032
- Figure 4: North America US Sealants Industry Revenue (Million), by End User Industry 2024 & 2032
- Figure 5: North America US Sealants Industry Revenue Share (%), by End User Industry 2024 & 2032
- Figure 6: North America US Sealants Industry Revenue (Million), by Resin 2024 & 2032
- Figure 7: North America US Sealants Industry Revenue Share (%), by Resin 2024 & 2032
- Figure 8: North America US Sealants Industry Revenue (Million), by Country 2024 & 2032
- Figure 9: North America US Sealants Industry Revenue Share (%), by Country 2024 & 2032
- Figure 10: South America US Sealants Industry Revenue (Million), by End User Industry 2024 & 2032
- Figure 11: South America US Sealants Industry Revenue Share (%), by End User Industry 2024 & 2032
- Figure 12: South America US Sealants Industry Revenue (Million), by Resin 2024 & 2032
- Figure 13: South America US Sealants Industry Revenue Share (%), by Resin 2024 & 2032
- Figure 14: South America US Sealants Industry Revenue (Million), by Country 2024 & 2032
- Figure 15: South America US Sealants Industry Revenue Share (%), by Country 2024 & 2032
- Figure 16: Europe US Sealants Industry Revenue (Million), by End User Industry 2024 & 2032
- Figure 17: Europe US Sealants Industry Revenue Share (%), by End User Industry 2024 & 2032
- Figure 18: Europe US Sealants Industry Revenue (Million), by Resin 2024 & 2032
- Figure 19: Europe US Sealants Industry Revenue Share (%), by Resin 2024 & 2032
- Figure 20: Europe US Sealants Industry Revenue (Million), by Country 2024 & 2032
- Figure 21: Europe US Sealants Industry Revenue Share (%), by Country 2024 & 2032
- Figure 22: Middle East & Africa US Sealants Industry Revenue (Million), by End User Industry 2024 & 2032
- Figure 23: Middle East & Africa US Sealants Industry Revenue Share (%), by End User Industry 2024 & 2032
- Figure 24: Middle East & Africa US Sealants Industry Revenue (Million), by Resin 2024 & 2032
- Figure 25: Middle East & Africa US Sealants Industry Revenue Share (%), by Resin 2024 & 2032
- Figure 26: Middle East & Africa US Sealants Industry Revenue (Million), by Country 2024 & 2032
- Figure 27: Middle East & Africa US Sealants Industry Revenue Share (%), by Country 2024 & 2032
- Figure 28: Asia Pacific US Sealants Industry Revenue (Million), by End User Industry 2024 & 2032
- Figure 29: Asia Pacific US Sealants Industry Revenue Share (%), by End User Industry 2024 & 2032
- Figure 30: Asia Pacific US Sealants Industry Revenue (Million), by Resin 2024 & 2032
- Figure 31: Asia Pacific US Sealants Industry Revenue Share (%), by Resin 2024 & 2032
- Figure 32: Asia Pacific US Sealants Industry Revenue (Million), by Country 2024 & 2032
- Figure 33: Asia Pacific US Sealants Industry Revenue Share (%), by Country 2024 & 2032
List of Tables
- Table 1: Global US Sealants Industry Revenue Million Forecast, by Region 2019 & 2032
- Table 2: Global US Sealants Industry Revenue Million Forecast, by End User Industry 2019 & 2032
- Table 3: Global US Sealants Industry Revenue Million Forecast, by Resin 2019 & 2032
- Table 4: Global US Sealants Industry Revenue Million Forecast, by Region 2019 & 2032
- Table 5: Global US Sealants Industry Revenue Million Forecast, by Country 2019 & 2032
- Table 6: Northeast US Sealants Industry Revenue (Million) Forecast, by Application 2019 & 2032
- Table 7: Southeast US Sealants Industry Revenue (Million) Forecast, by Application 2019 & 2032
- Table 8: Midwest US Sealants Industry Revenue (Million) Forecast, by Application 2019 & 2032
- Table 9: Southwest US Sealants Industry Revenue (Million) Forecast, by Application 2019 & 2032
- Table 10: West US Sealants Industry Revenue (Million) Forecast, by Application 2019 & 2032
- Table 11: Global US Sealants Industry Revenue Million Forecast, by End User Industry 2019 & 2032
- Table 12: Global US Sealants Industry Revenue Million Forecast, by Resin 2019 & 2032
- Table 13: Global US Sealants Industry Revenue Million Forecast, by Country 2019 & 2032
- Table 14: United States US Sealants Industry Revenue (Million) Forecast, by Application 2019 & 2032
- Table 15: Canada US Sealants Industry Revenue (Million) Forecast, by Application 2019 & 2032
- Table 16: Mexico US Sealants Industry Revenue (Million) Forecast, by Application 2019 & 2032
- Table 17: Global US Sealants Industry Revenue Million Forecast, by End User Industry 2019 & 2032
- Table 18: Global US Sealants Industry Revenue Million Forecast, by Resin 2019 & 2032
- Table 19: Global US Sealants Industry Revenue Million Forecast, by Country 2019 & 2032
- Table 20: Brazil US Sealants Industry Revenue (Million) Forecast, by Application 2019 & 2032
- Table 21: Argentina US Sealants Industry Revenue (Million) Forecast, by Application 2019 & 2032
- Table 22: Rest of South America US Sealants Industry Revenue (Million) Forecast, by Application 2019 & 2032
- Table 23: Global US Sealants Industry Revenue Million Forecast, by End User Industry 2019 & 2032
- Table 24: Global US Sealants Industry Revenue Million Forecast, by Resin 2019 & 2032
- Table 25: Global US Sealants Industry Revenue Million Forecast, by Country 2019 & 2032
- Table 26: United Kingdom US Sealants Industry Revenue (Million) Forecast, by Application 2019 & 2032
- Table 27: Germany US Sealants Industry Revenue (Million) Forecast, by Application 2019 & 2032
- Table 28: France US Sealants Industry Revenue (Million) Forecast, by Application 2019 & 2032
- Table 29: Italy US Sealants Industry Revenue (Million) Forecast, by Application 2019 & 2032
- Table 30: Spain US Sealants Industry Revenue (Million) Forecast, by Application 2019 & 2032
- Table 31: Russia US Sealants Industry Revenue (Million) Forecast, by Application 2019 & 2032
- Table 32: Benelux US Sealants Industry Revenue (Million) Forecast, by Application 2019 & 2032
- Table 33: Nordics US Sealants Industry Revenue (Million) Forecast, by Application 2019 & 2032
- Table 34: Rest of Europe US Sealants Industry Revenue (Million) Forecast, by Application 2019 & 2032
- Table 35: Global US Sealants Industry Revenue Million Forecast, by End User Industry 2019 & 2032
- Table 36: Global US Sealants Industry Revenue Million Forecast, by Resin 2019 & 2032
- Table 37: Global US Sealants Industry Revenue Million Forecast, by Country 2019 & 2032
- Table 38: Turkey US Sealants Industry Revenue (Million) Forecast, by Application 2019 & 2032
- Table 39: Israel US Sealants Industry Revenue (Million) Forecast, by Application 2019 & 2032
- Table 40: GCC US Sealants Industry Revenue (Million) Forecast, by Application 2019 & 2032
- Table 41: North Africa US Sealants Industry Revenue (Million) Forecast, by Application 2019 & 2032
- Table 42: South Africa US Sealants Industry Revenue (Million) Forecast, by Application 2019 & 2032
- Table 43: Rest of Middle East & Africa US Sealants Industry Revenue (Million) Forecast, by Application 2019 & 2032
- Table 44: Global US Sealants Industry Revenue Million Forecast, by End User Industry 2019 & 2032
- Table 45: Global US Sealants Industry Revenue Million Forecast, by Resin 2019 & 2032
- Table 46: Global US Sealants Industry Revenue Million Forecast, by Country 2019 & 2032
- Table 47: China US Sealants Industry Revenue (Million) Forecast, by Application 2019 & 2032
- Table 48: India US Sealants Industry Revenue (Million) Forecast, by Application 2019 & 2032
- Table 49: Japan US Sealants Industry Revenue (Million) Forecast, by Application 2019 & 2032
- Table 50: South Korea US Sealants Industry Revenue (Million) Forecast, by Application 2019 & 2032
- Table 51: ASEAN US Sealants Industry Revenue (Million) Forecast, by Application 2019 & 2032
- Table 52: Oceania US Sealants Industry Revenue (Million) Forecast, by Application 2019 & 2032
- Table 53: Rest of Asia Pacific US Sealants Industry Revenue (Million) Forecast, by Application 2019 & 2032
Frequently Asked Questions
1. What is the projected Compound Annual Growth Rate (CAGR) of the US Sealants Industry?
The projected CAGR is approximately > 5.30%.
2. Which companies are prominent players in the US Sealants Industry?
Key companies in the market include Henkel AG & Co KGaA, RPM International Inc, 3M, Illinois Tool Works Inc, Arkema Group, Dow, H B Fuller Company, Sika A, MAPEI S p A, Pecora Corporation.
3. What are the main segments of the US Sealants Industry?
The market segments include End User Industry, Resin.
4. Can you provide details about the market size?
The market size is estimated to be USD XX Million as of 2022.
5. What are some drivers contributing to market growth?
Rising Demand from the Construction Industry in Saudi Arabia; Other Drivers.
6. What are the notable trends driving market growth?
OTHER KEY INDUSTRY TRENDS COVERED IN THE REPORT.
7. Are there any restraints impacting market growth?
; Impact of COVID-19 Pandemic on Global Economy.
8. Can you provide examples of recent developments in the market?
July 2021: RPM International Inc. procured a 178,000-square-foot chemical manufacturing facility in Texas to act as a manufacturing campus, owned and operated by RPM’s Tremco Construction Products Group, to meet customer demand and strengthen its supply chain.April 2021: Sika AG signed an agreement to acquire The Yokohama Rubber Co. Ltd's adhesives division, Hamatite, based in Japan. Hamatite offers polyurethanes, hot melts, and modified silicones technology adhesives and sealants for the automotive and construction industries.January 2020: H.B. Fuller Company introduced a new range of Gorilla professional-grade adhesives and sealants for MRO industrial applications.
9. What pricing options are available for accessing the report?
Pricing options include single-user, multi-user, and enterprise licenses priced at USD 3800, USD 4500, and USD 5800 respectively.
10. Is the market size provided in terms of value or volume?
The market size is provided in terms of value, measured in Million.
11. Are there any specific market keywords associated with the report?
Yes, the market keyword associated with the report is "US Sealants Industry," which aids in identifying and referencing the specific market segment covered.
12. How do I determine which pricing option suits my needs best?
The pricing options vary based on user requirements and access needs. Individual users may opt for single-user licenses, while businesses requiring broader access may choose multi-user or enterprise licenses for cost-effective access to the report.
13. Are there any additional resources or data provided in the US Sealants Industry report?
While the report offers comprehensive insights, it's advisable to review the specific contents or supplementary materials provided to ascertain if additional resources or data are available.
14. How can I stay updated on further developments or reports in the US Sealants Industry?
To stay informed about further developments, trends, and reports in the US Sealants Industry, consider subscribing to industry newsletters, following relevant companies and organizations, or regularly checking reputable industry news sources and publications.
Methodology
Step 1 - Identification of Relevant Samples Size from Population Database


Step 2 - Approaches for Defining Global Market Size (Value, Volume* & Price*)

Note*: In applicable scenarios
Step 3 - Data Sources
Primary Research
- Web Analytics
- Survey Reports
- Research Institute
- Latest Research Reports
- Opinion Leaders
Secondary Research
- Annual Reports
- White Paper
- Latest Press Release
- Industry Association
- Paid Database
- Investor Presentations

Step 4 - Data Triangulation
Involves using different sources of information in order to increase the validity of a study
These sources are likely to be stakeholders in a program - participants, other researchers, program staff, other community members, and so on.
Then we put all data in single framework & apply various statistical tools to find out the dynamic on the market.
During the analysis stage, feedback from the stakeholder groups would be compared to determine areas of agreement as well as areas of divergence


