

Key Insights
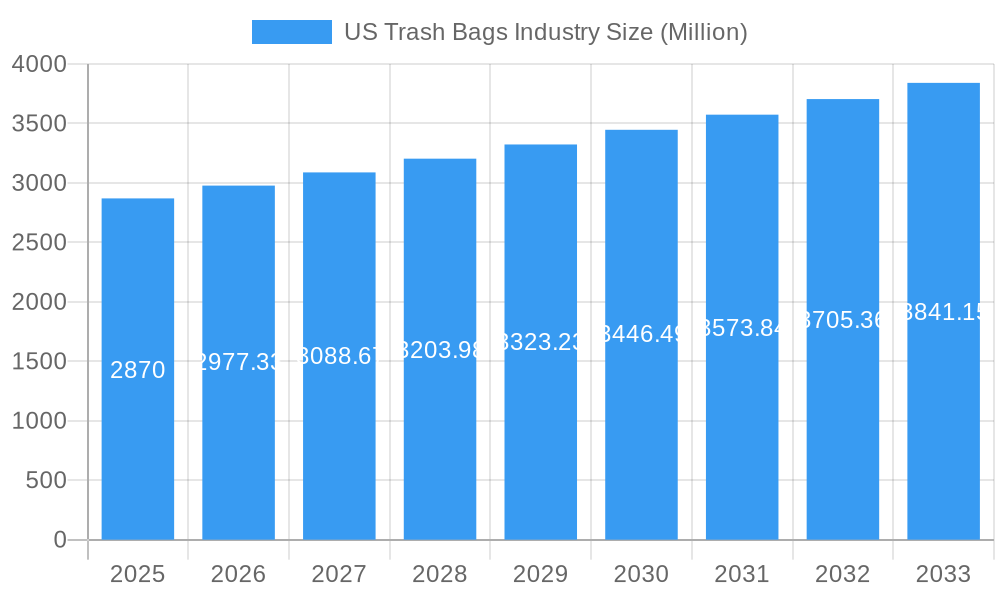
The US trash bag market, valued at $2.87 billion in 2025, is projected to experience steady growth, driven by increasing household waste generation, rising environmental awareness (leading to demand for eco-friendly options), and the growth of e-commerce (resulting in increased packaging waste). The market's compound annual growth rate (CAGR) of 3.69% from 2025 to 2033 indicates a consistent, albeit moderate, expansion. Key segments within this market include residential, commercial, and industrial applications, with residential likely dominating due to the sheer volume of households. The commercial segment is also expected to grow significantly, fueled by the increasing number of businesses and stricter waste management regulations. Furthermore, the industrial segment, though smaller, shows potential for growth as industrial waste management practices become more sophisticated. Competitive forces are evident, with major players like Hefty, Berry Global, and Novolex vying for market share through innovation in materials (e.g., biodegradable options) and packaging formats. Regional variations exist across the US, with densely populated areas like the Northeast and West likely exhibiting higher demand compared to less populous regions. However, growth is expected across all regions, albeit at varying rates, reflecting a nationwide need for effective waste disposal solutions.
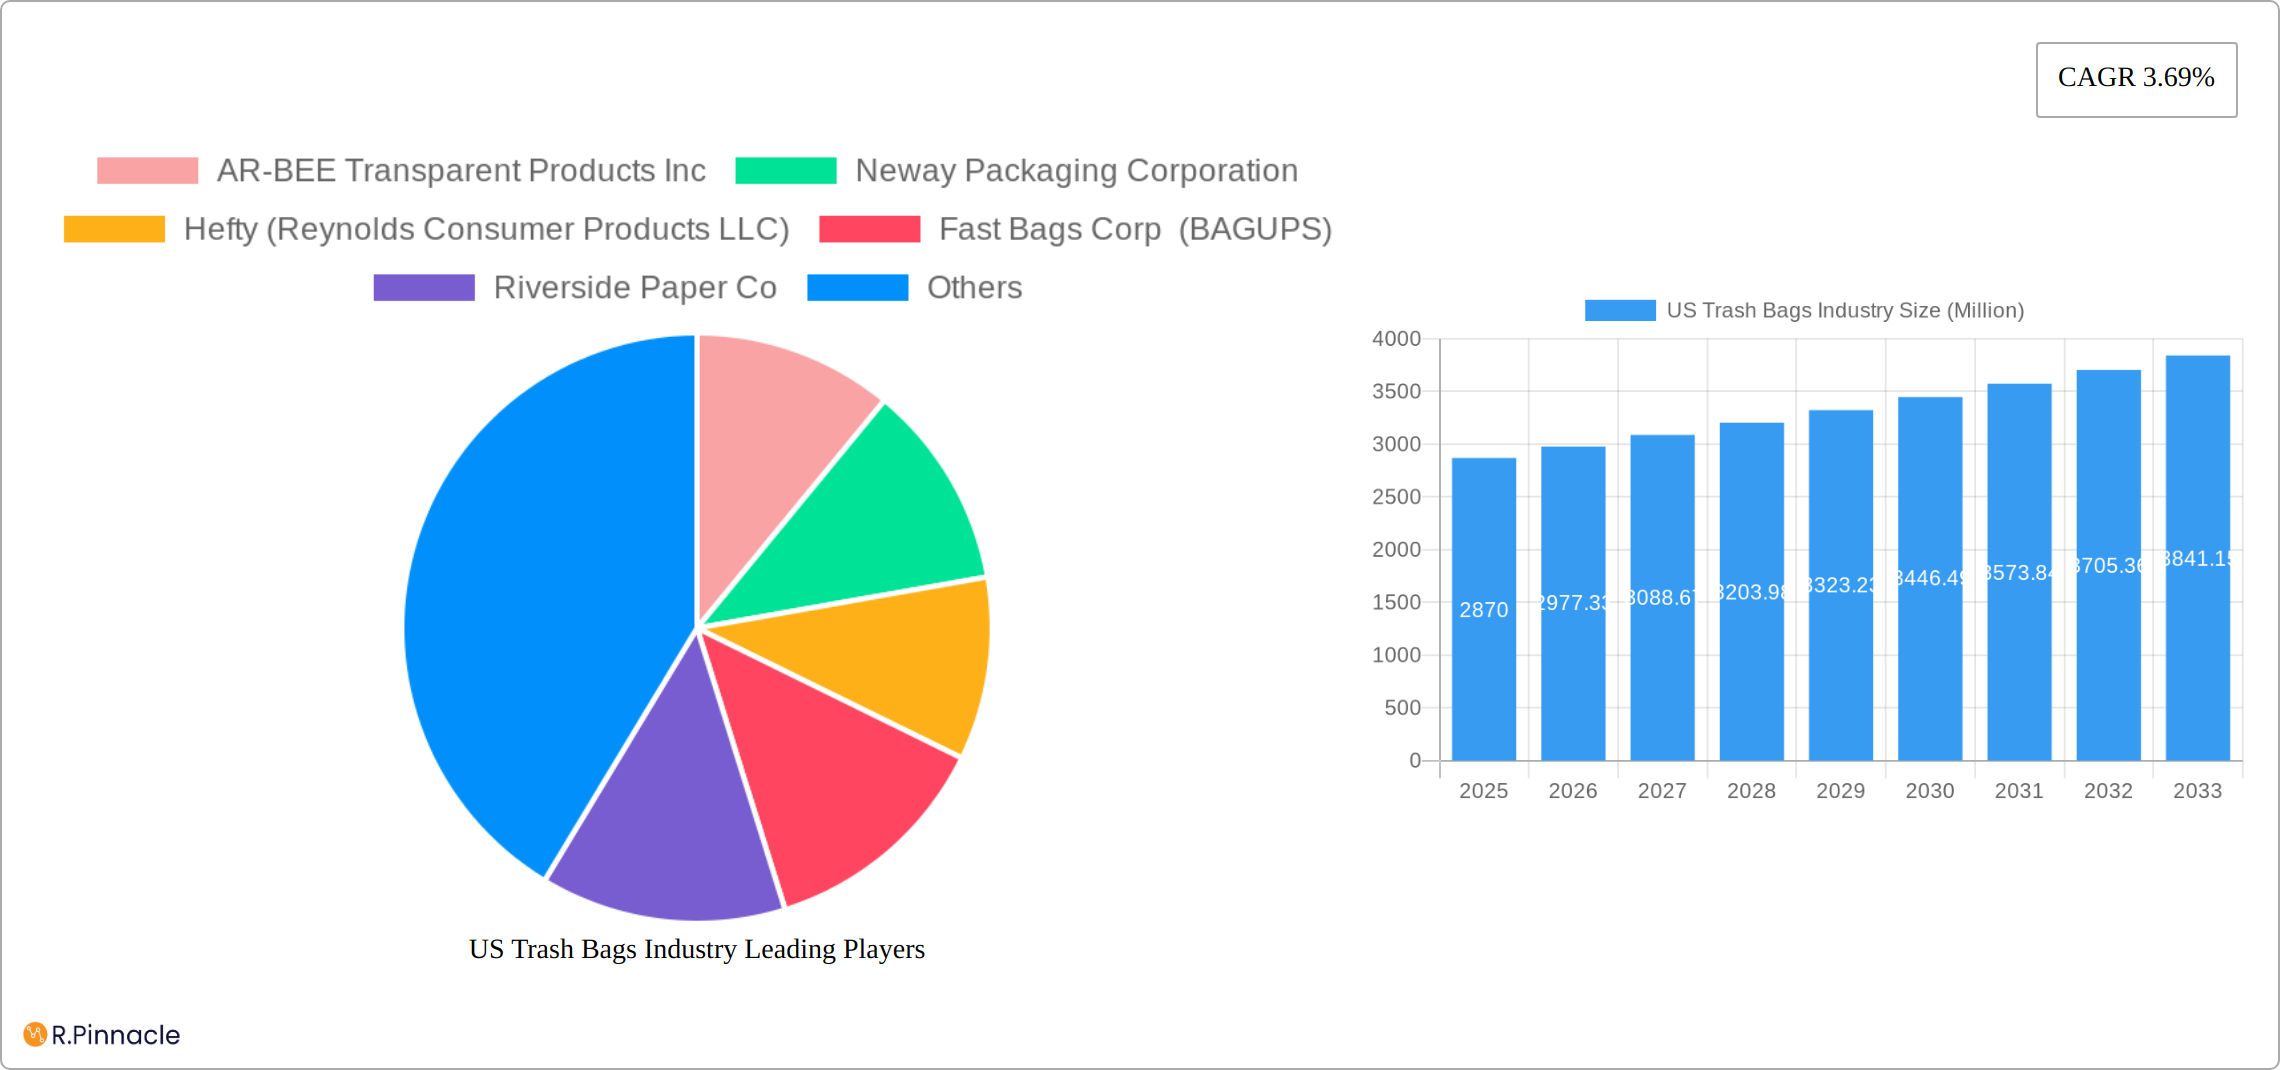
US Trash Bags Industry Market Size (In Billion)
Looking ahead to 2033, the market's expansion will be influenced by several factors. Continued population growth and urbanization will undoubtedly increase waste generation, creating a sustained demand for trash bags. However, potential headwinds include fluctuating raw material prices (particularly for plastics) and increasing pressure to reduce plastic waste. Companies are responding to these challenges by investing in research and development of sustainable and biodegradable alternatives. The success of these initiatives will be crucial in shaping the future trajectory of the US trash bag market. Ultimately, the market's ability to adapt to environmental concerns and changing consumer preferences will determine its long-term growth potential.
US Trash Bags Industry Company Market Share
US Trash Bags Industry Report: 2019-2033
This comprehensive report provides an in-depth analysis of the US trash bags industry, offering invaluable insights for industry professionals, investors, and strategic decision-makers. Covering the period from 2019 to 2033 (Base Year: 2025, Forecast Period: 2025-2033), this report unveils market trends, competitive dynamics, and future growth opportunities within this dynamic sector. The US trash bags market is projected to reach xx Million by 2033, exhibiting a CAGR of xx% during the forecast period.
US Trash Bags Industry Market Structure & Innovation Trends
The US trash bags industry is characterized by a mix of large multinational corporations and smaller regional players. Market concentration is moderate, with the top five companies holding an estimated xx% market share in 2024. Key players include Hefty (Reynolds Consumer Products LLC), Novolex, Berry Global Inc, Inteplast Group, and Universal Plastic Bag Co. Smaller players, like AR-BEE Transparent Products Inc and Neway Packaging Corporation, often focus on niche segments or regional markets.
Innovation is driven by several factors, including:
- Sustainability: Growing consumer demand for eco-friendly options is pushing innovation towards biodegradable and compostable trash bags.
- Convenience: New dispensing systems, like Bagups, are streamlining the trash bag replacement process.
- Performance: Improvements in material science are leading to stronger, more leak-resistant bags.
Regulatory frameworks, such as those concerning plastic waste reduction, are significantly shaping the industry landscape. Product substitutes, such as reusable bags and composting systems, pose a competitive threat, while ongoing M&A activity, with deal values totaling xx Million in the past five years, is reshaping the market structure.
US Trash Bags Industry Market Dynamics & Trends
The US trash bag market exhibits robust growth, fueled by several interconnected factors. Increasing waste generation, a direct consequence of population growth and evolving consumption habits, significantly boosts demand. Simultaneously, heightened awareness of hygiene and sanitation practices drives consumers toward higher-quality, more reliable trash bag options. Stable economic conditions in many regions contribute to increased disposable income, further fueling spending on household consumables like trash bags.
However, this growth trajectory isn't without its challenges. The industry faces considerable volatility in raw material prices, especially resin costs, directly impacting profitability. Stringent environmental regulations are reshaping manufacturing processes and material choices, demanding innovation and adaptation. Furthermore, the emergence of alternative waste management solutions and intensified competition from established players and innovative startups necessitate strategic adjustments for market share retention. Companies are employing various strategies, including brand building, product differentiation, and rigorous cost optimization, to navigate this competitive landscape.
Dominant Regions & Segments in US Trash Bags Industry
The residential segment dominates the US trash bags market, accounting for xx% of total market value in 2024. This is driven by the large population base and high household penetration of trash bags. The commercial and industrial segments, while smaller, are exhibiting faster growth rates.
Residential Segment Key Drivers:
- High household penetration.
- Consistent demand irrespective of economic fluctuations.
- Increasing awareness of hygiene and sanitation.
Commercial Segment Key Drivers:
- Growth of businesses and service sectors.
- Increased waste generation in commercial establishments.
- Stringent sanitation regulations.
Industrial Segment Key Drivers:
- Specific waste management needs for different industrial processes.
- Focus on efficiency and cost-effectiveness.
Geographic dominance is observed across various regions, with higher population density areas showing greater demand.
US Trash Bags Industry Product Innovations
Recent innovations in the US trash bags industry center around sustainability and convenience. Biodegradable and compostable options are gaining traction, addressing growing environmental concerns. New dispensing systems are designed to improve user experience and reduce waste. These innovations are tailored to meet specific market needs and enhance competitive advantages by offering unique value propositions to consumers.
Report Scope & Segmentation Analysis
This report segments the US trash bags market by end-user: Residential, Commercial, and Industrial.
Residential: This segment is characterized by high volume and relatively low pricing. Growth is driven by population growth and changing lifestyles. Competitive dynamics are intense, with focus on branding and convenience.
Commercial: This segment comprises businesses, restaurants, and other commercial establishments. Growth is linked to the expansion of the service sector and increased waste generation. Companies often focus on providing bulk packaging and customized solutions.
Industrial: This segment focuses on specialized trash bags for industrial applications, requiring higher durability and specific properties. Growth is influenced by industrial production and regulatory compliance.
Each segment's market size, growth projections, and competitive dynamics are thoroughly analyzed in the full report.
Key Drivers of US Trash Bags Industry Growth
Several factors fuel the growth of the US trash bags industry: increased waste generation driven by population growth and rising consumption; heightened hygiene awareness leading to increased demand for convenient and effective waste disposal solutions; and the rising adoption of eco-friendly options, creating demand for biodegradable and compostable bags. Furthermore, consistent economic activity supports sustained demand.
Challenges in the US Trash Bags Industry Sector
The US trash bag industry grapples with significant hurdles. Fluctuating resin prices represent a major challenge, impacting production costs and profit margins. The tightening regulatory environment concerning environmental sustainability necessitates investment in eco-friendly materials and manufacturing processes. This adds complexity and cost. Finally, intense competition from both established industry giants and agile, innovative newcomers necessitates constant adaptation and the development of unique value propositions.
Emerging Opportunities in US Trash Bags Industry
The rising tide of environmental consciousness presents a compelling opportunity for growth. The demand for sustainable and biodegradable trash bag options is escalating rapidly. Manufacturers who can successfully integrate innovative materials and responsible manufacturing practices are well-positioned to capture significant market share. Technological advancements are also unlocking exciting avenues; improved dispensing systems, smart waste management integration, and customized solutions tailored to specific consumer needs offer substantial potential for innovation and market differentiation.
Leading Players in the US Trash Bags Industry Market
- AR-BEE Transparent Products Inc
- Neway Packaging Corporation
- Hefty (Reynolds Consumer Products LLC)
- Fast Bags Corp (BAGUPS)
- Riverside Paper Co
- International Plastics Inc
- Novolex
- Berry Global Inc
- Inteplast Group
- Universal Plastic Bag Co
Key Developments in US Trash Bags Industry Industry
- January 2024: Recircle Brands launched Bagups, a new trash bag dispensing system using biodegradable materials, reducing plastic waste and carbon footprint. This innovation signifies a move towards sustainable and convenient waste disposal solutions.
Future Outlook for US Trash Bags Industry Market
The future of the US trash bag market appears promising. Continued population growth, coupled with an unwavering focus on hygiene and convenience, will fuel consistent demand. The increasing emphasis on sustainability presents a significant opportunity for manufacturers to create and market environmentally conscious products. Companies that prioritize innovation, sustainability, and strategic partnerships while investing in research and development are best positioned to achieve long-term success and secure a significant market share in this dynamic industry.
US Trash Bags Industry Segmentation
-
1. End User
- 1.1. Residential
- 1.2. Commercial
- 1.3. Industrial
US Trash Bags Industry Segmentation By Geography
-
1. North America
- 1.1. United States
- 1.2. Canada
- 1.3. Mexico
-
2. South America
- 2.1. Brazil
- 2.2. Argentina
- 2.3. Rest of South America
-
3. Europe
- 3.1. United Kingdom
- 3.2. Germany
- 3.3. France
- 3.4. Italy
- 3.5. Spain
- 3.6. Russia
- 3.7. Benelux
- 3.8. Nordics
- 3.9. Rest of Europe
-
4. Middle East & Africa
- 4.1. Turkey
- 4.2. Israel
- 4.3. GCC
- 4.4. North Africa
- 4.5. South Africa
- 4.6. Rest of Middle East & Africa
-
5. Asia Pacific
- 5.1. China
- 5.2. India
- 5.3. Japan
- 5.4. South Korea
- 5.5. ASEAN
- 5.6. Oceania
- 5.7. Rest of Asia Pacific
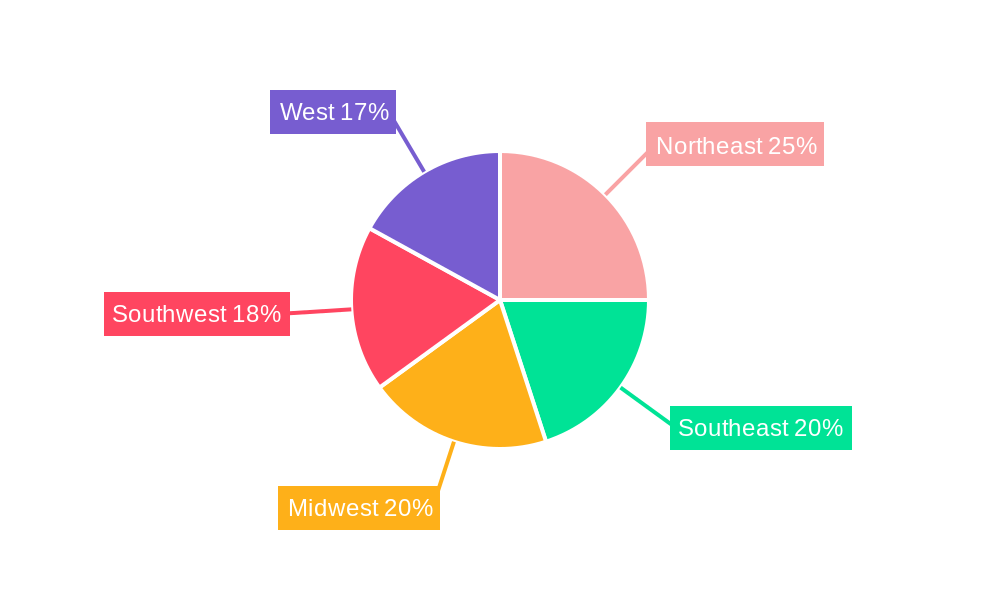
US Trash Bags Industry Regional Market Share
Geographic Coverage of US Trash Bags Industry
US Trash Bags Industry REPORT HIGHLIGHTS
| Aspects | Details |
|---|---|
| Study Period | 2020-2034 |
| Base Year | 2025 |
| Estimated Year | 2026 |
| Forecast Period | 2026-2034 |
| Historical Period | 2020-2025 |
| Growth Rate | CAGR of 3.69% from 2020-2034 |
| Segmentation |
|
Table of Contents
- 1. Introduction
- 1.1. Research Scope
- 1.2. Market Segmentation
- 1.3. Research Objective
- 1.4. Definitions and Assumptions
- 2. Executive Summary
- 2.1. Market Snapshot
- 3. Market Dynamics
- 3.1. Market Drivers
- 3.2. Market Restrains
- 3.3. Market Trends
- 3.4. Market Opportunities
- 4. Market Factor Analysis
- 4.1. Porters Five Forces
- 4.1.1. Bargaining Power of Suppliers
- 4.1.2. Bargaining Power of Buyers
- 4.1.3. Threat of New Entrants
- 4.1.4. Threat of Substitutes
- 4.1.5. Competitive Rivalry
- 4.2. PESTEL analysis
- 4.3. BCG Analysis
- 4.3.1. Stars (High Growth, High Market Share)
- 4.3.2. Cash Cows (Low Growth, High Market Share)
- 4.3.3. Question Mark (High Growth, Low Market Share)
- 4.3.4. Dogs (Low Growth, Low Market Share)
- 4.4. Ansoff Matrix Analysis
- 4.5. Supply Chain Analysis
- 4.6. Regulatory Landscape
- 4.7. Current Market Potential and Opportunity Assessment (TAM–SAM–SOM Framework)
- 4.8. PRI Analyst Note
- 4.1. Porters Five Forces
- 5. Market Analysis, Insights and Forecast 2021-2033
- 5.1. Market Analysis, Insights and Forecast - by End User
- 5.1.1. Residential
- 5.1.2. Commercial
- 5.1.3. Industrial
- 5.2. Market Analysis, Insights and Forecast - by Region
- 5.2.1. North America
- 5.2.2. South America
- 5.2.3. Europe
- 5.2.4. Middle East & Africa
- 5.2.5. Asia Pacific
- 5.1. Market Analysis, Insights and Forecast - by End User
- 6. Global US Trash Bags Industry Analysis, Insights and Forecast, 2021-2033
- 6.1. Market Analysis, Insights and Forecast - by End User
- 6.1.1. Residential
- 6.1.2. Commercial
- 6.1.3. Industrial
- 6.1. Market Analysis, Insights and Forecast - by End User
- 7. North America US Trash Bags Industry Analysis, Insights and Forecast, 2020-2032
- 7.1. Market Analysis, Insights and Forecast - by End User
- 7.1.1. Residential
- 7.1.2. Commercial
- 7.1.3. Industrial
- 7.1. Market Analysis, Insights and Forecast - by End User
- 8. South America US Trash Bags Industry Analysis, Insights and Forecast, 2020-2032
- 8.1. Market Analysis, Insights and Forecast - by End User
- 8.1.1. Residential
- 8.1.2. Commercial
- 8.1.3. Industrial
- 8.1. Market Analysis, Insights and Forecast - by End User
- 9. Europe US Trash Bags Industry Analysis, Insights and Forecast, 2020-2032
- 9.1. Market Analysis, Insights and Forecast - by End User
- 9.1.1. Residential
- 9.1.2. Commercial
- 9.1.3. Industrial
- 9.1. Market Analysis, Insights and Forecast - by End User
- 10. Middle East & Africa US Trash Bags Industry Analysis, Insights and Forecast, 2020-2032
- 10.1. Market Analysis, Insights and Forecast - by End User
- 10.1.1. Residential
- 10.1.2. Commercial
- 10.1.3. Industrial
- 10.1. Market Analysis, Insights and Forecast - by End User
- 11. Asia Pacific US Trash Bags Industry Analysis, Insights and Forecast, 2020-2032
- 11.1. Market Analysis, Insights and Forecast - by End User
- 11.1.1. Residential
- 11.1.2. Commercial
- 11.1.3. Industrial
- 11.1. Market Analysis, Insights and Forecast - by End User
- 12. Competitive Analysis
- 12.1. Company Profiles
- 12.1.1 AR-BEE Transparent Products Inc
- 12.1.1.1. Company Overview
- 12.1.1.2. Products
- 12.1.1.3. Company Financials
- 12.1.1.4. SWOT Analysis
- 12.1.2 Neway Packaging Corporation
- 12.1.2.1. Company Overview
- 12.1.2.2. Products
- 12.1.2.3. Company Financials
- 12.1.2.4. SWOT Analysis
- 12.1.3 Hefty (Reynolds Consumer Products LLC)
- 12.1.3.1. Company Overview
- 12.1.3.2. Products
- 12.1.3.3. Company Financials
- 12.1.3.4. SWOT Analysis
- 12.1.4 Fast Bags Corp (BAGUPS)
- 12.1.4.1. Company Overview
- 12.1.4.2. Products
- 12.1.4.3. Company Financials
- 12.1.4.4. SWOT Analysis
- 12.1.5 Riverside Paper Co
- 12.1.5.1. Company Overview
- 12.1.5.2. Products
- 12.1.5.3. Company Financials
- 12.1.5.4. SWOT Analysis
- 12.1.6 International Plastics Inc
- 12.1.6.1. Company Overview
- 12.1.6.2. Products
- 12.1.6.3. Company Financials
- 12.1.6.4. SWOT Analysis
- 12.1.7 Novolex
- 12.1.7.1. Company Overview
- 12.1.7.2. Products
- 12.1.7.3. Company Financials
- 12.1.7.4. SWOT Analysis
- 12.1.8 Berry Global Inc
- 12.1.8.1. Company Overview
- 12.1.8.2. Products
- 12.1.8.3. Company Financials
- 12.1.8.4. SWOT Analysis
- 12.1.9 Inteplast Group
- 12.1.9.1. Company Overview
- 12.1.9.2. Products
- 12.1.9.3. Company Financials
- 12.1.9.4. SWOT Analysis
- 12.1.10 Universal Plastic Bag Co
- 12.1.10.1. Company Overview
- 12.1.10.2. Products
- 12.1.10.3. Company Financials
- 12.1.10.4. SWOT Analysis
- 12.1.1 AR-BEE Transparent Products Inc
- 12.2. Market Entropy
- 12.2.1 Company's Key Areas Served
- 12.2.2 Recent Developments
- 12.3. Company Market Share Analysis 2025
- 12.3.1 Top 5 Companies Market Share Analysis
- 12.3.2 Top 3 Companies Market Share Analysis
- 12.4. List of Potential Customers
- 13. Research Methodology
List of Figures
- Figure 1: Global US Trash Bags Industry Revenue Breakdown (Million, %) by Region 2025 & 2033
- Figure 2: North America US Trash Bags Industry Revenue (Million), by End User 2025 & 2033
- Figure 3: North America US Trash Bags Industry Revenue Share (%), by End User 2025 & 2033
- Figure 4: North America US Trash Bags Industry Revenue (Million), by Country 2025 & 2033
- Figure 5: North America US Trash Bags Industry Revenue Share (%), by Country 2025 & 2033
- Figure 6: South America US Trash Bags Industry Revenue (Million), by End User 2025 & 2033
- Figure 7: South America US Trash Bags Industry Revenue Share (%), by End User 2025 & 2033
- Figure 8: South America US Trash Bags Industry Revenue (Million), by Country 2025 & 2033
- Figure 9: South America US Trash Bags Industry Revenue Share (%), by Country 2025 & 2033
- Figure 10: Europe US Trash Bags Industry Revenue (Million), by End User 2025 & 2033
- Figure 11: Europe US Trash Bags Industry Revenue Share (%), by End User 2025 & 2033
- Figure 12: Europe US Trash Bags Industry Revenue (Million), by Country 2025 & 2033
- Figure 13: Europe US Trash Bags Industry Revenue Share (%), by Country 2025 & 2033
- Figure 14: Middle East & Africa US Trash Bags Industry Revenue (Million), by End User 2025 & 2033
- Figure 15: Middle East & Africa US Trash Bags Industry Revenue Share (%), by End User 2025 & 2033
- Figure 16: Middle East & Africa US Trash Bags Industry Revenue (Million), by Country 2025 & 2033
- Figure 17: Middle East & Africa US Trash Bags Industry Revenue Share (%), by Country 2025 & 2033
- Figure 18: Asia Pacific US Trash Bags Industry Revenue (Million), by End User 2025 & 2033
- Figure 19: Asia Pacific US Trash Bags Industry Revenue Share (%), by End User 2025 & 2033
- Figure 20: Asia Pacific US Trash Bags Industry Revenue (Million), by Country 2025 & 2033
- Figure 21: Asia Pacific US Trash Bags Industry Revenue Share (%), by Country 2025 & 2033
List of Tables
- Table 1: Global US Trash Bags Industry Revenue Million Forecast, by End User 2020 & 2033
- Table 2: Global US Trash Bags Industry Revenue Million Forecast, by Region 2020 & 2033
- Table 3: Global US Trash Bags Industry Revenue Million Forecast, by End User 2020 & 2033
- Table 4: Global US Trash Bags Industry Revenue Million Forecast, by Country 2020 & 2033
- Table 5: United States US Trash Bags Industry Revenue (Million) Forecast, by Application 2020 & 2033
- Table 6: Canada US Trash Bags Industry Revenue (Million) Forecast, by Application 2020 & 2033
- Table 7: Mexico US Trash Bags Industry Revenue (Million) Forecast, by Application 2020 & 2033
- Table 8: Global US Trash Bags Industry Revenue Million Forecast, by End User 2020 & 2033
- Table 9: Global US Trash Bags Industry Revenue Million Forecast, by Country 2020 & 2033
- Table 10: Brazil US Trash Bags Industry Revenue (Million) Forecast, by Application 2020 & 2033
- Table 11: Argentina US Trash Bags Industry Revenue (Million) Forecast, by Application 2020 & 2033
- Table 12: Rest of South America US Trash Bags Industry Revenue (Million) Forecast, by Application 2020 & 2033
- Table 13: Global US Trash Bags Industry Revenue Million Forecast, by End User 2020 & 2033
- Table 14: Global US Trash Bags Industry Revenue Million Forecast, by Country 2020 & 2033
- Table 15: United Kingdom US Trash Bags Industry Revenue (Million) Forecast, by Application 2020 & 2033
- Table 16: Germany US Trash Bags Industry Revenue (Million) Forecast, by Application 2020 & 2033
- Table 17: France US Trash Bags Industry Revenue (Million) Forecast, by Application 2020 & 2033
- Table 18: Italy US Trash Bags Industry Revenue (Million) Forecast, by Application 2020 & 2033
- Table 19: Spain US Trash Bags Industry Revenue (Million) Forecast, by Application 2020 & 2033
- Table 20: Russia US Trash Bags Industry Revenue (Million) Forecast, by Application 2020 & 2033
- Table 21: Benelux US Trash Bags Industry Revenue (Million) Forecast, by Application 2020 & 2033
- Table 22: Nordics US Trash Bags Industry Revenue (Million) Forecast, by Application 2020 & 2033
- Table 23: Rest of Europe US Trash Bags Industry Revenue (Million) Forecast, by Application 2020 & 2033
- Table 24: Global US Trash Bags Industry Revenue Million Forecast, by End User 2020 & 2033
- Table 25: Global US Trash Bags Industry Revenue Million Forecast, by Country 2020 & 2033
- Table 26: Turkey US Trash Bags Industry Revenue (Million) Forecast, by Application 2020 & 2033
- Table 27: Israel US Trash Bags Industry Revenue (Million) Forecast, by Application 2020 & 2033
- Table 28: GCC US Trash Bags Industry Revenue (Million) Forecast, by Application 2020 & 2033
- Table 29: North Africa US Trash Bags Industry Revenue (Million) Forecast, by Application 2020 & 2033
- Table 30: South Africa US Trash Bags Industry Revenue (Million) Forecast, by Application 2020 & 2033
- Table 31: Rest of Middle East & Africa US Trash Bags Industry Revenue (Million) Forecast, by Application 2020 & 2033
- Table 32: Global US Trash Bags Industry Revenue Million Forecast, by End User 2020 & 2033
- Table 33: Global US Trash Bags Industry Revenue Million Forecast, by Country 2020 & 2033
- Table 34: China US Trash Bags Industry Revenue (Million) Forecast, by Application 2020 & 2033
- Table 35: India US Trash Bags Industry Revenue (Million) Forecast, by Application 2020 & 2033
- Table 36: Japan US Trash Bags Industry Revenue (Million) Forecast, by Application 2020 & 2033
- Table 37: South Korea US Trash Bags Industry Revenue (Million) Forecast, by Application 2020 & 2033
- Table 38: ASEAN US Trash Bags Industry Revenue (Million) Forecast, by Application 2020 & 2033
- Table 39: Oceania US Trash Bags Industry Revenue (Million) Forecast, by Application 2020 & 2033
- Table 40: Rest of Asia Pacific US Trash Bags Industry Revenue (Million) Forecast, by Application 2020 & 2033
Frequently Asked Questions
1. What is the projected Compound Annual Growth Rate (CAGR) of the US Trash Bags Industry?
The projected CAGR is approximately 3.69%.
2. Which companies are prominent players in the US Trash Bags Industry?
Key companies in the market include AR-BEE Transparent Products Inc, Neway Packaging Corporation, Hefty (Reynolds Consumer Products LLC), Fast Bags Corp (BAGUPS), Riverside Paper Co, International Plastics Inc, Novolex, Berry Global Inc, Inteplast Group, Universal Plastic Bag Co.
3. What are the main segments of the US Trash Bags Industry?
The market segments include End User.
4. Can you provide details about the market size?
The market size is estimated to be USD 2.87 Million as of 2022.
5. What are some drivers contributing to market growth?
Growing Demand for Compostable and Oxo-biodegradable Bags; Growing Awareness About Hygiene Among People.
6. What are the notable trends driving market growth?
The Residential Sector Holds the Largest Market Share.
7. Are there any restraints impacting market growth?
Unforeseen Consequences of Reusing Plastic Packaging and Health Related Concerns.
8. Can you provide examples of recent developments in the market?
January 2024: Recircle Brands, a visionary company in the eco-friendly products sector, announced the launch of Bagups, a groundbreaking trash bag dispensing system. Its unique design ensures that a new bag is always ready for use, eliminating the inconvenience of traditional trash bag replacement. The product's environmental impact is significantly reduced by using biodegradable materials, minimizing plastic waste, and reducing the overall carbon footprint.
9. What pricing options are available for accessing the report?
Pricing options include single-user, multi-user, and enterprise licenses priced at USD 3800, USD 4500, and USD 5800 respectively.
10. Is the market size provided in terms of value or volume?
The market size is provided in terms of value, measured in Million.
11. Are there any specific market keywords associated with the report?
Yes, the market keyword associated with the report is "US Trash Bags Industry," which aids in identifying and referencing the specific market segment covered.
12. How do I determine which pricing option suits my needs best?
The pricing options vary based on user requirements and access needs. Individual users may opt for single-user licenses, while businesses requiring broader access may choose multi-user or enterprise licenses for cost-effective access to the report.
13. Are there any additional resources or data provided in the US Trash Bags Industry report?
While the report offers comprehensive insights, it's advisable to review the specific contents or supplementary materials provided to ascertain if additional resources or data are available.
14. How can I stay updated on further developments or reports in the US Trash Bags Industry?
To stay informed about further developments, trends, and reports in the US Trash Bags Industry, consider subscribing to industry newsletters, following relevant companies and organizations, or regularly checking reputable industry news sources and publications.
Methodology
Step 1 - Identification of Relevant Samples Size from Population Database


Step 2 - Approaches for Defining Global Market Size (Value, Volume* & Price*)

Note*: In applicable scenarios
Step 3 - Data Sources
Primary Research
- Web Analytics
- Survey Reports
- Research Institute
- Latest Research Reports
- Opinion Leaders
Secondary Research
- Annual Reports
- White Paper
- Latest Press Release
- Industry Association
- Paid Database
- Investor Presentations

Step 4 - Data Triangulation
Involves using different sources of information in order to increase the validity of a study
These sources are likely to be stakeholders in a program - participants, other researchers, program staff, other community members, and so on.
Then we put all data in single framework & apply various statistical tools to find out the dynamic on the market.
During the analysis stage, feedback from the stakeholder groups would be compared to determine areas of agreement as well as areas of divergence