
Key Insights
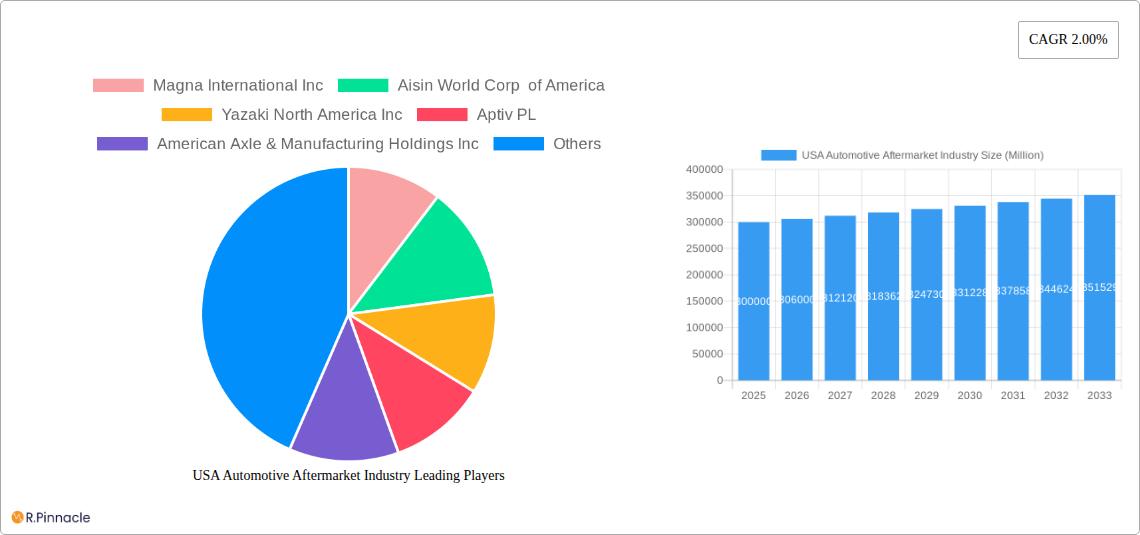
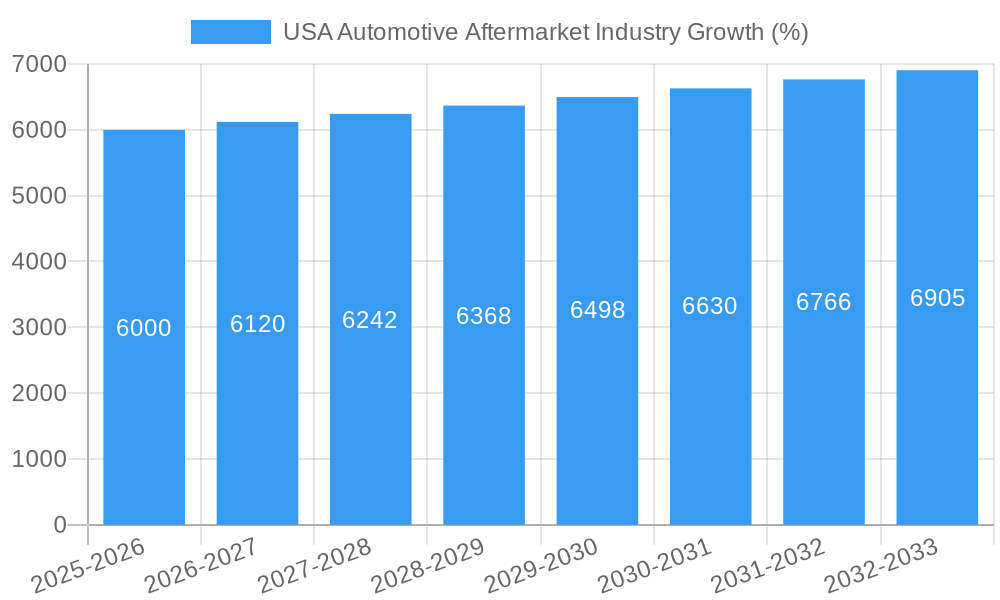
The US automotive aftermarket industry, valued at approximately $300 billion in 2025, is projected to experience steady growth with a compound annual growth rate (CAGR) of 2.00% from 2025 to 2033. This growth is fueled by several key factors. The increasing age of vehicles on US roads leads to higher demand for repair and replacement parts. Technological advancements, particularly in areas like advanced driver-assistance systems (ADAS) and connected car technologies, are creating new aftermarket opportunities for specialized parts and services. Furthermore, a rising preference for vehicle customization and personalization contributes to the market's expansion. The dominance of the passenger car segment is expected to continue, albeit with a gradual increase in the share of commercial vehicle aftermarket components due to the expansion of the logistics and delivery sectors. The online sales channel is experiencing significant growth, driven by e-commerce platforms offering convenience and competitive pricing. Key players like Magna International, Aisin, and Bosch are leveraging technological advancements and strategic partnerships to maintain market leadership.
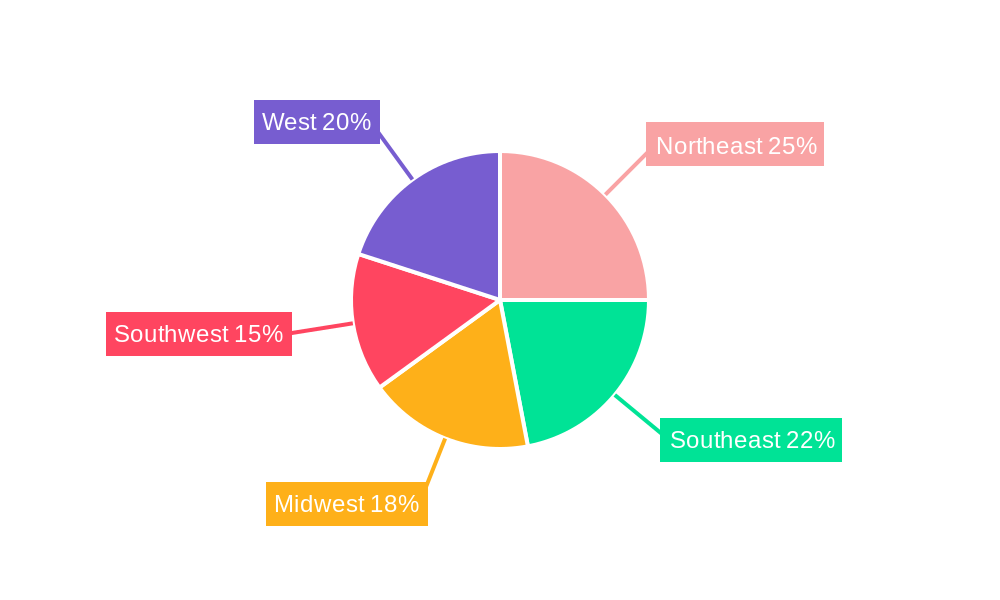
However, certain restraints also impact the industry's growth trajectory. Fluctuations in vehicle sales directly influence the aftermarket demand for parts. Economic downturns can reduce consumer spending on non-essential vehicle maintenance and repairs. The increasing complexity of modern vehicles necessitates specialized tools and expertise, which can lead to higher repair costs and potential barriers to entry for smaller independent repair shops. The industry also faces challenges related to counterfeit parts, which affect both quality and consumer trust. Competitive pressures from both established players and new entrants also contribute to the overall dynamic landscape. The regional distribution of market share is likely to reflect existing population density and vehicle ownership patterns, with the Northeast, West, and Southeast showing relatively higher market share due to their larger populations and higher vehicle density compared to the Midwest and Southwest.
USA Automotive Aftermarket Industry Report: 2019-2033
This comprehensive report provides an in-depth analysis of the USA automotive aftermarket industry, offering invaluable insights for industry professionals, investors, and strategic decision-makers. Covering the period 2019-2033, with a focus on 2025, this report unveils market dynamics, key players, and future growth potential. The report's meticulous research includes detailed segmentation, competitive landscape analysis, and forecasts that illuminate the path ahead for this dynamic sector. Expect data-driven predictions, trend analysis, and actionable insights to inform your strategic planning.
USA Automotive Aftermarket Industry Market Structure & Innovation Trends
This section analyzes the competitive landscape, innovation drivers, and regulatory influences shaping the USA automotive aftermarket industry. The market is moderately concentrated, with key players holding significant market share, though numerous smaller businesses also contribute significantly. Innovation is driven by the increasing demand for advanced technologies, such as electric vehicle components and connected car solutions. Stringent safety and emission regulations influence product development and adoption. The presence of substitute products, such as used parts and repair services, creates competitive pressure. The industry exhibits diverse end-user demographics, encompassing individual consumers, fleet operators, and repair shops. Mergers and acquisitions (M&A) are frequent, with deal values reaching xx Million in recent years.
- Market Concentration: Moderately concentrated, with top 10 players holding approximately xx% market share (2024).
- Innovation Drivers: Advancements in EV technology, autonomous driving, and connected car features.
- Regulatory Framework: Stringent emission and safety standards influence product development.
- Product Substitutes: Used parts, independent repair shops pose competitive challenges.
- End-User Demographics: Diverse, including individual consumers, fleet operators, and repair shops.
- M&A Activities: Significant activity in recent years, with deal values totaling xx Million in 2024.
USA Automotive Aftermarket Industry Market Dynamics & Trends
The USA automotive aftermarket industry exhibits robust growth, fueled by increasing vehicle parc, rising consumer disposable income, and the growing preference for vehicle customization. Technological disruptions, particularly in areas like connected car technology and electric vehicle components, are reshaping the market. Consumer preferences are shifting toward higher-quality, longer-lasting parts, and convenient online purchasing options. Competitive dynamics are characterized by intense rivalry among established players and emerging new entrants. The Compound Annual Growth Rate (CAGR) for the period 2025-2033 is projected at xx%, with market penetration of new technologies increasing steadily. The market shows signs of significant resilience to economic fluctuations.
Dominant Regions & Segments in USA Automotive Aftermarket Industry
The dominant region within the USA automotive aftermarket industry is the xx, driven by factors such as a high vehicle density, robust consumer spending, and a well-developed infrastructure. This region demonstrates strong growth across all segments, with the highest sales volumes recorded in the passenger car segment.
- Key Drivers:
- High vehicle ownership rates
- Strong consumer spending power
- Well-developed distribution and retail networks.
- Dominant Segments:
- Vehicle Type: Passenger cars represent the largest segment, with a market share of xx% in 2024.
- Application: Engine components and interior parts maintain dominant positions in the aftermarket.
- Sales Channel: Offline channels still dominate, though online sales are experiencing significant growth.
USA Automotive Aftermarket Industry Product Innovations
Recent product innovations focus on enhancing vehicle performance, safety, and fuel efficiency. This includes advanced driver-assistance systems (ADAS), improved engine components, and lightweight materials for increased fuel economy. These products often feature integrated sensors and connectivity for improved diagnostics and maintenance. The success of these products depends on their ability to meet evolving consumer preferences for enhanced safety, convenience, and environmental sustainability.
Report Scope & Segmentation Analysis
This report comprehensively segments the USA automotive aftermarket industry by vehicle type (passenger cars and commercial vehicles), application (engine components, transmission, interior, exterior, and other applications), and sales channel (online and offline). Growth projections vary across segments, with passenger car and online sales exhibiting higher growth rates. Competitive dynamics are segment-specific, with some areas experiencing higher concentration than others. Market sizes for each segment are detailed within the full report.
Key Drivers of USA Automotive Aftermarket Industry Growth
The growth of the USA automotive aftermarket is propelled by several factors. The increasing number of vehicles on the road, coupled with the rising age of the average vehicle, creates a higher demand for replacement parts and maintenance services. Technological advancements constantly introduce innovative products, offering better performance and features. Finally, government regulations on emissions and safety standards encourage the adoption of newer, compliant parts.
Challenges in the USA Automotive Aftermarket Industry Sector
The USA automotive aftermarket industry faces challenges including fluctuating fuel prices impacting consumer spending, supply chain disruptions resulting in part shortages, and intense competition among established and emerging players. The complexity of modern vehicles demands specialized skills and advanced tools, posing challenges for smaller repair shops. These factors contribute to variations in market growth across different regions.
Emerging Opportunities in USA Automotive Aftermarket Industry
The rise of electric vehicles presents significant opportunities for the development of specialized components and aftermarket services. The growing adoption of connected car technology opens avenues for data-driven maintenance and personalized services. Increasing consumer demand for vehicle customization creates opportunities for niche market players.
Leading Players in the USA Automotive Aftermarket Industry Market
- Magna International Inc
- Aisin World Corp of America
- Yazaki North America Inc
- Aptiv PL
- American Axle & Manufacturing Holdings Inc
- Panasonic Automotive Systems Company of America
- Continental AG
- Flex-N-Gate Corporation
- Robert Bosch GmbH
- Lear Corporation
- Faurecia
- DENSO Corporation
- Adient PLC
- ZF Friedrichshafen AG
Key Developments in USA Automotive Aftermarket Industry Industry
- December 2022: BorgWarner Inc. announced plans to spin off its Fuel Systems and Aftermarket businesses, aiming to capitalize on growth in GDI and hydrogen injection systems. This signals a strategic shift toward EV technologies.
- August 2022: Cummins Inc. completed its acquisition of Meritor, Inc., strengthening its position in integrated powertrain solutions for both internal combustion and electric vehicles. This significantly alters the competitive landscape.
- June 2022: Meritor, Inc. launched the ProTec Independent Front Suspension (IFS) for motorcoaches, expanding its product portfolio and enhancing its market position in the commercial vehicle segment.
Future Outlook for USA Automotive Aftermarket Industry Market
The USA automotive aftermarket is poised for sustained growth, driven by technological advancements, evolving consumer preferences, and the increasing age of the vehicle parc. The expanding electric vehicle market presents substantial opportunities, while ongoing advancements in connected car technology will redefine aftermarket services. Strategic partnerships and investments in innovation will be key to success in this dynamic and competitive market.
USA Automotive Aftermarket Industry Segmentation
-
1. Vehicle Type
- 1.1. Passenger Cars
- 1.2. Commercial Vehicles
-
2. Application
- 2.1. Engine Components
- 2.2. Transmission
- 2.3. Interior
- 2.4. Exterior
- 2.5. Other Applications
-
3. Sales Channel
- 3.1. Online
- 3.2. Offline
USA Automotive Aftermarket Industry Segmentation By Geography
-
1. North America
- 1.1. United States
- 1.2. Canada
- 1.3. Mexico
-
2. South America
- 2.1. Brazil
- 2.2. Argentina
- 2.3. Rest of South America
-
3. Europe
- 3.1. United Kingdom
- 3.2. Germany
- 3.3. France
- 3.4. Italy
- 3.5. Spain
- 3.6. Russia
- 3.7. Benelux
- 3.8. Nordics
- 3.9. Rest of Europe
-
4. Middle East & Africa
- 4.1. Turkey
- 4.2. Israel
- 4.3. GCC
- 4.4. North Africa
- 4.5. South Africa
- 4.6. Rest of Middle East & Africa
-
5. Asia Pacific
- 5.1. China
- 5.2. India
- 5.3. Japan
- 5.4. South Korea
- 5.5. ASEAN
- 5.6. Oceania
- 5.7. Rest of Asia Pacific
USA Automotive Aftermarket Industry REPORT HIGHLIGHTS
| Aspects | Details |
|---|---|
| Study Period | 2019-2033 |
| Base Year | 2024 |
| Estimated Year | 2025 |
| Forecast Period | 2025-2033 |
| Historical Period | 2019-2024 |
| Growth Rate | CAGR of 2.00% from 2019-2033 |
| Segmentation |
|
Table of Contents
- 1. Introduction
- 1.1. Research Scope
- 1.2. Market Segmentation
- 1.3. Research Methodology
- 1.4. Definitions and Assumptions
- 2. Executive Summary
- 2.1. Introduction
- 3. Market Dynamics
- 3.1. Introduction
- 3.2. Market Drivers
- 3.2.1. Rising Recreational and Motorsports Activities is Expected to Drive the Market; Others
- 3.3. Market Restrains
- 3.3.1. High Value and Maintenance Cost Offered to Restrain the Market Growth; Others
- 3.4. Market Trends
- 3.4.1. Rising Online Aftermarket Automotive Parts and Components Sales
- 4. Market Factor Analysis
- 4.1. Porters Five Forces
- 4.2. Supply/Value Chain
- 4.3. PESTEL analysis
- 4.4. Market Entropy
- 4.5. Patent/Trademark Analysis
- 5. Global USA Automotive Aftermarket Industry Analysis, Insights and Forecast, 2019-2031
- 5.1. Market Analysis, Insights and Forecast - by Vehicle Type
- 5.1.1. Passenger Cars
- 5.1.2. Commercial Vehicles
- 5.2. Market Analysis, Insights and Forecast - by Application
- 5.2.1. Engine Components
- 5.2.2. Transmission
- 5.2.3. Interior
- 5.2.4. Exterior
- 5.2.5. Other Applications
- 5.3. Market Analysis, Insights and Forecast - by Sales Channel
- 5.3.1. Online
- 5.3.2. Offline
- 5.4. Market Analysis, Insights and Forecast - by Region
- 5.4.1. North America
- 5.4.2. South America
- 5.4.3. Europe
- 5.4.4. Middle East & Africa
- 5.4.5. Asia Pacific
- 5.1. Market Analysis, Insights and Forecast - by Vehicle Type
- 6. North America USA Automotive Aftermarket Industry Analysis, Insights and Forecast, 2019-2031
- 6.1. Market Analysis, Insights and Forecast - by Vehicle Type
- 6.1.1. Passenger Cars
- 6.1.2. Commercial Vehicles
- 6.2. Market Analysis, Insights and Forecast - by Application
- 6.2.1. Engine Components
- 6.2.2. Transmission
- 6.2.3. Interior
- 6.2.4. Exterior
- 6.2.5. Other Applications
- 6.3. Market Analysis, Insights and Forecast - by Sales Channel
- 6.3.1. Online
- 6.3.2. Offline
- 6.1. Market Analysis, Insights and Forecast - by Vehicle Type
- 7. South America USA Automotive Aftermarket Industry Analysis, Insights and Forecast, 2019-2031
- 7.1. Market Analysis, Insights and Forecast - by Vehicle Type
- 7.1.1. Passenger Cars
- 7.1.2. Commercial Vehicles
- 7.2. Market Analysis, Insights and Forecast - by Application
- 7.2.1. Engine Components
- 7.2.2. Transmission
- 7.2.3. Interior
- 7.2.4. Exterior
- 7.2.5. Other Applications
- 7.3. Market Analysis, Insights and Forecast - by Sales Channel
- 7.3.1. Online
- 7.3.2. Offline
- 7.1. Market Analysis, Insights and Forecast - by Vehicle Type
- 8. Europe USA Automotive Aftermarket Industry Analysis, Insights and Forecast, 2019-2031
- 8.1. Market Analysis, Insights and Forecast - by Vehicle Type
- 8.1.1. Passenger Cars
- 8.1.2. Commercial Vehicles
- 8.2. Market Analysis, Insights and Forecast - by Application
- 8.2.1. Engine Components
- 8.2.2. Transmission
- 8.2.3. Interior
- 8.2.4. Exterior
- 8.2.5. Other Applications
- 8.3. Market Analysis, Insights and Forecast - by Sales Channel
- 8.3.1. Online
- 8.3.2. Offline
- 8.1. Market Analysis, Insights and Forecast - by Vehicle Type
- 9. Middle East & Africa USA Automotive Aftermarket Industry Analysis, Insights and Forecast, 2019-2031
- 9.1. Market Analysis, Insights and Forecast - by Vehicle Type
- 9.1.1. Passenger Cars
- 9.1.2. Commercial Vehicles
- 9.2. Market Analysis, Insights and Forecast - by Application
- 9.2.1. Engine Components
- 9.2.2. Transmission
- 9.2.3. Interior
- 9.2.4. Exterior
- 9.2.5. Other Applications
- 9.3. Market Analysis, Insights and Forecast - by Sales Channel
- 9.3.1. Online
- 9.3.2. Offline
- 9.1. Market Analysis, Insights and Forecast - by Vehicle Type
- 10. Asia Pacific USA Automotive Aftermarket Industry Analysis, Insights and Forecast, 2019-2031
- 10.1. Market Analysis, Insights and Forecast - by Vehicle Type
- 10.1.1. Passenger Cars
- 10.1.2. Commercial Vehicles
- 10.2. Market Analysis, Insights and Forecast - by Application
- 10.2.1. Engine Components
- 10.2.2. Transmission
- 10.2.3. Interior
- 10.2.4. Exterior
- 10.2.5. Other Applications
- 10.3. Market Analysis, Insights and Forecast - by Sales Channel
- 10.3.1. Online
- 10.3.2. Offline
- 10.1. Market Analysis, Insights and Forecast - by Vehicle Type
- 11. Northeast USA Automotive Aftermarket Industry Analysis, Insights and Forecast, 2019-2031
- 12. Southeast USA Automotive Aftermarket Industry Analysis, Insights and Forecast, 2019-2031
- 13. Midwest USA Automotive Aftermarket Industry Analysis, Insights and Forecast, 2019-2031
- 14. Southwest USA Automotive Aftermarket Industry Analysis, Insights and Forecast, 2019-2031
- 15. West USA Automotive Aftermarket Industry Analysis, Insights and Forecast, 2019-2031
- 16. Competitive Analysis
- 16.1. Global Market Share Analysis 2024
- 16.2. Company Profiles
- 16.2.1 Magna International Inc
- 16.2.1.1. Overview
- 16.2.1.2. Products
- 16.2.1.3. SWOT Analysis
- 16.2.1.4. Recent Developments
- 16.2.1.5. Financials (Based on Availability)
- 16.2.2 Aisin World Corp of America
- 16.2.2.1. Overview
- 16.2.2.2. Products
- 16.2.2.3. SWOT Analysis
- 16.2.2.4. Recent Developments
- 16.2.2.5. Financials (Based on Availability)
- 16.2.3 Yazaki North America Inc
- 16.2.3.1. Overview
- 16.2.3.2. Products
- 16.2.3.3. SWOT Analysis
- 16.2.3.4. Recent Developments
- 16.2.3.5. Financials (Based on Availability)
- 16.2.4 Aptiv PL
- 16.2.4.1. Overview
- 16.2.4.2. Products
- 16.2.4.3. SWOT Analysis
- 16.2.4.4. Recent Developments
- 16.2.4.5. Financials (Based on Availability)
- 16.2.5 American Axle & Manufacturing Holdings Inc
- 16.2.5.1. Overview
- 16.2.5.2. Products
- 16.2.5.3. SWOT Analysis
- 16.2.5.4. Recent Developments
- 16.2.5.5. Financials (Based on Availability)
- 16.2.6 Panasonic Automotive Systems Company of America
- 16.2.6.1. Overview
- 16.2.6.2. Products
- 16.2.6.3. SWOT Analysis
- 16.2.6.4. Recent Developments
- 16.2.6.5. Financials (Based on Availability)
- 16.2.7 Continental AG
- 16.2.7.1. Overview
- 16.2.7.2. Products
- 16.2.7.3. SWOT Analysis
- 16.2.7.4. Recent Developments
- 16.2.7.5. Financials (Based on Availability)
- 16.2.8 Flex-N-Gate Corporation
- 16.2.8.1. Overview
- 16.2.8.2. Products
- 16.2.8.3. SWOT Analysis
- 16.2.8.4. Recent Developments
- 16.2.8.5. Financials (Based on Availability)
- 16.2.9 Robert Bosch GmbH
- 16.2.9.1. Overview
- 16.2.9.2. Products
- 16.2.9.3. SWOT Analysis
- 16.2.9.4. Recent Developments
- 16.2.9.5. Financials (Based on Availability)
- 16.2.10 Lear Corporation
- 16.2.10.1. Overview
- 16.2.10.2. Products
- 16.2.10.3. SWOT Analysis
- 16.2.10.4. Recent Developments
- 16.2.10.5. Financials (Based on Availability)
- 16.2.11 Faurecia
- 16.2.11.1. Overview
- 16.2.11.2. Products
- 16.2.11.3. SWOT Analysis
- 16.2.11.4. Recent Developments
- 16.2.11.5. Financials (Based on Availability)
- 16.2.12 DENSO Corporation
- 16.2.12.1. Overview
- 16.2.12.2. Products
- 16.2.12.3. SWOT Analysis
- 16.2.12.4. Recent Developments
- 16.2.12.5. Financials (Based on Availability)
- 16.2.13 Adient PLC
- 16.2.13.1. Overview
- 16.2.13.2. Products
- 16.2.13.3. SWOT Analysis
- 16.2.13.4. Recent Developments
- 16.2.13.5. Financials (Based on Availability)
- 16.2.14 ZF Friedrichshafen AG
- 16.2.14.1. Overview
- 16.2.14.2. Products
- 16.2.14.3. SWOT Analysis
- 16.2.14.4. Recent Developments
- 16.2.14.5. Financials (Based on Availability)
- 16.2.1 Magna International Inc
List of Figures
- Figure 1: Global USA Automotive Aftermarket Industry Revenue Breakdown (Million, %) by Region 2024 & 2032
- Figure 2: United states USA Automotive Aftermarket Industry Revenue (Million), by Country 2024 & 2032
- Figure 3: United states USA Automotive Aftermarket Industry Revenue Share (%), by Country 2024 & 2032
- Figure 4: North America USA Automotive Aftermarket Industry Revenue (Million), by Vehicle Type 2024 & 2032
- Figure 5: North America USA Automotive Aftermarket Industry Revenue Share (%), by Vehicle Type 2024 & 2032
- Figure 6: North America USA Automotive Aftermarket Industry Revenue (Million), by Application 2024 & 2032
- Figure 7: North America USA Automotive Aftermarket Industry Revenue Share (%), by Application 2024 & 2032
- Figure 8: North America USA Automotive Aftermarket Industry Revenue (Million), by Sales Channel 2024 & 2032
- Figure 9: North America USA Automotive Aftermarket Industry Revenue Share (%), by Sales Channel 2024 & 2032
- Figure 10: North America USA Automotive Aftermarket Industry Revenue (Million), by Country 2024 & 2032
- Figure 11: North America USA Automotive Aftermarket Industry Revenue Share (%), by Country 2024 & 2032
- Figure 12: South America USA Automotive Aftermarket Industry Revenue (Million), by Vehicle Type 2024 & 2032
- Figure 13: South America USA Automotive Aftermarket Industry Revenue Share (%), by Vehicle Type 2024 & 2032
- Figure 14: South America USA Automotive Aftermarket Industry Revenue (Million), by Application 2024 & 2032
- Figure 15: South America USA Automotive Aftermarket Industry Revenue Share (%), by Application 2024 & 2032
- Figure 16: South America USA Automotive Aftermarket Industry Revenue (Million), by Sales Channel 2024 & 2032
- Figure 17: South America USA Automotive Aftermarket Industry Revenue Share (%), by Sales Channel 2024 & 2032
- Figure 18: South America USA Automotive Aftermarket Industry Revenue (Million), by Country 2024 & 2032
- Figure 19: South America USA Automotive Aftermarket Industry Revenue Share (%), by Country 2024 & 2032
- Figure 20: Europe USA Automotive Aftermarket Industry Revenue (Million), by Vehicle Type 2024 & 2032
- Figure 21: Europe USA Automotive Aftermarket Industry Revenue Share (%), by Vehicle Type 2024 & 2032
- Figure 22: Europe USA Automotive Aftermarket Industry Revenue (Million), by Application 2024 & 2032
- Figure 23: Europe USA Automotive Aftermarket Industry Revenue Share (%), by Application 2024 & 2032
- Figure 24: Europe USA Automotive Aftermarket Industry Revenue (Million), by Sales Channel 2024 & 2032
- Figure 25: Europe USA Automotive Aftermarket Industry Revenue Share (%), by Sales Channel 2024 & 2032
- Figure 26: Europe USA Automotive Aftermarket Industry Revenue (Million), by Country 2024 & 2032
- Figure 27: Europe USA Automotive Aftermarket Industry Revenue Share (%), by Country 2024 & 2032
- Figure 28: Middle East & Africa USA Automotive Aftermarket Industry Revenue (Million), by Vehicle Type 2024 & 2032
- Figure 29: Middle East & Africa USA Automotive Aftermarket Industry Revenue Share (%), by Vehicle Type 2024 & 2032
- Figure 30: Middle East & Africa USA Automotive Aftermarket Industry Revenue (Million), by Application 2024 & 2032
- Figure 31: Middle East & Africa USA Automotive Aftermarket Industry Revenue Share (%), by Application 2024 & 2032
- Figure 32: Middle East & Africa USA Automotive Aftermarket Industry Revenue (Million), by Sales Channel 2024 & 2032
- Figure 33: Middle East & Africa USA Automotive Aftermarket Industry Revenue Share (%), by Sales Channel 2024 & 2032
- Figure 34: Middle East & Africa USA Automotive Aftermarket Industry Revenue (Million), by Country 2024 & 2032
- Figure 35: Middle East & Africa USA Automotive Aftermarket Industry Revenue Share (%), by Country 2024 & 2032
- Figure 36: Asia Pacific USA Automotive Aftermarket Industry Revenue (Million), by Vehicle Type 2024 & 2032
- Figure 37: Asia Pacific USA Automotive Aftermarket Industry Revenue Share (%), by Vehicle Type 2024 & 2032
- Figure 38: Asia Pacific USA Automotive Aftermarket Industry Revenue (Million), by Application 2024 & 2032
- Figure 39: Asia Pacific USA Automotive Aftermarket Industry Revenue Share (%), by Application 2024 & 2032
- Figure 40: Asia Pacific USA Automotive Aftermarket Industry Revenue (Million), by Sales Channel 2024 & 2032
- Figure 41: Asia Pacific USA Automotive Aftermarket Industry Revenue Share (%), by Sales Channel 2024 & 2032
- Figure 42: Asia Pacific USA Automotive Aftermarket Industry Revenue (Million), by Country 2024 & 2032
- Figure 43: Asia Pacific USA Automotive Aftermarket Industry Revenue Share (%), by Country 2024 & 2032
List of Tables
- Table 1: Global USA Automotive Aftermarket Industry Revenue Million Forecast, by Region 2019 & 2032
- Table 2: Global USA Automotive Aftermarket Industry Revenue Million Forecast, by Vehicle Type 2019 & 2032
- Table 3: Global USA Automotive Aftermarket Industry Revenue Million Forecast, by Application 2019 & 2032
- Table 4: Global USA Automotive Aftermarket Industry Revenue Million Forecast, by Sales Channel 2019 & 2032
- Table 5: Global USA Automotive Aftermarket Industry Revenue Million Forecast, by Region 2019 & 2032
- Table 6: Global USA Automotive Aftermarket Industry Revenue Million Forecast, by Country 2019 & 2032
- Table 7: Northeast USA Automotive Aftermarket Industry Revenue (Million) Forecast, by Application 2019 & 2032
- Table 8: Southeast USA Automotive Aftermarket Industry Revenue (Million) Forecast, by Application 2019 & 2032
- Table 9: Midwest USA Automotive Aftermarket Industry Revenue (Million) Forecast, by Application 2019 & 2032
- Table 10: Southwest USA Automotive Aftermarket Industry Revenue (Million) Forecast, by Application 2019 & 2032
- Table 11: West USA Automotive Aftermarket Industry Revenue (Million) Forecast, by Application 2019 & 2032
- Table 12: Global USA Automotive Aftermarket Industry Revenue Million Forecast, by Vehicle Type 2019 & 2032
- Table 13: Global USA Automotive Aftermarket Industry Revenue Million Forecast, by Application 2019 & 2032
- Table 14: Global USA Automotive Aftermarket Industry Revenue Million Forecast, by Sales Channel 2019 & 2032
- Table 15: Global USA Automotive Aftermarket Industry Revenue Million Forecast, by Country 2019 & 2032
- Table 16: United States USA Automotive Aftermarket Industry Revenue (Million) Forecast, by Application 2019 & 2032
- Table 17: Canada USA Automotive Aftermarket Industry Revenue (Million) Forecast, by Application 2019 & 2032
- Table 18: Mexico USA Automotive Aftermarket Industry Revenue (Million) Forecast, by Application 2019 & 2032
- Table 19: Global USA Automotive Aftermarket Industry Revenue Million Forecast, by Vehicle Type 2019 & 2032
- Table 20: Global USA Automotive Aftermarket Industry Revenue Million Forecast, by Application 2019 & 2032
- Table 21: Global USA Automotive Aftermarket Industry Revenue Million Forecast, by Sales Channel 2019 & 2032
- Table 22: Global USA Automotive Aftermarket Industry Revenue Million Forecast, by Country 2019 & 2032
- Table 23: Brazil USA Automotive Aftermarket Industry Revenue (Million) Forecast, by Application 2019 & 2032
- Table 24: Argentina USA Automotive Aftermarket Industry Revenue (Million) Forecast, by Application 2019 & 2032
- Table 25: Rest of South America USA Automotive Aftermarket Industry Revenue (Million) Forecast, by Application 2019 & 2032
- Table 26: Global USA Automotive Aftermarket Industry Revenue Million Forecast, by Vehicle Type 2019 & 2032
- Table 27: Global USA Automotive Aftermarket Industry Revenue Million Forecast, by Application 2019 & 2032
- Table 28: Global USA Automotive Aftermarket Industry Revenue Million Forecast, by Sales Channel 2019 & 2032
- Table 29: Global USA Automotive Aftermarket Industry Revenue Million Forecast, by Country 2019 & 2032
- Table 30: United Kingdom USA Automotive Aftermarket Industry Revenue (Million) Forecast, by Application 2019 & 2032
- Table 31: Germany USA Automotive Aftermarket Industry Revenue (Million) Forecast, by Application 2019 & 2032
- Table 32: France USA Automotive Aftermarket Industry Revenue (Million) Forecast, by Application 2019 & 2032
- Table 33: Italy USA Automotive Aftermarket Industry Revenue (Million) Forecast, by Application 2019 & 2032
- Table 34: Spain USA Automotive Aftermarket Industry Revenue (Million) Forecast, by Application 2019 & 2032
- Table 35: Russia USA Automotive Aftermarket Industry Revenue (Million) Forecast, by Application 2019 & 2032
- Table 36: Benelux USA Automotive Aftermarket Industry Revenue (Million) Forecast, by Application 2019 & 2032
- Table 37: Nordics USA Automotive Aftermarket Industry Revenue (Million) Forecast, by Application 2019 & 2032
- Table 38: Rest of Europe USA Automotive Aftermarket Industry Revenue (Million) Forecast, by Application 2019 & 2032
- Table 39: Global USA Automotive Aftermarket Industry Revenue Million Forecast, by Vehicle Type 2019 & 2032
- Table 40: Global USA Automotive Aftermarket Industry Revenue Million Forecast, by Application 2019 & 2032
- Table 41: Global USA Automotive Aftermarket Industry Revenue Million Forecast, by Sales Channel 2019 & 2032
- Table 42: Global USA Automotive Aftermarket Industry Revenue Million Forecast, by Country 2019 & 2032
- Table 43: Turkey USA Automotive Aftermarket Industry Revenue (Million) Forecast, by Application 2019 & 2032
- Table 44: Israel USA Automotive Aftermarket Industry Revenue (Million) Forecast, by Application 2019 & 2032
- Table 45: GCC USA Automotive Aftermarket Industry Revenue (Million) Forecast, by Application 2019 & 2032
- Table 46: North Africa USA Automotive Aftermarket Industry Revenue (Million) Forecast, by Application 2019 & 2032
- Table 47: South Africa USA Automotive Aftermarket Industry Revenue (Million) Forecast, by Application 2019 & 2032
- Table 48: Rest of Middle East & Africa USA Automotive Aftermarket Industry Revenue (Million) Forecast, by Application 2019 & 2032
- Table 49: Global USA Automotive Aftermarket Industry Revenue Million Forecast, by Vehicle Type 2019 & 2032
- Table 50: Global USA Automotive Aftermarket Industry Revenue Million Forecast, by Application 2019 & 2032
- Table 51: Global USA Automotive Aftermarket Industry Revenue Million Forecast, by Sales Channel 2019 & 2032
- Table 52: Global USA Automotive Aftermarket Industry Revenue Million Forecast, by Country 2019 & 2032
- Table 53: China USA Automotive Aftermarket Industry Revenue (Million) Forecast, by Application 2019 & 2032
- Table 54: India USA Automotive Aftermarket Industry Revenue (Million) Forecast, by Application 2019 & 2032
- Table 55: Japan USA Automotive Aftermarket Industry Revenue (Million) Forecast, by Application 2019 & 2032
- Table 56: South Korea USA Automotive Aftermarket Industry Revenue (Million) Forecast, by Application 2019 & 2032
- Table 57: ASEAN USA Automotive Aftermarket Industry Revenue (Million) Forecast, by Application 2019 & 2032
- Table 58: Oceania USA Automotive Aftermarket Industry Revenue (Million) Forecast, by Application 2019 & 2032
- Table 59: Rest of Asia Pacific USA Automotive Aftermarket Industry Revenue (Million) Forecast, by Application 2019 & 2032
Frequently Asked Questions
1. What is the projected Compound Annual Growth Rate (CAGR) of the USA Automotive Aftermarket Industry?
The projected CAGR is approximately 2.00%.
2. Which companies are prominent players in the USA Automotive Aftermarket Industry?
Key companies in the market include Magna International Inc, Aisin World Corp of America, Yazaki North America Inc, Aptiv PL, American Axle & Manufacturing Holdings Inc, Panasonic Automotive Systems Company of America, Continental AG, Flex-N-Gate Corporation, Robert Bosch GmbH, Lear Corporation, Faurecia, DENSO Corporation, Adient PLC, ZF Friedrichshafen AG.
3. What are the main segments of the USA Automotive Aftermarket Industry?
The market segments include Vehicle Type, Application, Sales Channel.
4. Can you provide details about the market size?
The market size is estimated to be USD XX Million as of 2022.
5. What are some drivers contributing to market growth?
Rising Recreational and Motorsports Activities is Expected to Drive the Market; Others.
6. What are the notable trends driving market growth?
Rising Online Aftermarket Automotive Parts and Components Sales.
7. Are there any restraints impacting market growth?
High Value and Maintenance Cost Offered to Restrain the Market Growth; Others.
8. Can you provide examples of recent developments in the market?
December 2022: BorgWarner Inc announced plans to spin off their Fuel Systems and Aftermarket businesses into a separate, publicly traded company, which they are currently calling "NewCo." NewCo also intends to capitalize on growth trends in gasoline direct injection (GDI) and hydrogen injection systems. With this announcement, BorgWarner believes it will eventually meet or exceed its stated target of 25% revenue from EVs by 2025.
9. What pricing options are available for accessing the report?
Pricing options include single-user, multi-user, and enterprise licenses priced at USD 3800, USD 4500, and USD 5800 respectively.
10. Is the market size provided in terms of value or volume?
The market size is provided in terms of value, measured in Million.
11. Are there any specific market keywords associated with the report?
Yes, the market keyword associated with the report is "USA Automotive Aftermarket Industry," which aids in identifying and referencing the specific market segment covered.
12. How do I determine which pricing option suits my needs best?
The pricing options vary based on user requirements and access needs. Individual users may opt for single-user licenses, while businesses requiring broader access may choose multi-user or enterprise licenses for cost-effective access to the report.
13. Are there any additional resources or data provided in the USA Automotive Aftermarket Industry report?
While the report offers comprehensive insights, it's advisable to review the specific contents or supplementary materials provided to ascertain if additional resources or data are available.
14. How can I stay updated on further developments or reports in the USA Automotive Aftermarket Industry?
To stay informed about further developments, trends, and reports in the USA Automotive Aftermarket Industry, consider subscribing to industry newsletters, following relevant companies and organizations, or regularly checking reputable industry news sources and publications.
Methodology
Step 1 - Identification of Relevant Samples Size from Population Database


Step 2 - Approaches for Defining Global Market Size (Value, Volume* & Price*)

Note*: In applicable scenarios
Step 3 - Data Sources
Primary Research
- Web Analytics
- Survey Reports
- Research Institute
- Latest Research Reports
- Opinion Leaders
Secondary Research
- Annual Reports
- White Paper
- Latest Press Release
- Industry Association
- Paid Database
- Investor Presentations

Step 4 - Data Triangulation
Involves using different sources of information in order to increase the validity of a study
These sources are likely to be stakeholders in a program - participants, other researchers, program staff, other community members, and so on.
Then we put all data in single framework & apply various statistical tools to find out the dynamic on the market.
During the analysis stage, feedback from the stakeholder groups would be compared to determine areas of agreement as well as areas of divergence


