


Key Insights
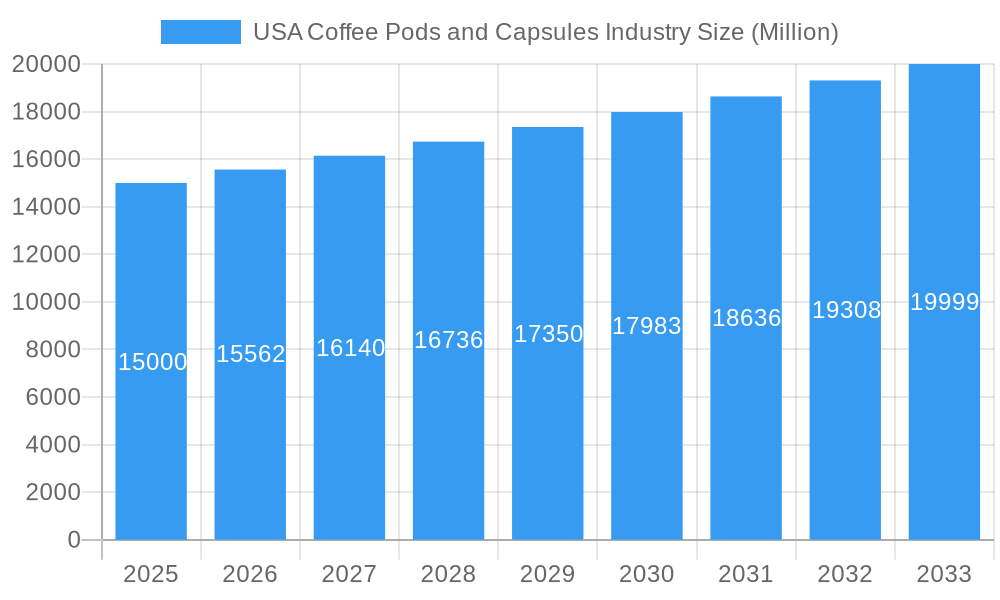
The USA coffee pods and capsules market is a dynamic and rapidly expanding sector, projected to maintain a healthy Compound Annual Growth Rate (CAGR) of 3.76% from 2025 to 2033. This growth is fueled by several key factors. The increasing popularity of single-serve brewing systems, offering convenience and consistent quality, is a major driver. Consumer preference for premium coffee experiences at home, coupled with the rising disposable incomes in the target demographic, further contributes to market expansion. Furthermore, the innovative product offerings from major players like Keurig Dr Pepper, Nestlé, and Starbucks, including a diverse range of flavors, roasts, and ethically sourced beans, continuously stimulate market demand. The market also witnesses growth from the increasing penetration of e-commerce channels and strategic partnerships that streamline distribution and enhance brand visibility.
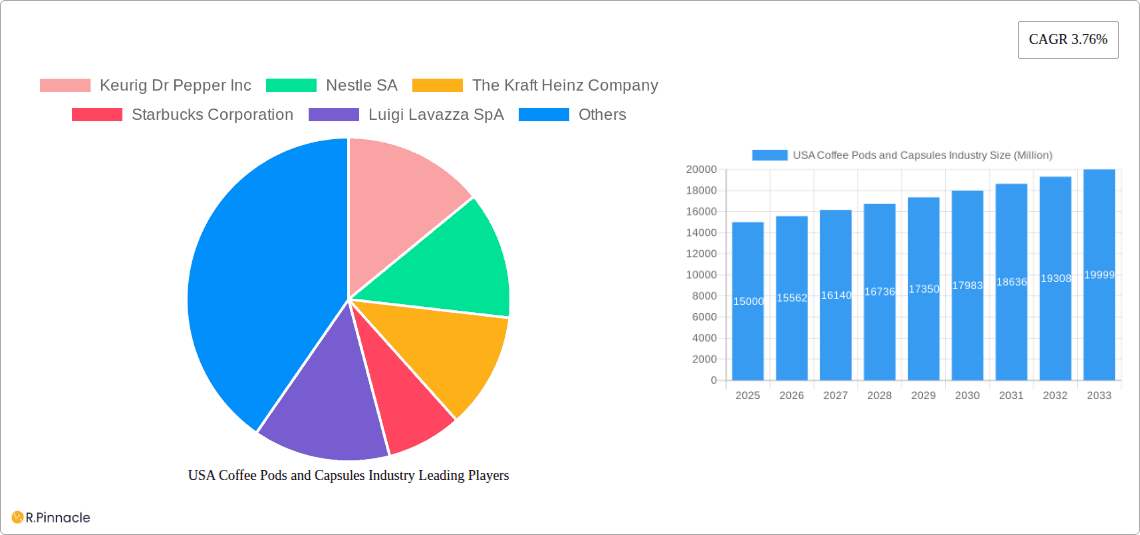
USA Coffee Pods and Capsules Industry Market Size (In Billion)

However, the market faces challenges. Fluctuations in coffee bean prices and potential increases in packaging costs represent significant restraints. Growing concerns about environmental sustainability, primarily stemming from the non-biodegradability of certain pod materials, are also presenting a challenge to industry players. Furthermore, intense competition among established brands and emerging players necessitates continuous innovation and marketing efforts to maintain market share. To mitigate these restraints, companies are focusing on eco-friendly alternatives, such as compostable pods, and are increasingly adopting sustainable sourcing practices to appeal to the environmentally conscious consumer. Segment-wise, we can expect continued strong performance in premium coffee pods, followed by a steady growth in organic and fair-trade options. The market is anticipated to witness regional variations with high-growth potential in urban areas and regions with a strong coffee culture.
USA Coffee Pods and Capsules Industry Company Market Share
USA Coffee Pods and Capsules Industry Report: 2019-2033
This comprehensive report provides an in-depth analysis of the USA coffee pods and capsules industry, offering actionable insights for industry professionals and investors. Covering the period from 2019 to 2033, with a focus on 2025, this report unravels market dynamics, competitive landscapes, and future growth potential. The report incorporates data and analysis to provide a clear understanding of the market's current state and future trajectory. Estimated market values are expressed in millions.
USA Coffee Pods and Capsules Industry Market Structure & Innovation Trends
This section analyzes the market concentration, innovation drivers, regulatory landscape, product substitutes, end-user demographics, and merger and acquisition (M&A) activities within the US coffee pods and capsules industry. The highly fragmented market is dominated by key players, including Keurig Dr Pepper Inc., Nestle SA, and Starbucks Corporation, who collectively hold approximately xx% of the market share in 2025. However, smaller players and private labels also hold significant niche markets.
- Market Concentration: High fragmentation with key players holding xx% of market share in 2025.
- Innovation Drivers: Growing consumer demand for convenience, premium coffee experiences, and sustainable packaging are driving innovation.
- Regulatory Frameworks: FDA regulations concerning food safety and labeling significantly impact the industry.
- Product Substitutes: Whole bean coffee, ground coffee, and instant coffee represent key substitutes.
- End-User Demographics: Millennials and Gen Z are key consumers driving demand for premium and convenient coffee options.
- M&A Activities: Significant M&A activity has been observed, including Nestle's acquisition of Seattle's Best Coffee (October 2022), showcasing industry consolidation trends. Total M&A deal value in the last five years is estimated at $xx Million.
USA Coffee Pods and Capsules Industry Market Dynamics & Trends
The US coffee pods and capsules market is experiencing robust growth, driven by several factors. The convenience offered by single-serve coffee pods and capsules, coupled with the increasing demand for premium coffee experiences, is fueling market expansion. Technological advancements, such as improved brewing technology and sustainable packaging solutions, further contribute to growth. The market is also witnessing a shift in consumer preferences towards organic, fair-trade, and ethically sourced coffee. The CAGR for the forecast period (2025-2033) is estimated at xx%, with market penetration expected to reach xx% by 2033. Competitive dynamics are characterized by intense rivalry among major players, with a focus on product differentiation, branding, and distribution channels.
Dominant Regions & Segments in USA Coffee Pods and Capsules Industry
The coffee pod and capsule market demonstrates significant regional variation in consumption patterns across the United States. While data suggests national penetration is widespread, specific regions show higher per capita consumption. This may be linked to factors such as demographics, disposable income levels, and the prevalence of coffee culture.
- Key Drivers:
- Higher disposable incomes in certain regions.
- Strong coffee culture in specific areas.
- Availability of diverse product offerings.
- Effective marketing and distribution strategies.
The dominance of specific segments varies. For instance, the single-serve segment is a dominant player in this market driven by high demand for convenience and ease of use.
USA Coffee Pods and Capsules Industry Product Innovations
Recent product innovations include the launch of new coffee blends, the introduction of sustainable and compostable pods, and the development of smart brewing systems. These advancements aim to enhance the overall consumer experience by offering a wider variety of flavors, improved convenience, and environmentally friendly options. The market is witnessing a notable trend towards premiumization, with manufacturers launching high-end coffee blends and innovative brewing technologies.
Report Scope & Segmentation Analysis
This report segments the USA coffee pods and capsules market based on product type (e.g., K-Cup pods, Nespresso capsules, other formats), coffee type (e.g., regular, decaf, flavored), distribution channel (e.g., online, retail), and end-user (e.g., home, office). Each segment exhibits unique growth trajectories and competitive landscapes. For example, the K-Cup pod segment is projected to witness significant growth due to its wide availability and brand recognition. Market sizes for each segment are provided in the full report, along with detailed competitive analyses.
Key Drivers of USA Coffee Pods and Capsules Industry Growth
Several factors drive growth in the US coffee pods and capsules market. The rising popularity of single-serve coffee brewing systems contributes significantly, offering convenience to busy consumers. Technological advancements in brewing technology and pod design are enhancing the quality and variety of coffee available. Moreover, the increasing demand for premium and specialty coffee, along with the expansion of distribution channels, is fueling market expansion. Finally, strategic marketing initiatives by key players are creating greater consumer awareness and brand loyalty.
Challenges in the USA Coffee Pods and Capsules Industry Sector
The industry faces several challenges, including increasing competition, concerns regarding the environmental impact of single-use pods, and fluctuations in raw material prices. The high initial investment required for setting up manufacturing units may deter entry for small and medium-sized companies. Further, changing consumer preferences towards sustainable and ethical sourcing add pressure to adapt production processes and sourcing practices. These factors potentially constrain market growth if not addressed strategically.
Emerging Opportunities in USA Coffee Pods and Capsules Industry
The market presents significant opportunities for growth. The increasing demand for organic and sustainable coffee offers a chance for companies to capture market share by offering eco-friendly products. The growing interest in unique coffee flavors and blends opens avenues for product diversification. Furthermore, expansion into new retail channels and geographic areas, such as online and emerging markets, presents further opportunities for market expansion.
Leading Players in the USA Coffee Pods and Capsules Industry Market
- Keurig Dr Pepper Inc
- Nestle SA
- The Kraft Heinz Company
- Starbucks Corporation
- Luigi Lavazza SpA
- JAB Holding Company
- Baronet Coffee
- The J M Smucker Company
- DD IP Holder LLC (Dunkin' Brands Group Inc)
- Tim Hortons
- List Not Exhaustive
Key Developments in USA Coffee Pods and Capsules Industry
- July 2022: Keurig Dr Pepper launched Intelligentsia coffee in K-Cup pods, capitalizing on the growing demand for specialty coffee.
- October 2022: Nestlé acquired Seattle's Best Coffee from Starbucks, expanding its K-Cup pod offerings.
- April 2023: Nespresso and Starbucks launched a limited-edition "Nespresso Starbucks Reserve Remix Blend" capsule, showcasing a strategic collaboration.
Future Outlook for USA Coffee Pods and Capsules Industry Market
The US coffee pods and capsules market is poised for continued growth, driven by consumer demand for convenience and premium coffee experiences. Innovation in sustainable packaging and brewing technology will play a crucial role in shaping the future market landscape. Strategic partnerships and mergers and acquisitions are expected to continue, leading to further industry consolidation. The market is projected to reach $xx Million by 2033, presenting lucrative opportunities for both established players and new entrants.
USA Coffee Pods and Capsules Industry Segmentation
-
1. Type
- 1.1. Pods
- 1.2. Capsules
-
2. Distribution Channel
-
2.1. Off-Trade
- 2.1.1. Supermarkets/Hypermarkets
- 2.1.2. Specialty Stores
- 2.1.3. Convenience/Grocery Stores
- 2.1.4. Online Retail Stores
- 2.2. On-Trade
-
2.1. Off-Trade
USA Coffee Pods and Capsules Industry Segmentation By Geography
-
1. North America
- 1.1. United States
- 1.2. Canada
- 1.3. Mexico
-
2. South America
- 2.1. Brazil
- 2.2. Argentina
- 2.3. Rest of South America
-
3. Europe
- 3.1. United Kingdom
- 3.2. Germany
- 3.3. France
- 3.4. Italy
- 3.5. Spain
- 3.6. Russia
- 3.7. Benelux
- 3.8. Nordics
- 3.9. Rest of Europe
-
4. Middle East & Africa
- 4.1. Turkey
- 4.2. Israel
- 4.3. GCC
- 4.4. North Africa
- 4.5. South Africa
- 4.6. Rest of Middle East & Africa
-
5. Asia Pacific
- 5.1. China
- 5.2. India
- 5.3. Japan
- 5.4. South Korea
- 5.5. ASEAN
- 5.6. Oceania
- 5.7. Rest of Asia Pacific
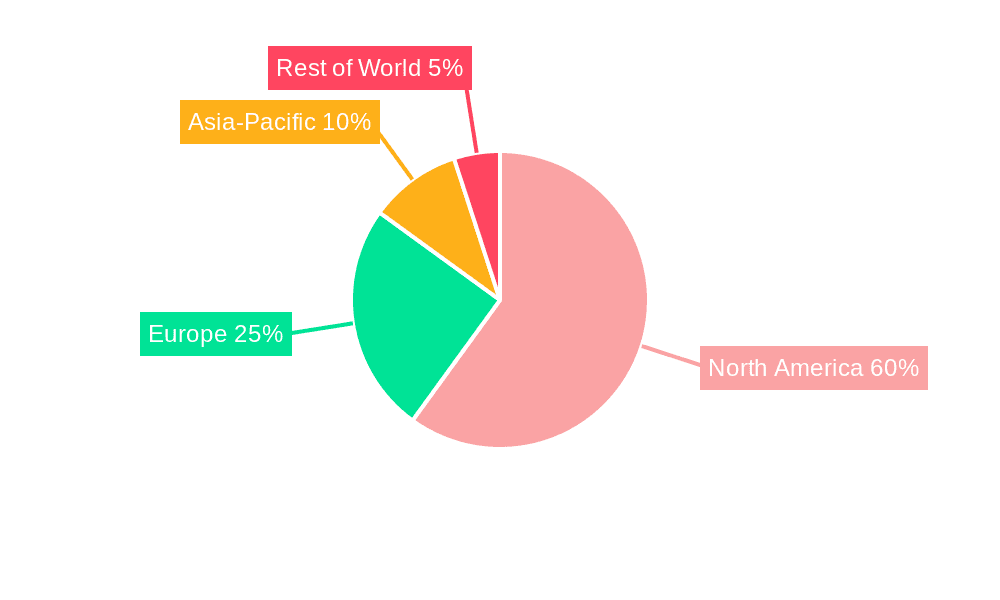
USA Coffee Pods and Capsules Industry Regional Market Share
Geographic Coverage of USA Coffee Pods and Capsules Industry
USA Coffee Pods and Capsules Industry REPORT HIGHLIGHTS
| Aspects | Details |
|---|---|
| Study Period | 2020-2034 |
| Base Year | 2025 |
| Estimated Year | 2026 |
| Forecast Period | 2026-2034 |
| Historical Period | 2020-2025 |
| Growth Rate | CAGR of 3.76% from 2020-2034 |
| Segmentation |
|
Table of Contents
- 1. Introduction
- 1.1. Research Scope
- 1.2. Market Segmentation
- 1.3. Research Methodology
- 1.4. Definitions and Assumptions
- 2. Executive Summary
- 2.1. Introduction
- 3. Market Dynamics
- 3.1. Introduction
- 3.2. Market Drivers
- 3.2.1. Increasing Usage of Single-Serve Coffee in Households; Expanding Popularity of Specialty and Organic Coffee Pods and Capsules
- 3.3. Market Restrains
- 3.3.1. Increasing Usage of Single-Serve Coffee in Households; Expanding Popularity of Specialty and Organic Coffee Pods and Capsules
- 3.4. Market Trends
- 3.4.1. Increasing Usage of Single-serve Coffee in Households
- 4. Market Factor Analysis
- 4.1. Porters Five Forces
- 4.2. Supply/Value Chain
- 4.3. PESTEL analysis
- 4.4. Market Entropy
- 4.5. Patent/Trademark Analysis
- 5. Global USA Coffee Pods and Capsules Industry Analysis, Insights and Forecast, 2020-2032
- 5.1. Market Analysis, Insights and Forecast - by Type
- 5.1.1. Pods
- 5.1.2. Capsules
- 5.2. Market Analysis, Insights and Forecast - by Distribution Channel
- 5.2.1. Off-Trade
- 5.2.1.1. Supermarkets/Hypermarkets
- 5.2.1.2. Specialty Stores
- 5.2.1.3. Convenience/Grocery Stores
- 5.2.1.4. Online Retail Stores
- 5.2.2. On-Trade
- 5.2.1. Off-Trade
- 5.3. Market Analysis, Insights and Forecast - by Region
- 5.3.1. North America
- 5.3.2. South America
- 5.3.3. Europe
- 5.3.4. Middle East & Africa
- 5.3.5. Asia Pacific
- 5.1. Market Analysis, Insights and Forecast - by Type
- 6. North America USA Coffee Pods and Capsules Industry Analysis, Insights and Forecast, 2020-2032
- 6.1. Market Analysis, Insights and Forecast - by Type
- 6.1.1. Pods
- 6.1.2. Capsules
- 6.2. Market Analysis, Insights and Forecast - by Distribution Channel
- 6.2.1. Off-Trade
- 6.2.1.1. Supermarkets/Hypermarkets
- 6.2.1.2. Specialty Stores
- 6.2.1.3. Convenience/Grocery Stores
- 6.2.1.4. Online Retail Stores
- 6.2.2. On-Trade
- 6.2.1. Off-Trade
- 6.1. Market Analysis, Insights and Forecast - by Type
- 7. South America USA Coffee Pods and Capsules Industry Analysis, Insights and Forecast, 2020-2032
- 7.1. Market Analysis, Insights and Forecast - by Type
- 7.1.1. Pods
- 7.1.2. Capsules
- 7.2. Market Analysis, Insights and Forecast - by Distribution Channel
- 7.2.1. Off-Trade
- 7.2.1.1. Supermarkets/Hypermarkets
- 7.2.1.2. Specialty Stores
- 7.2.1.3. Convenience/Grocery Stores
- 7.2.1.4. Online Retail Stores
- 7.2.2. On-Trade
- 7.2.1. Off-Trade
- 7.1. Market Analysis, Insights and Forecast - by Type
- 8. Europe USA Coffee Pods and Capsules Industry Analysis, Insights and Forecast, 2020-2032
- 8.1. Market Analysis, Insights and Forecast - by Type
- 8.1.1. Pods
- 8.1.2. Capsules
- 8.2. Market Analysis, Insights and Forecast - by Distribution Channel
- 8.2.1. Off-Trade
- 8.2.1.1. Supermarkets/Hypermarkets
- 8.2.1.2. Specialty Stores
- 8.2.1.3. Convenience/Grocery Stores
- 8.2.1.4. Online Retail Stores
- 8.2.2. On-Trade
- 8.2.1. Off-Trade
- 8.1. Market Analysis, Insights and Forecast - by Type
- 9. Middle East & Africa USA Coffee Pods and Capsules Industry Analysis, Insights and Forecast, 2020-2032
- 9.1. Market Analysis, Insights and Forecast - by Type
- 9.1.1. Pods
- 9.1.2. Capsules
- 9.2. Market Analysis, Insights and Forecast - by Distribution Channel
- 9.2.1. Off-Trade
- 9.2.1.1. Supermarkets/Hypermarkets
- 9.2.1.2. Specialty Stores
- 9.2.1.3. Convenience/Grocery Stores
- 9.2.1.4. Online Retail Stores
- 9.2.2. On-Trade
- 9.2.1. Off-Trade
- 9.1. Market Analysis, Insights and Forecast - by Type
- 10. Asia Pacific USA Coffee Pods and Capsules Industry Analysis, Insights and Forecast, 2020-2032
- 10.1. Market Analysis, Insights and Forecast - by Type
- 10.1.1. Pods
- 10.1.2. Capsules
- 10.2. Market Analysis, Insights and Forecast - by Distribution Channel
- 10.2.1. Off-Trade
- 10.2.1.1. Supermarkets/Hypermarkets
- 10.2.1.2. Specialty Stores
- 10.2.1.3. Convenience/Grocery Stores
- 10.2.1.4. Online Retail Stores
- 10.2.2. On-Trade
- 10.2.1. Off-Trade
- 10.1. Market Analysis, Insights and Forecast - by Type
- 11. Competitive Analysis
- 11.1. Global Market Share Analysis 2025
- 11.2. Company Profiles
- 11.2.1 Keurig Dr Pepper Inc
- 11.2.1.1. Overview
- 11.2.1.2. Products
- 11.2.1.3. SWOT Analysis
- 11.2.1.4. Recent Developments
- 11.2.1.5. Financials (Based on Availability)
- 11.2.2 Nestle SA
- 11.2.2.1. Overview
- 11.2.2.2. Products
- 11.2.2.3. SWOT Analysis
- 11.2.2.4. Recent Developments
- 11.2.2.5. Financials (Based on Availability)
- 11.2.3 The Kraft Heinz Company
- 11.2.3.1. Overview
- 11.2.3.2. Products
- 11.2.3.3. SWOT Analysis
- 11.2.3.4. Recent Developments
- 11.2.3.5. Financials (Based on Availability)
- 11.2.4 Starbucks Corporation
- 11.2.4.1. Overview
- 11.2.4.2. Products
- 11.2.4.3. SWOT Analysis
- 11.2.4.4. Recent Developments
- 11.2.4.5. Financials (Based on Availability)
- 11.2.5 Luigi Lavazza SpA
- 11.2.5.1. Overview
- 11.2.5.2. Products
- 11.2.5.3. SWOT Analysis
- 11.2.5.4. Recent Developments
- 11.2.5.5. Financials (Based on Availability)
- 11.2.6 JAB Holding Company
- 11.2.6.1. Overview
- 11.2.6.2. Products
- 11.2.6.3. SWOT Analysis
- 11.2.6.4. Recent Developments
- 11.2.6.5. Financials (Based on Availability)
- 11.2.7 Baronet Coffee
- 11.2.7.1. Overview
- 11.2.7.2. Products
- 11.2.7.3. SWOT Analysis
- 11.2.7.4. Recent Developments
- 11.2.7.5. Financials (Based on Availability)
- 11.2.8 The J M Smucker Company
- 11.2.8.1. Overview
- 11.2.8.2. Products
- 11.2.8.3. SWOT Analysis
- 11.2.8.4. Recent Developments
- 11.2.8.5. Financials (Based on Availability)
- 11.2.9 DD IP Holder LLC (Dunkin' Brands Group Inc )
- 11.2.9.1. Overview
- 11.2.9.2. Products
- 11.2.9.3. SWOT Analysis
- 11.2.9.4. Recent Developments
- 11.2.9.5. Financials (Based on Availability)
- 11.2.10 Tim Hortons*List Not Exhaustive
- 11.2.10.1. Overview
- 11.2.10.2. Products
- 11.2.10.3. SWOT Analysis
- 11.2.10.4. Recent Developments
- 11.2.10.5. Financials (Based on Availability)
- 11.2.1 Keurig Dr Pepper Inc
List of Figures
- Figure 1: Global USA Coffee Pods and Capsules Industry Revenue Breakdown (Million, %) by Region 2025 & 2033
- Figure 2: North America USA Coffee Pods and Capsules Industry Revenue (Million), by Type 2025 & 2033
- Figure 3: North America USA Coffee Pods and Capsules Industry Revenue Share (%), by Type 2025 & 2033
- Figure 4: North America USA Coffee Pods and Capsules Industry Revenue (Million), by Distribution Channel 2025 & 2033
- Figure 5: North America USA Coffee Pods and Capsules Industry Revenue Share (%), by Distribution Channel 2025 & 2033
- Figure 6: North America USA Coffee Pods and Capsules Industry Revenue (Million), by Country 2025 & 2033
- Figure 7: North America USA Coffee Pods and Capsules Industry Revenue Share (%), by Country 2025 & 2033
- Figure 8: South America USA Coffee Pods and Capsules Industry Revenue (Million), by Type 2025 & 2033
- Figure 9: South America USA Coffee Pods and Capsules Industry Revenue Share (%), by Type 2025 & 2033
- Figure 10: South America USA Coffee Pods and Capsules Industry Revenue (Million), by Distribution Channel 2025 & 2033
- Figure 11: South America USA Coffee Pods and Capsules Industry Revenue Share (%), by Distribution Channel 2025 & 2033
- Figure 12: South America USA Coffee Pods and Capsules Industry Revenue (Million), by Country 2025 & 2033
- Figure 13: South America USA Coffee Pods and Capsules Industry Revenue Share (%), by Country 2025 & 2033
- Figure 14: Europe USA Coffee Pods and Capsules Industry Revenue (Million), by Type 2025 & 2033
- Figure 15: Europe USA Coffee Pods and Capsules Industry Revenue Share (%), by Type 2025 & 2033
- Figure 16: Europe USA Coffee Pods and Capsules Industry Revenue (Million), by Distribution Channel 2025 & 2033
- Figure 17: Europe USA Coffee Pods and Capsules Industry Revenue Share (%), by Distribution Channel 2025 & 2033
- Figure 18: Europe USA Coffee Pods and Capsules Industry Revenue (Million), by Country 2025 & 2033
- Figure 19: Europe USA Coffee Pods and Capsules Industry Revenue Share (%), by Country 2025 & 2033
- Figure 20: Middle East & Africa USA Coffee Pods and Capsules Industry Revenue (Million), by Type 2025 & 2033
- Figure 21: Middle East & Africa USA Coffee Pods and Capsules Industry Revenue Share (%), by Type 2025 & 2033
- Figure 22: Middle East & Africa USA Coffee Pods and Capsules Industry Revenue (Million), by Distribution Channel 2025 & 2033
- Figure 23: Middle East & Africa USA Coffee Pods and Capsules Industry Revenue Share (%), by Distribution Channel 2025 & 2033
- Figure 24: Middle East & Africa USA Coffee Pods and Capsules Industry Revenue (Million), by Country 2025 & 2033
- Figure 25: Middle East & Africa USA Coffee Pods and Capsules Industry Revenue Share (%), by Country 2025 & 2033
- Figure 26: Asia Pacific USA Coffee Pods and Capsules Industry Revenue (Million), by Type 2025 & 2033
- Figure 27: Asia Pacific USA Coffee Pods and Capsules Industry Revenue Share (%), by Type 2025 & 2033
- Figure 28: Asia Pacific USA Coffee Pods and Capsules Industry Revenue (Million), by Distribution Channel 2025 & 2033
- Figure 29: Asia Pacific USA Coffee Pods and Capsules Industry Revenue Share (%), by Distribution Channel 2025 & 2033
- Figure 30: Asia Pacific USA Coffee Pods and Capsules Industry Revenue (Million), by Country 2025 & 2033
- Figure 31: Asia Pacific USA Coffee Pods and Capsules Industry Revenue Share (%), by Country 2025 & 2033
List of Tables
- Table 1: Global USA Coffee Pods and Capsules Industry Revenue Million Forecast, by Type 2020 & 2033
- Table 2: Global USA Coffee Pods and Capsules Industry Revenue Million Forecast, by Distribution Channel 2020 & 2033
- Table 3: Global USA Coffee Pods and Capsules Industry Revenue Million Forecast, by Region 2020 & 2033
- Table 4: Global USA Coffee Pods and Capsules Industry Revenue Million Forecast, by Type 2020 & 2033
- Table 5: Global USA Coffee Pods and Capsules Industry Revenue Million Forecast, by Distribution Channel 2020 & 2033
- Table 6: Global USA Coffee Pods and Capsules Industry Revenue Million Forecast, by Country 2020 & 2033
- Table 7: United States USA Coffee Pods and Capsules Industry Revenue (Million) Forecast, by Application 2020 & 2033
- Table 8: Canada USA Coffee Pods and Capsules Industry Revenue (Million) Forecast, by Application 2020 & 2033
- Table 9: Mexico USA Coffee Pods and Capsules Industry Revenue (Million) Forecast, by Application 2020 & 2033
- Table 10: Global USA Coffee Pods and Capsules Industry Revenue Million Forecast, by Type 2020 & 2033
- Table 11: Global USA Coffee Pods and Capsules Industry Revenue Million Forecast, by Distribution Channel 2020 & 2033
- Table 12: Global USA Coffee Pods and Capsules Industry Revenue Million Forecast, by Country 2020 & 2033
- Table 13: Brazil USA Coffee Pods and Capsules Industry Revenue (Million) Forecast, by Application 2020 & 2033
- Table 14: Argentina USA Coffee Pods and Capsules Industry Revenue (Million) Forecast, by Application 2020 & 2033
- Table 15: Rest of South America USA Coffee Pods and Capsules Industry Revenue (Million) Forecast, by Application 2020 & 2033
- Table 16: Global USA Coffee Pods and Capsules Industry Revenue Million Forecast, by Type 2020 & 2033
- Table 17: Global USA Coffee Pods and Capsules Industry Revenue Million Forecast, by Distribution Channel 2020 & 2033
- Table 18: Global USA Coffee Pods and Capsules Industry Revenue Million Forecast, by Country 2020 & 2033
- Table 19: United Kingdom USA Coffee Pods and Capsules Industry Revenue (Million) Forecast, by Application 2020 & 2033
- Table 20: Germany USA Coffee Pods and Capsules Industry Revenue (Million) Forecast, by Application 2020 & 2033
- Table 21: France USA Coffee Pods and Capsules Industry Revenue (Million) Forecast, by Application 2020 & 2033
- Table 22: Italy USA Coffee Pods and Capsules Industry Revenue (Million) Forecast, by Application 2020 & 2033
- Table 23: Spain USA Coffee Pods and Capsules Industry Revenue (Million) Forecast, by Application 2020 & 2033
- Table 24: Russia USA Coffee Pods and Capsules Industry Revenue (Million) Forecast, by Application 2020 & 2033
- Table 25: Benelux USA Coffee Pods and Capsules Industry Revenue (Million) Forecast, by Application 2020 & 2033
- Table 26: Nordics USA Coffee Pods and Capsules Industry Revenue (Million) Forecast, by Application 2020 & 2033
- Table 27: Rest of Europe USA Coffee Pods and Capsules Industry Revenue (Million) Forecast, by Application 2020 & 2033
- Table 28: Global USA Coffee Pods and Capsules Industry Revenue Million Forecast, by Type 2020 & 2033
- Table 29: Global USA Coffee Pods and Capsules Industry Revenue Million Forecast, by Distribution Channel 2020 & 2033
- Table 30: Global USA Coffee Pods and Capsules Industry Revenue Million Forecast, by Country 2020 & 2033
- Table 31: Turkey USA Coffee Pods and Capsules Industry Revenue (Million) Forecast, by Application 2020 & 2033
- Table 32: Israel USA Coffee Pods and Capsules Industry Revenue (Million) Forecast, by Application 2020 & 2033
- Table 33: GCC USA Coffee Pods and Capsules Industry Revenue (Million) Forecast, by Application 2020 & 2033
- Table 34: North Africa USA Coffee Pods and Capsules Industry Revenue (Million) Forecast, by Application 2020 & 2033
- Table 35: South Africa USA Coffee Pods and Capsules Industry Revenue (Million) Forecast, by Application 2020 & 2033
- Table 36: Rest of Middle East & Africa USA Coffee Pods and Capsules Industry Revenue (Million) Forecast, by Application 2020 & 2033
- Table 37: Global USA Coffee Pods and Capsules Industry Revenue Million Forecast, by Type 2020 & 2033
- Table 38: Global USA Coffee Pods and Capsules Industry Revenue Million Forecast, by Distribution Channel 2020 & 2033
- Table 39: Global USA Coffee Pods and Capsules Industry Revenue Million Forecast, by Country 2020 & 2033
- Table 40: China USA Coffee Pods and Capsules Industry Revenue (Million) Forecast, by Application 2020 & 2033
- Table 41: India USA Coffee Pods and Capsules Industry Revenue (Million) Forecast, by Application 2020 & 2033
- Table 42: Japan USA Coffee Pods and Capsules Industry Revenue (Million) Forecast, by Application 2020 & 2033
- Table 43: South Korea USA Coffee Pods and Capsules Industry Revenue (Million) Forecast, by Application 2020 & 2033
- Table 44: ASEAN USA Coffee Pods and Capsules Industry Revenue (Million) Forecast, by Application 2020 & 2033
- Table 45: Oceania USA Coffee Pods and Capsules Industry Revenue (Million) Forecast, by Application 2020 & 2033
- Table 46: Rest of Asia Pacific USA Coffee Pods and Capsules Industry Revenue (Million) Forecast, by Application 2020 & 2033
Frequently Asked Questions
1. What is the projected Compound Annual Growth Rate (CAGR) of the USA Coffee Pods and Capsules Industry?
The projected CAGR is approximately 3.76%.
2. Which companies are prominent players in the USA Coffee Pods and Capsules Industry?
Key companies in the market include Keurig Dr Pepper Inc, Nestle SA, The Kraft Heinz Company, Starbucks Corporation, Luigi Lavazza SpA, JAB Holding Company, Baronet Coffee, The J M Smucker Company, DD IP Holder LLC (Dunkin' Brands Group Inc ), Tim Hortons*List Not Exhaustive.
3. What are the main segments of the USA Coffee Pods and Capsules Industry?
The market segments include Type, Distribution Channel.
4. Can you provide details about the market size?
The market size is estimated to be USD XX Million as of 2022.
5. What are some drivers contributing to market growth?
Increasing Usage of Single-Serve Coffee in Households; Expanding Popularity of Specialty and Organic Coffee Pods and Capsules.
6. What are the notable trends driving market growth?
Increasing Usage of Single-serve Coffee in Households.
7. Are there any restraints impacting market growth?
Increasing Usage of Single-Serve Coffee in Households; Expanding Popularity of Specialty and Organic Coffee Pods and Capsules.
8. Can you provide examples of recent developments in the market?
April 2023: Nestle's coffee brand Nespresso and Starbucks partnered to launch the 'Nespresso Starbucks Reserve Remix Blend,' a new limited-edition double espresso coffee capsule. The product initially retailed online, as well as at a few Nespresso boutiques and Starbucks Reserve Roasteries, and in select Reserve locations around the United States and the United Kingdom.
9. What pricing options are available for accessing the report?
Pricing options include single-user, multi-user, and enterprise licenses priced at USD 3800, USD 4500, and USD 5800 respectively.
10. Is the market size provided in terms of value or volume?
The market size is provided in terms of value, measured in Million.
11. Are there any specific market keywords associated with the report?
Yes, the market keyword associated with the report is "USA Coffee Pods and Capsules Industry," which aids in identifying and referencing the specific market segment covered.
12. How do I determine which pricing option suits my needs best?
The pricing options vary based on user requirements and access needs. Individual users may opt for single-user licenses, while businesses requiring broader access may choose multi-user or enterprise licenses for cost-effective access to the report.
13. Are there any additional resources or data provided in the USA Coffee Pods and Capsules Industry report?
While the report offers comprehensive insights, it's advisable to review the specific contents or supplementary materials provided to ascertain if additional resources or data are available.
14. How can I stay updated on further developments or reports in the USA Coffee Pods and Capsules Industry?
To stay informed about further developments, trends, and reports in the USA Coffee Pods and Capsules Industry, consider subscribing to industry newsletters, following relevant companies and organizations, or regularly checking reputable industry news sources and publications.
Methodology
Step 1 - Identification of Relevant Samples Size from Population Database


Step 2 - Approaches for Defining Global Market Size (Value, Volume* & Price*)

Note*: In applicable scenarios
Step 3 - Data Sources
Primary Research
- Web Analytics
- Survey Reports
- Research Institute
- Latest Research Reports
- Opinion Leaders
Secondary Research
- Annual Reports
- White Paper
- Latest Press Release
- Industry Association
- Paid Database
- Investor Presentations

Step 4 - Data Triangulation
Involves using different sources of information in order to increase the validity of a study
These sources are likely to be stakeholders in a program - participants, other researchers, program staff, other community members, and so on.
Then we put all data in single framework & apply various statistical tools to find out the dynamic on the market.
During the analysis stage, feedback from the stakeholder groups would be compared to determine areas of agreement as well as areas of divergence