

Key Insights
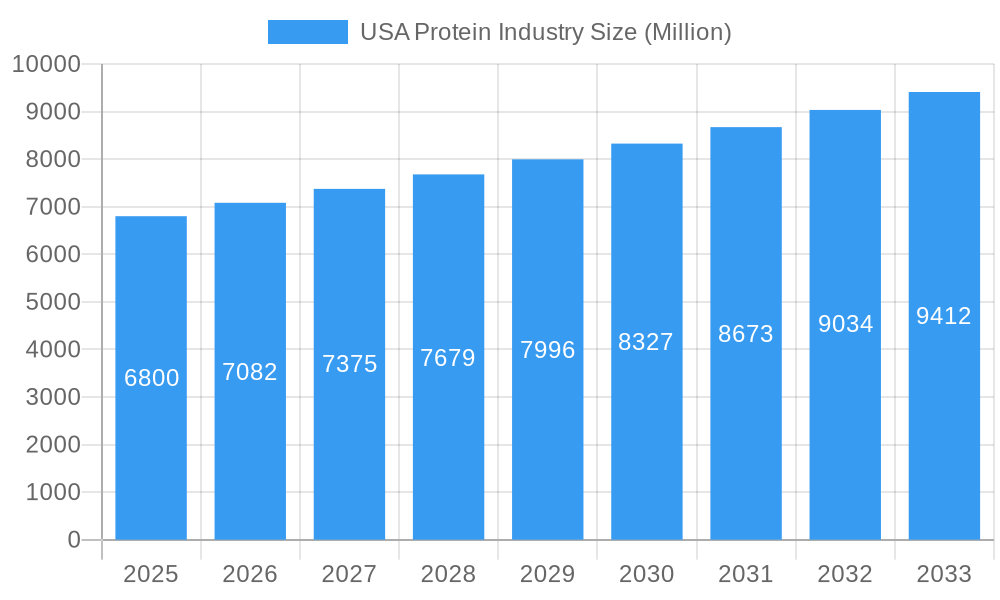
The USA Protein Industry is poised for significant expansion, projecting a market size of USD 6.8 billion in 2025 with a compound annual growth rate (CAGR) of 4.21% from 2019 to 2033. This robust growth is propelled by an increasing consumer demand for protein-rich foods and supplements, driven by heightened health and wellness awareness. The surging popularity of plant-based diets and the growing focus on sports nutrition are key catalysts, encouraging manufacturers to innovate and expand their product portfolios. Furthermore, the rising awareness of the health benefits associated with animal-derived proteins, such as whey and casein, continues to bolster their market presence. The industry is experiencing a dynamic shift towards sustainable sourcing and the development of novel protein ingredients, catering to a discerning consumer base that prioritizes both health and environmental impact.
USA Protein Industry Market Size (In Billion)
The market's trajectory is further shaped by evolving consumer preferences for specific protein types. Within the animal protein segment, whey protein remains a dominant force due to its widespread use in sports nutrition and its perceived health benefits. Casein and caseinates also hold a strong position, particularly in functional food applications. The plant-based protein segment is witnessing substantial growth, with pea protein and soy protein emerging as leading alternatives, driven by their versatility and allergen-friendly profiles. Emerging protein sources like insect protein are also gaining traction, reflecting a growing interest in sustainable and novel ingredients. The industry's expansion is also supported by advancements in processing technologies that enhance protein bioavailability and functionality, paving the way for broader applications across food and beverages, personal care, and animal feed.
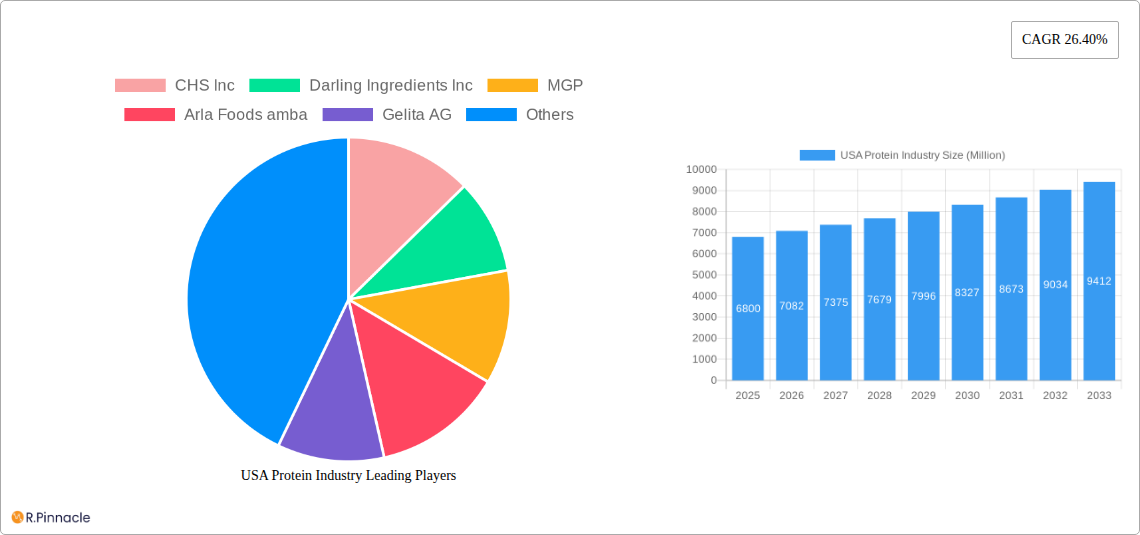
USA Protein Industry Company Market Share
USA Protein Industry Market Research Report: Trends, Dynamics, and Growth Projections (2019–2033)
This comprehensive report provides an in-depth analysis of the United States protein industry, covering market structure, dynamics, segmentation, innovations, and future outlook from 2019 to 2033. Leverage actionable insights and data-driven forecasts to navigate this rapidly evolving market.
USA Protein Industry Market Structure & Innovation Trends
The USA protein industry exhibits a moderately consolidated market structure, with key players like Archer Daniels Midland Company, Glanbia PLC, and Ingredion Incorporated holding significant market share. Innovation is a primary driver, fueled by increasing consumer demand for healthier and sustainable protein sources. Regulatory frameworks, such as FDA guidelines for food additives and GRAS status for novel proteins, shape product development and market entry. Product substitutes are abundant, ranging from traditional animal proteins to emerging plant-based and microbial alternatives, intensifying competition. End-user demographics are diverse, encompassing health-conscious consumers, athletes, the elderly, and the animal feed sector. Mergers and acquisitions (M&A) are prevalent, with estimated deal values in the billions, aimed at expanding product portfolios, geographic reach, and technological capabilities. The market is characterized by a growing focus on value-added protein ingredients and functional benefits, driving investment in research and development.
USA Protein Industry Market Dynamics & Trends
The USA protein industry is poised for substantial growth, driven by a confluence of powerful market dynamics. A primary growth catalyst is the escalating consumer awareness regarding the health benefits associated with adequate protein intake, including muscle building, satiety, and overall well-being. This trend is further amplified by the burgeoning sports nutrition and active lifestyle segments, where performance and recovery are paramount. The increasing prevalence of chronic diseases and an aging population also contribute to a higher demand for specialized nutritional products, including those enriched with proteins.
Technological disruptions are profoundly reshaping the industry. Advancements in protein extraction, purification, and processing technologies are enabling the development of novel protein ingredients with improved functionality, digestibility, and sensory profiles. This includes sophisticated methods for isolating proteins from unconventional sources like microalgae and insects, and enhanced techniques for processing plant-based proteins to overcome taste and texture challenges. The rise of biotechnology is also playing a crucial role in developing genetically modified ingredients for enhanced protein content and specific functional attributes.
Consumer preferences are in a state of rapid evolution. There is a pronounced shift towards plant-based diets, driven by ethical, environmental, and health concerns. This has led to a surge in demand for proteins derived from sources like peas, soy, hemp, and rice, spurring innovation in formulating these proteins into appealing food and beverage products. Simultaneously, clean label trends are gaining traction, with consumers seeking proteins with minimal processing and natural ingredients. Transparency in sourcing and production is becoming increasingly important, influencing brand loyalty and purchasing decisions.
Competitive dynamics within the USA protein industry are intensifying. Established ingredient manufacturers are diversifying their offerings to include plant-based and alternative protein solutions, while agile startups are capturing niche markets with innovative products. Collaborations and partnerships between ingredient suppliers, food manufacturers, and research institutions are becoming commonplace to accelerate product development and market penetration. The market penetration of novel protein sources is steadily increasing, though traditional animal proteins, particularly whey and casein, continue to hold a dominant position in many applications due to their established functional properties and consumer familiarity. The projected CAGR for the USA protein industry is anticipated to be in the range of 6-8% over the forecast period, driven by these multifaceted dynamics.
Dominant Regions & Segments in USA Protein Industry
The United States, as a single country, represents the dominant region within the North American protein industry, driven by its large consumer base, high disposable income, and robust food and beverage manufacturing sector. Within the USA, the Food and Beverages segment exhibits the strongest dominance, further subdivided by its extensive array of sub-end users.
Dominance Drivers in Food and Beverages:
- Consumer Demand for Health & Wellness: A pervasive trend towards healthier eating habits fuels the demand for protein-enriched products across all meal occasions and categories.
- Product Versatility: Protein ingredients are highly versatile, finding applications in a vast range of products from baked goods and dairy alternatives to meat substitutes and snacks.
- Innovation in Product Development: Food manufacturers are continuously innovating, creating new and exciting protein-fortified products that cater to evolving consumer tastes and dietary preferences.
- Growth of Meat Alternatives: The rapid expansion of the plant-based meat substitute market is a significant contributor to the dominance of the Food and Beverages segment.
Dominant Sub-End Users within Food and Beverages:
- Meat/Poultry/Seafood and Meat Alternative Products: This sub-segment is experiencing explosive growth, with plant-based and blended protein options gaining substantial market share. Companies are actively developing protein solutions that mimic the taste, texture, and nutritional profile of traditional animal products.
- Dairy and Dairy Alternative Products: Protein fortification is a key trend in both traditional dairy and the burgeoning dairy-alternative market, with consumers seeking enhanced protein content for muscle health and satiety.
- Supplements (Sport/Performance Nutrition): This segment remains a cornerstone for protein demand, driven by athletes and fitness enthusiasts seeking to optimize performance and recovery. The market for whey protein, casein, and plant-based protein powders is robust.
- Snacks: Protein-enhanced snacks are increasingly popular as consumers look for convenient and filling options between meals.
Dominant Protein Sources:
- Source: Animal (By Protein Type): Whey Protein and Casein and Caseinates remain dominant due to their superior functionality, bioavailability, and established consumer trust. Gelatin also holds a significant share, particularly in confectionery and supplements.
- Source: Plant: Soy Protein continues to be a widely used and cost-effective plant-based protein. Pea Protein has emerged as a strong contender, offering a favorable amino acid profile and hypoallergenic properties. Other plant proteins like Rice and Hemp are gaining traction.
Dominant End Users:
- Food and Beverages is the overarching dominant end-user segment, influencing and driving demand across the entire protein industry.
- Supplements is another critical end-user segment, particularly for specialized protein formulations targeting sports nutrition, weight management, and medical nutrition.
The dominance of these regions and segments is supported by favorable economic policies, extensive distribution networks, and continuous investment in research and development by leading players such as Archer Daniels Midland Company, Glanbia PLC, and Ingredion Incorporated. The market penetration of these dominant segments is high, indicating widespread consumer adoption and integration into daily diets and lifestyles.
USA Protein Industry Product Innovations
Product innovations in the USA protein industry are characterized by a focus on enhancing functionality, improving taste and texture, and expanding the range of sustainable protein sources. Advancements in processing technologies are enabling the creation of novel plant-based proteins with superior amino acid profiles and reduced off-flavors. For instance, innovations in pea protein isolate processing have led to products with improved solubility and emulsification properties, making them ideal for a wider array of food and beverage applications. Companies are also developing protein blends that combine different sources to achieve optimal nutritional and functional benefits, catering to specific dietary needs and preferences. The competitive advantage lies in the ability to deliver high-quality, clean-label protein ingredients that meet consumer demand for both health and taste.
Report Scope & Segmentation Analysis
This report encompasses a detailed analysis of the USA protein industry, segmented by protein source and end-user application.
- Source Segmentation: The market is analyzed across Animal proteins (including Casein and Caseinates, Collagen, Egg Protein, Gelatin, Milk Protein, Whey Protein, and Other Animal Protein), Microbial proteins (Algae Protein, Mycoprotein), and Plant proteins (Hemp Protein, Pea Protein, Potato Protein, Rice Protein, Soy Protein, Wheat Protein, and Other Plant Protein). Projections indicate strong growth in Plant and Microbial proteins, driven by sustainability concerns and dietary trends.
- End User Segmentation: Key end-user segments include Animal Feed, Food and Beverages (further categorized into Bakery, Breakfast Cereals, Condiments/Sauces, Confectionery, Dairy and Dairy Alternative Products, Meat/Poultry/Seafood and Meat Alternative Products, RTE/RTC Food Products, and Snacks), Personal Care and Cosmetics, and Supplements (including Baby Food and Infant Formula, Elderly Nutrition and Medical Nutrition, and Sport/Performance Nutrition). The Food and Beverages segment, particularly Meat Alternatives and Dairy Alternatives, is projected to exhibit the highest growth rates.
Key Drivers of USA Protein Industry Growth
The growth of the USA protein industry is propelled by several critical drivers:
- Growing Health and Wellness Consciousness: An increasing consumer focus on personal health, fitness, and disease prevention directly fuels demand for protein-rich foods and supplements.
- Rising Popularity of Plant-Based Diets: Environmental concerns, ethical considerations, and perceived health benefits are driving significant adoption of plant-based proteins.
- Technological Advancements: Innovations in extraction, processing, and formulation are enabling the development of more palatable, functional, and diverse protein ingredients.
- Aging Population and Elderly Nutrition: The growing elderly demographic requires specialized nutritional solutions, with protein playing a vital role in maintaining muscle mass and overall health.
- Growth in Sports Nutrition: The expanding sports and fitness industry creates a consistent demand for performance-enhancing protein supplements.
Challenges in the USA Protein Industry Sector
Despite robust growth, the USA protein industry faces several challenges:
- Consumer Perception of Alternative Proteins: Overcoming taste, texture, and familiarity barriers for certain novel proteins, such as insect protein, remains a challenge.
- Supply Chain Volatility and Cost Fluctuations: The availability and cost of raw materials, particularly for plant-based proteins, can be subject to agricultural yields and global market dynamics.
- Regulatory Hurdles for Novel Ingredients: Obtaining regulatory approval for new protein sources and ingredients can be a lengthy and complex process, impacting time-to-market.
- Competition from Established Animal Proteins: Traditional animal proteins, with their established functionality and consumer acceptance, present continued competition.
- Sustainability Concerns in Production: While some alternative proteins are inherently more sustainable, the overall environmental impact of large-scale protein production, including water usage and land utilization, is a growing concern.
Emerging Opportunities in USA Protein Industry
The USA protein industry is ripe with emerging opportunities:
- Development of Sustainable and Eco-Friendly Proteins: Continued innovation in cultivating and processing proteins with minimal environmental impact, such as algae and precision fermentation-derived proteins, presents significant growth potential.
- Personalized Nutrition Solutions: Leveraging data analytics and advanced formulations to create bespoke protein products catering to individual dietary needs and health goals.
- Expansion of Protein Applications in Functional Foods: Incorporating protein into a wider range of everyday foods and beverages to offer added nutritional value and health benefits.
- Growth in Pet Food Protein Innovation: Developing high-quality, specialized protein formulations for the premium pet food market.
- Investment in Biotechnology and Fermentation: Advancements in these areas offer pathways to novel, high-quality protein ingredients with unique functional properties.
Leading Players in the USA Protein Industry Market
- CHS Inc
- Darling Ingredients Inc
- MGP
- Arla Foods amba
- Gelita AG
- AMCO Proteins
- International Flavors & Fragrances Inc
- Archer Daniels Midland Company
- Glanbia PLC
- Ajinomoto Co Inc
- Bunge Limited
- Roquette Frères
- Agropur Dairy Cooperative
- Kerry Group PLC
- Farbest-Tallman Foods Corporation
- Fonterra Co-operative Group Limited
- Ingredion Incorporated
- Corbion NV
- Südzucker Grou
Key Developments in USA Protein Industry Industry
- August 2022: Optimum Nutrition announced the launch of its new Gold Standard Protein Shake. The RTD is available in chocolate and vanilla flavors, and formulated with 24 grams of protein per serving.
- June 2022: Fonterra JV has entered into a joint venture with Tillamook country creamery association(TCCA) and a three-mile canyon farm in the United States to launch Pro-Optima TM, a grade A functional whey protein concentrate (fWPC).
- August 2021: Darling Ingredients expanded its existing manufacturing facility that includes Nebraska’s first operation dedicated solely to poultry conversion. This expanded manufacturing unit may also facilitate protein conversion.
Future Outlook for USA Protein Industry Market
The future outlook for the USA protein industry is exceptionally positive, characterized by sustained growth and diversification. The increasing consumer preference for healthier, sustainable, and ethically sourced protein options will continue to be a primary growth accelerator. Innovations in plant-based and microbial protein technologies will lead to the development of superior ingredients with improved sensory profiles and wider applications, further driving market penetration. The expanding demand for personalized nutrition and functional foods will create significant opportunities for specialized protein formulations. Strategic investments in research and development, coupled with a focus on supply chain resilience and regulatory compliance, will be crucial for companies to capitalize on these emerging trends and maintain a competitive edge in this dynamic market. The market is projected to continue its upward trajectory, with an estimated market value reaching tens of billions of dollars by 2033.
USA Protein Industry Segmentation
-
1. Source
-
1.1. Animal
-
1.1.1. By Protein Type
- 1.1.1.1. Casein and Caseinates
- 1.1.1.2. Collagen
- 1.1.1.3. Egg Protein
- 1.1.1.4. Gelatin
- 1.1.1.5. Insect Protein
- 1.1.1.6. Milk Protein
- 1.1.1.7. Whey Protein
- 1.1.1.8. Other Animal Protein
-
1.1.1. By Protein Type
-
1.2. Microbial
- 1.2.1. Algae Protein
- 1.2.2. Mycoprotein
-
1.3. Plant
- 1.3.1. Hemp Protein
- 1.3.2. Pea Protein
- 1.3.3. Potato Protein
- 1.3.4. Rice Protein
- 1.3.5. Soy Protein
- 1.3.6. Wheat Protein
- 1.3.7. Other Plant Protein
-
1.1. Animal
-
2. End User
- 2.1. Animal Feed
-
2.2. Food and Beverages
-
2.2.1. By Sub End User
- 2.2.1.1. Bakery
- 2.2.1.2. Breakfast Cereals
- 2.2.1.3. Condiments/Sauces
- 2.2.1.4. Confectionery
- 2.2.1.5. Dairy and Dairy Alternative Products
- 2.2.1.6. Meat/Poultry/Seafood and Meat Alternative Products
- 2.2.1.7. RTE/RTC Food Products
- 2.2.1.8. Snacks
-
2.2.1. By Sub End User
- 2.3. Personal Care and Cosmetics
-
2.4. Supplements
- 2.4.1. Baby Food and Infant Formula
- 2.4.2. Elderly Nutrition and Medical Nutrition
- 2.4.3. Sport/Performance Nutrition
USA Protein Industry Segmentation By Geography
-
1. North America
- 1.1. United States
- 1.2. Canada
- 1.3. Mexico
-
2. South America
- 2.1. Brazil
- 2.2. Argentina
- 2.3. Rest of South America
-
3. Europe
- 3.1. United Kingdom
- 3.2. Germany
- 3.3. France
- 3.4. Italy
- 3.5. Spain
- 3.6. Russia
- 3.7. Benelux
- 3.8. Nordics
- 3.9. Rest of Europe
-
4. Middle East & Africa
- 4.1. Turkey
- 4.2. Israel
- 4.3. GCC
- 4.4. North Africa
- 4.5. South Africa
- 4.6. Rest of Middle East & Africa
-
5. Asia Pacific
- 5.1. China
- 5.2. India
- 5.3. Japan
- 5.4. South Korea
- 5.5. ASEAN
- 5.6. Oceania
- 5.7. Rest of Asia Pacific
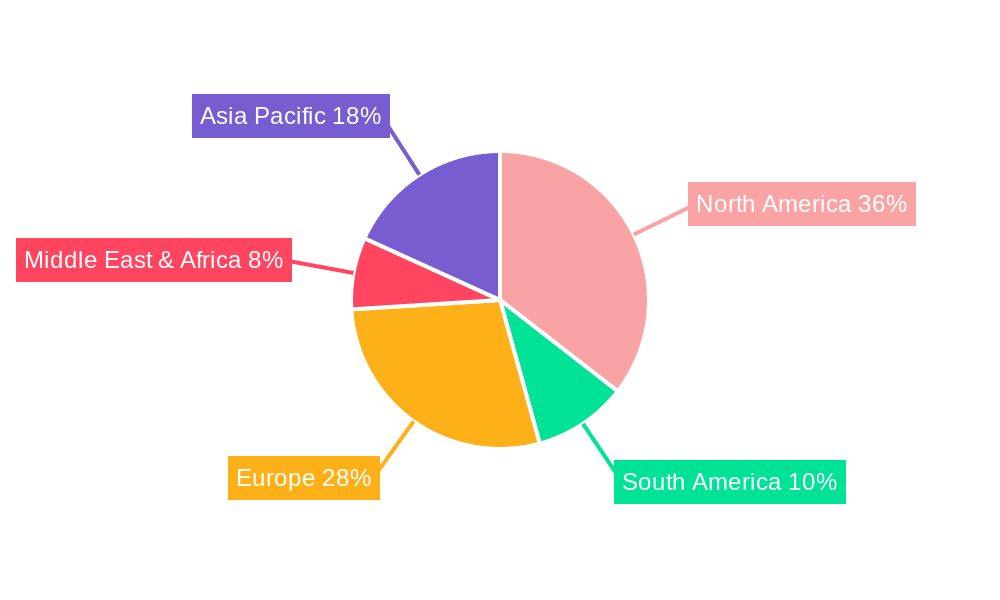
USA Protein Industry Regional Market Share
Geographic Coverage of USA Protein Industry
USA Protein Industry REPORT HIGHLIGHTS
| Aspects | Details |
|---|---|
| Study Period | 2020-2034 |
| Base Year | 2025 |
| Estimated Year | 2026 |
| Forecast Period | 2026-2034 |
| Historical Period | 2020-2025 |
| Growth Rate | CAGR of 10.3% from 2020-2034 |
| Segmentation |
|
Table of Contents
- 1. Introduction
- 1.1. Research Scope
- 1.2. Market Segmentation
- 1.3. Research Objective
- 1.4. Definitions and Assumptions
- 2. Executive Summary
- 2.1. Market Snapshot
- 3. Market Dynamics
- 3.1. Market Drivers
- 3.2. Market Restrains
- 3.3. Market Trends
- 3.4. Market Opportunities
- 4. Market Factor Analysis
- 4.1. Porters Five Forces
- 4.1.1. Bargaining Power of Suppliers
- 4.1.2. Bargaining Power of Buyers
- 4.1.3. Threat of New Entrants
- 4.1.4. Threat of Substitutes
- 4.1.5. Competitive Rivalry
- 4.2. PESTEL analysis
- 4.3. BCG Analysis
- 4.3.1. Stars (High Growth, High Market Share)
- 4.3.2. Cash Cows (Low Growth, High Market Share)
- 4.3.3. Question Mark (High Growth, Low Market Share)
- 4.3.4. Dogs (Low Growth, Low Market Share)
- 4.4. Ansoff Matrix Analysis
- 4.5. Supply Chain Analysis
- 4.6. Regulatory Landscape
- 4.7. Current Market Potential and Opportunity Assessment (TAM–SAM–SOM Framework)
- 4.8. PRI Analyst Note
- 4.1. Porters Five Forces
- 5. Market Analysis, Insights and Forecast 2021-2033
- 5.1. Market Analysis, Insights and Forecast - by Source
- 5.1.1. Animal
- 5.1.1.1. By Protein Type
- 5.1.1.1.1. Casein and Caseinates
- 5.1.1.1.2. Collagen
- 5.1.1.1.3. Egg Protein
- 5.1.1.1.4. Gelatin
- 5.1.1.1.5. Insect Protein
- 5.1.1.1.6. Milk Protein
- 5.1.1.1.7. Whey Protein
- 5.1.1.1.8. Other Animal Protein
- 5.1.1.1. By Protein Type
- 5.1.2. Microbial
- 5.1.2.1. Algae Protein
- 5.1.2.2. Mycoprotein
- 5.1.3. Plant
- 5.1.3.1. Hemp Protein
- 5.1.3.2. Pea Protein
- 5.1.3.3. Potato Protein
- 5.1.3.4. Rice Protein
- 5.1.3.5. Soy Protein
- 5.1.3.6. Wheat Protein
- 5.1.3.7. Other Plant Protein
- 5.1.1. Animal
- 5.2. Market Analysis, Insights and Forecast - by End User
- 5.2.1. Animal Feed
- 5.2.2. Food and Beverages
- 5.2.2.1. By Sub End User
- 5.2.2.1.1. Bakery
- 5.2.2.1.2. Breakfast Cereals
- 5.2.2.1.3. Condiments/Sauces
- 5.2.2.1.4. Confectionery
- 5.2.2.1.5. Dairy and Dairy Alternative Products
- 5.2.2.1.6. Meat/Poultry/Seafood and Meat Alternative Products
- 5.2.2.1.7. RTE/RTC Food Products
- 5.2.2.1.8. Snacks
- 5.2.2.1. By Sub End User
- 5.2.3. Personal Care and Cosmetics
- 5.2.4. Supplements
- 5.2.4.1. Baby Food and Infant Formula
- 5.2.4.2. Elderly Nutrition and Medical Nutrition
- 5.2.4.3. Sport/Performance Nutrition
- 5.3. Market Analysis, Insights and Forecast - by Region
- 5.3.1. North America
- 5.3.2. South America
- 5.3.3. Europe
- 5.3.4. Middle East & Africa
- 5.3.5. Asia Pacific
- 5.1. Market Analysis, Insights and Forecast - by Source
- 6. Global USA Protein Industry Analysis, Insights and Forecast, 2021-2033
- 6.1. Market Analysis, Insights and Forecast - by Source
- 6.1.1. Animal
- 6.1.1.1. By Protein Type
- 6.1.1.1.1. Casein and Caseinates
- 6.1.1.1.2. Collagen
- 6.1.1.1.3. Egg Protein
- 6.1.1.1.4. Gelatin
- 6.1.1.1.5. Insect Protein
- 6.1.1.1.6. Milk Protein
- 6.1.1.1.7. Whey Protein
- 6.1.1.1.8. Other Animal Protein
- 6.1.1.1. By Protein Type
- 6.1.2. Microbial
- 6.1.2.1. Algae Protein
- 6.1.2.2. Mycoprotein
- 6.1.3. Plant
- 6.1.3.1. Hemp Protein
- 6.1.3.2. Pea Protein
- 6.1.3.3. Potato Protein
- 6.1.3.4. Rice Protein
- 6.1.3.5. Soy Protein
- 6.1.3.6. Wheat Protein
- 6.1.3.7. Other Plant Protein
- 6.1.1. Animal
- 6.2. Market Analysis, Insights and Forecast - by End User
- 6.2.1. Animal Feed
- 6.2.2. Food and Beverages
- 6.2.2.1. By Sub End User
- 6.2.2.1.1. Bakery
- 6.2.2.1.2. Breakfast Cereals
- 6.2.2.1.3. Condiments/Sauces
- 6.2.2.1.4. Confectionery
- 6.2.2.1.5. Dairy and Dairy Alternative Products
- 6.2.2.1.6. Meat/Poultry/Seafood and Meat Alternative Products
- 6.2.2.1.7. RTE/RTC Food Products
- 6.2.2.1.8. Snacks
- 6.2.2.1. By Sub End User
- 6.2.3. Personal Care and Cosmetics
- 6.2.4. Supplements
- 6.2.4.1. Baby Food and Infant Formula
- 6.2.4.2. Elderly Nutrition and Medical Nutrition
- 6.2.4.3. Sport/Performance Nutrition
- 6.1. Market Analysis, Insights and Forecast - by Source
- 7. North America USA Protein Industry Analysis, Insights and Forecast, 2020-2032
- 7.1. Market Analysis, Insights and Forecast - by Source
- 7.1.1. Animal
- 7.1.1.1. By Protein Type
- 7.1.1.1.1. Casein and Caseinates
- 7.1.1.1.2. Collagen
- 7.1.1.1.3. Egg Protein
- 7.1.1.1.4. Gelatin
- 7.1.1.1.5. Insect Protein
- 7.1.1.1.6. Milk Protein
- 7.1.1.1.7. Whey Protein
- 7.1.1.1.8. Other Animal Protein
- 7.1.1.1. By Protein Type
- 7.1.2. Microbial
- 7.1.2.1. Algae Protein
- 7.1.2.2. Mycoprotein
- 7.1.3. Plant
- 7.1.3.1. Hemp Protein
- 7.1.3.2. Pea Protein
- 7.1.3.3. Potato Protein
- 7.1.3.4. Rice Protein
- 7.1.3.5. Soy Protein
- 7.1.3.6. Wheat Protein
- 7.1.3.7. Other Plant Protein
- 7.1.1. Animal
- 7.2. Market Analysis, Insights and Forecast - by End User
- 7.2.1. Animal Feed
- 7.2.2. Food and Beverages
- 7.2.2.1. By Sub End User
- 7.2.2.1.1. Bakery
- 7.2.2.1.2. Breakfast Cereals
- 7.2.2.1.3. Condiments/Sauces
- 7.2.2.1.4. Confectionery
- 7.2.2.1.5. Dairy and Dairy Alternative Products
- 7.2.2.1.6. Meat/Poultry/Seafood and Meat Alternative Products
- 7.2.2.1.7. RTE/RTC Food Products
- 7.2.2.1.8. Snacks
- 7.2.2.1. By Sub End User
- 7.2.3. Personal Care and Cosmetics
- 7.2.4. Supplements
- 7.2.4.1. Baby Food and Infant Formula
- 7.2.4.2. Elderly Nutrition and Medical Nutrition
- 7.2.4.3. Sport/Performance Nutrition
- 7.1. Market Analysis, Insights and Forecast - by Source
- 8. South America USA Protein Industry Analysis, Insights and Forecast, 2020-2032
- 8.1. Market Analysis, Insights and Forecast - by Source
- 8.1.1. Animal
- 8.1.1.1. By Protein Type
- 8.1.1.1.1. Casein and Caseinates
- 8.1.1.1.2. Collagen
- 8.1.1.1.3. Egg Protein
- 8.1.1.1.4. Gelatin
- 8.1.1.1.5. Insect Protein
- 8.1.1.1.6. Milk Protein
- 8.1.1.1.7. Whey Protein
- 8.1.1.1.8. Other Animal Protein
- 8.1.1.1. By Protein Type
- 8.1.2. Microbial
- 8.1.2.1. Algae Protein
- 8.1.2.2. Mycoprotein
- 8.1.3. Plant
- 8.1.3.1. Hemp Protein
- 8.1.3.2. Pea Protein
- 8.1.3.3. Potato Protein
- 8.1.3.4. Rice Protein
- 8.1.3.5. Soy Protein
- 8.1.3.6. Wheat Protein
- 8.1.3.7. Other Plant Protein
- 8.1.1. Animal
- 8.2. Market Analysis, Insights and Forecast - by End User
- 8.2.1. Animal Feed
- 8.2.2. Food and Beverages
- 8.2.2.1. By Sub End User
- 8.2.2.1.1. Bakery
- 8.2.2.1.2. Breakfast Cereals
- 8.2.2.1.3. Condiments/Sauces
- 8.2.2.1.4. Confectionery
- 8.2.2.1.5. Dairy and Dairy Alternative Products
- 8.2.2.1.6. Meat/Poultry/Seafood and Meat Alternative Products
- 8.2.2.1.7. RTE/RTC Food Products
- 8.2.2.1.8. Snacks
- 8.2.2.1. By Sub End User
- 8.2.3. Personal Care and Cosmetics
- 8.2.4. Supplements
- 8.2.4.1. Baby Food and Infant Formula
- 8.2.4.2. Elderly Nutrition and Medical Nutrition
- 8.2.4.3. Sport/Performance Nutrition
- 8.1. Market Analysis, Insights and Forecast - by Source
- 9. Europe USA Protein Industry Analysis, Insights and Forecast, 2020-2032
- 9.1. Market Analysis, Insights and Forecast - by Source
- 9.1.1. Animal
- 9.1.1.1. By Protein Type
- 9.1.1.1.1. Casein and Caseinates
- 9.1.1.1.2. Collagen
- 9.1.1.1.3. Egg Protein
- 9.1.1.1.4. Gelatin
- 9.1.1.1.5. Insect Protein
- 9.1.1.1.6. Milk Protein
- 9.1.1.1.7. Whey Protein
- 9.1.1.1.8. Other Animal Protein
- 9.1.1.1. By Protein Type
- 9.1.2. Microbial
- 9.1.2.1. Algae Protein
- 9.1.2.2. Mycoprotein
- 9.1.3. Plant
- 9.1.3.1. Hemp Protein
- 9.1.3.2. Pea Protein
- 9.1.3.3. Potato Protein
- 9.1.3.4. Rice Protein
- 9.1.3.5. Soy Protein
- 9.1.3.6. Wheat Protein
- 9.1.3.7. Other Plant Protein
- 9.1.1. Animal
- 9.2. Market Analysis, Insights and Forecast - by End User
- 9.2.1. Animal Feed
- 9.2.2. Food and Beverages
- 9.2.2.1. By Sub End User
- 9.2.2.1.1. Bakery
- 9.2.2.1.2. Breakfast Cereals
- 9.2.2.1.3. Condiments/Sauces
- 9.2.2.1.4. Confectionery
- 9.2.2.1.5. Dairy and Dairy Alternative Products
- 9.2.2.1.6. Meat/Poultry/Seafood and Meat Alternative Products
- 9.2.2.1.7. RTE/RTC Food Products
- 9.2.2.1.8. Snacks
- 9.2.2.1. By Sub End User
- 9.2.3. Personal Care and Cosmetics
- 9.2.4. Supplements
- 9.2.4.1. Baby Food and Infant Formula
- 9.2.4.2. Elderly Nutrition and Medical Nutrition
- 9.2.4.3. Sport/Performance Nutrition
- 9.1. Market Analysis, Insights and Forecast - by Source
- 10. Middle East & Africa USA Protein Industry Analysis, Insights and Forecast, 2020-2032
- 10.1. Market Analysis, Insights and Forecast - by Source
- 10.1.1. Animal
- 10.1.1.1. By Protein Type
- 10.1.1.1.1. Casein and Caseinates
- 10.1.1.1.2. Collagen
- 10.1.1.1.3. Egg Protein
- 10.1.1.1.4. Gelatin
- 10.1.1.1.5. Insect Protein
- 10.1.1.1.6. Milk Protein
- 10.1.1.1.7. Whey Protein
- 10.1.1.1.8. Other Animal Protein
- 10.1.1.1. By Protein Type
- 10.1.2. Microbial
- 10.1.2.1. Algae Protein
- 10.1.2.2. Mycoprotein
- 10.1.3. Plant
- 10.1.3.1. Hemp Protein
- 10.1.3.2. Pea Protein
- 10.1.3.3. Potato Protein
- 10.1.3.4. Rice Protein
- 10.1.3.5. Soy Protein
- 10.1.3.6. Wheat Protein
- 10.1.3.7. Other Plant Protein
- 10.1.1. Animal
- 10.2. Market Analysis, Insights and Forecast - by End User
- 10.2.1. Animal Feed
- 10.2.2. Food and Beverages
- 10.2.2.1. By Sub End User
- 10.2.2.1.1. Bakery
- 10.2.2.1.2. Breakfast Cereals
- 10.2.2.1.3. Condiments/Sauces
- 10.2.2.1.4. Confectionery
- 10.2.2.1.5. Dairy and Dairy Alternative Products
- 10.2.2.1.6. Meat/Poultry/Seafood and Meat Alternative Products
- 10.2.2.1.7. RTE/RTC Food Products
- 10.2.2.1.8. Snacks
- 10.2.2.1. By Sub End User
- 10.2.3. Personal Care and Cosmetics
- 10.2.4. Supplements
- 10.2.4.1. Baby Food and Infant Formula
- 10.2.4.2. Elderly Nutrition and Medical Nutrition
- 10.2.4.3. Sport/Performance Nutrition
- 10.1. Market Analysis, Insights and Forecast - by Source
- 11. Asia Pacific USA Protein Industry Analysis, Insights and Forecast, 2020-2032
- 11.1. Market Analysis, Insights and Forecast - by Source
- 11.1.1. Animal
- 11.1.1.1. By Protein Type
- 11.1.1.1.1. Casein and Caseinates
- 11.1.1.1.2. Collagen
- 11.1.1.1.3. Egg Protein
- 11.1.1.1.4. Gelatin
- 11.1.1.1.5. Insect Protein
- 11.1.1.1.6. Milk Protein
- 11.1.1.1.7. Whey Protein
- 11.1.1.1.8. Other Animal Protein
- 11.1.1.1. By Protein Type
- 11.1.2. Microbial
- 11.1.2.1. Algae Protein
- 11.1.2.2. Mycoprotein
- 11.1.3. Plant
- 11.1.3.1. Hemp Protein
- 11.1.3.2. Pea Protein
- 11.1.3.3. Potato Protein
- 11.1.3.4. Rice Protein
- 11.1.3.5. Soy Protein
- 11.1.3.6. Wheat Protein
- 11.1.3.7. Other Plant Protein
- 11.1.1. Animal
- 11.2. Market Analysis, Insights and Forecast - by End User
- 11.2.1. Animal Feed
- 11.2.2. Food and Beverages
- 11.2.2.1. By Sub End User
- 11.2.2.1.1. Bakery
- 11.2.2.1.2. Breakfast Cereals
- 11.2.2.1.3. Condiments/Sauces
- 11.2.2.1.4. Confectionery
- 11.2.2.1.5. Dairy and Dairy Alternative Products
- 11.2.2.1.6. Meat/Poultry/Seafood and Meat Alternative Products
- 11.2.2.1.7. RTE/RTC Food Products
- 11.2.2.1.8. Snacks
- 11.2.2.1. By Sub End User
- 11.2.3. Personal Care and Cosmetics
- 11.2.4. Supplements
- 11.2.4.1. Baby Food and Infant Formula
- 11.2.4.2. Elderly Nutrition and Medical Nutrition
- 11.2.4.3. Sport/Performance Nutrition
- 11.1. Market Analysis, Insights and Forecast - by Source
- 12. Competitive Analysis
- 12.1. Company Profiles
- 12.1.1 CHS Inc
- 12.1.1.1. Company Overview
- 12.1.1.2. Products
- 12.1.1.3. Company Financials
- 12.1.1.4. SWOT Analysis
- 12.1.2 Darling Ingredients Inc
- 12.1.2.1. Company Overview
- 12.1.2.2. Products
- 12.1.2.3. Company Financials
- 12.1.2.4. SWOT Analysis
- 12.1.3 MGP
- 12.1.3.1. Company Overview
- 12.1.3.2. Products
- 12.1.3.3. Company Financials
- 12.1.3.4. SWOT Analysis
- 12.1.4 Arla Foods amba
- 12.1.4.1. Company Overview
- 12.1.4.2. Products
- 12.1.4.3. Company Financials
- 12.1.4.4. SWOT Analysis
- 12.1.5 Gelita AG
- 12.1.5.1. Company Overview
- 12.1.5.2. Products
- 12.1.5.3. Company Financials
- 12.1.5.4. SWOT Analysis
- 12.1.6 AMCO Proteins
- 12.1.6.1. Company Overview
- 12.1.6.2. Products
- 12.1.6.3. Company Financials
- 12.1.6.4. SWOT Analysis
- 12.1.7 International Flavors & Fragrances Inc
- 12.1.7.1. Company Overview
- 12.1.7.2. Products
- 12.1.7.3. Company Financials
- 12.1.7.4. SWOT Analysis
- 12.1.8 Archer Daniels Midland Company
- 12.1.8.1. Company Overview
- 12.1.8.2. Products
- 12.1.8.3. Company Financials
- 12.1.8.4. SWOT Analysis
- 12.1.9 Glanbia PLC
- 12.1.9.1. Company Overview
- 12.1.9.2. Products
- 12.1.9.3. Company Financials
- 12.1.9.4. SWOT Analysis
- 12.1.10 Ajinomoto Co Inc
- 12.1.10.1. Company Overview
- 12.1.10.2. Products
- 12.1.10.3. Company Financials
- 12.1.10.4. SWOT Analysis
- 12.1.11 Bunge Limited
- 12.1.11.1. Company Overview
- 12.1.11.2. Products
- 12.1.11.3. Company Financials
- 12.1.11.4. SWOT Analysis
- 12.1.12 Roquette Frères
- 12.1.12.1. Company Overview
- 12.1.12.2. Products
- 12.1.12.3. Company Financials
- 12.1.12.4. SWOT Analysis
- 12.1.13 Agropur Dairy Cooperative
- 12.1.13.1. Company Overview
- 12.1.13.2. Products
- 12.1.13.3. Company Financials
- 12.1.13.4. SWOT Analysis
- 12.1.14 Kerry Group PLC
- 12.1.14.1. Company Overview
- 12.1.14.2. Products
- 12.1.14.3. Company Financials
- 12.1.14.4. SWOT Analysis
- 12.1.15 Farbest-Tallman Foods Corporation
- 12.1.15.1. Company Overview
- 12.1.15.2. Products
- 12.1.15.3. Company Financials
- 12.1.15.4. SWOT Analysis
- 12.1.16 Fonterra Co-operative Group Limited
- 12.1.16.1. Company Overview
- 12.1.16.2. Products
- 12.1.16.3. Company Financials
- 12.1.16.4. SWOT Analysis
- 12.1.17 Ingredion Incorporated
- 12.1.17.1. Company Overview
- 12.1.17.2. Products
- 12.1.17.3. Company Financials
- 12.1.17.4. SWOT Analysis
- 12.1.18 Corbion NV
- 12.1.18.1. Company Overview
- 12.1.18.2. Products
- 12.1.18.3. Company Financials
- 12.1.18.4. SWOT Analysis
- 12.1.19 Südzucker Grou
- 12.1.19.1. Company Overview
- 12.1.19.2. Products
- 12.1.19.3. Company Financials
- 12.1.19.4. SWOT Analysis
- 12.1.1 CHS Inc
- 12.2. Market Entropy
- 12.2.1 Company's Key Areas Served
- 12.2.2 Recent Developments
- 12.3. Company Market Share Analysis 2025
- 12.3.1 Top 5 Companies Market Share Analysis
- 12.3.2 Top 3 Companies Market Share Analysis
- 12.4. List of Potential Customers
- 13. Research Methodology
List of Figures
- Figure 1: Global USA Protein Industry Revenue Breakdown (billion, %) by Region 2025 & 2033
- Figure 2: North America USA Protein Industry Revenue (billion), by Source 2025 & 2033
- Figure 3: North America USA Protein Industry Revenue Share (%), by Source 2025 & 2033
- Figure 4: North America USA Protein Industry Revenue (billion), by End User 2025 & 2033
- Figure 5: North America USA Protein Industry Revenue Share (%), by End User 2025 & 2033
- Figure 6: North America USA Protein Industry Revenue (billion), by Country 2025 & 2033
- Figure 7: North America USA Protein Industry Revenue Share (%), by Country 2025 & 2033
- Figure 8: South America USA Protein Industry Revenue (billion), by Source 2025 & 2033
- Figure 9: South America USA Protein Industry Revenue Share (%), by Source 2025 & 2033
- Figure 10: South America USA Protein Industry Revenue (billion), by End User 2025 & 2033
- Figure 11: South America USA Protein Industry Revenue Share (%), by End User 2025 & 2033
- Figure 12: South America USA Protein Industry Revenue (billion), by Country 2025 & 2033
- Figure 13: South America USA Protein Industry Revenue Share (%), by Country 2025 & 2033
- Figure 14: Europe USA Protein Industry Revenue (billion), by Source 2025 & 2033
- Figure 15: Europe USA Protein Industry Revenue Share (%), by Source 2025 & 2033
- Figure 16: Europe USA Protein Industry Revenue (billion), by End User 2025 & 2033
- Figure 17: Europe USA Protein Industry Revenue Share (%), by End User 2025 & 2033
- Figure 18: Europe USA Protein Industry Revenue (billion), by Country 2025 & 2033
- Figure 19: Europe USA Protein Industry Revenue Share (%), by Country 2025 & 2033
- Figure 20: Middle East & Africa USA Protein Industry Revenue (billion), by Source 2025 & 2033
- Figure 21: Middle East & Africa USA Protein Industry Revenue Share (%), by Source 2025 & 2033
- Figure 22: Middle East & Africa USA Protein Industry Revenue (billion), by End User 2025 & 2033
- Figure 23: Middle East & Africa USA Protein Industry Revenue Share (%), by End User 2025 & 2033
- Figure 24: Middle East & Africa USA Protein Industry Revenue (billion), by Country 2025 & 2033
- Figure 25: Middle East & Africa USA Protein Industry Revenue Share (%), by Country 2025 & 2033
- Figure 26: Asia Pacific USA Protein Industry Revenue (billion), by Source 2025 & 2033
- Figure 27: Asia Pacific USA Protein Industry Revenue Share (%), by Source 2025 & 2033
- Figure 28: Asia Pacific USA Protein Industry Revenue (billion), by End User 2025 & 2033
- Figure 29: Asia Pacific USA Protein Industry Revenue Share (%), by End User 2025 & 2033
- Figure 30: Asia Pacific USA Protein Industry Revenue (billion), by Country 2025 & 2033
- Figure 31: Asia Pacific USA Protein Industry Revenue Share (%), by Country 2025 & 2033
List of Tables
- Table 1: Global USA Protein Industry Revenue billion Forecast, by Source 2020 & 2033
- Table 2: Global USA Protein Industry Revenue billion Forecast, by End User 2020 & 2033
- Table 3: Global USA Protein Industry Revenue billion Forecast, by Region 2020 & 2033
- Table 4: Global USA Protein Industry Revenue billion Forecast, by Source 2020 & 2033
- Table 5: Global USA Protein Industry Revenue billion Forecast, by End User 2020 & 2033
- Table 6: Global USA Protein Industry Revenue billion Forecast, by Country 2020 & 2033
- Table 7: United States USA Protein Industry Revenue (billion) Forecast, by Application 2020 & 2033
- Table 8: Canada USA Protein Industry Revenue (billion) Forecast, by Application 2020 & 2033
- Table 9: Mexico USA Protein Industry Revenue (billion) Forecast, by Application 2020 & 2033
- Table 10: Global USA Protein Industry Revenue billion Forecast, by Source 2020 & 2033
- Table 11: Global USA Protein Industry Revenue billion Forecast, by End User 2020 & 2033
- Table 12: Global USA Protein Industry Revenue billion Forecast, by Country 2020 & 2033
- Table 13: Brazil USA Protein Industry Revenue (billion) Forecast, by Application 2020 & 2033
- Table 14: Argentina USA Protein Industry Revenue (billion) Forecast, by Application 2020 & 2033
- Table 15: Rest of South America USA Protein Industry Revenue (billion) Forecast, by Application 2020 & 2033
- Table 16: Global USA Protein Industry Revenue billion Forecast, by Source 2020 & 2033
- Table 17: Global USA Protein Industry Revenue billion Forecast, by End User 2020 & 2033
- Table 18: Global USA Protein Industry Revenue billion Forecast, by Country 2020 & 2033
- Table 19: United Kingdom USA Protein Industry Revenue (billion) Forecast, by Application 2020 & 2033
- Table 20: Germany USA Protein Industry Revenue (billion) Forecast, by Application 2020 & 2033
- Table 21: France USA Protein Industry Revenue (billion) Forecast, by Application 2020 & 2033
- Table 22: Italy USA Protein Industry Revenue (billion) Forecast, by Application 2020 & 2033
- Table 23: Spain USA Protein Industry Revenue (billion) Forecast, by Application 2020 & 2033
- Table 24: Russia USA Protein Industry Revenue (billion) Forecast, by Application 2020 & 2033
- Table 25: Benelux USA Protein Industry Revenue (billion) Forecast, by Application 2020 & 2033
- Table 26: Nordics USA Protein Industry Revenue (billion) Forecast, by Application 2020 & 2033
- Table 27: Rest of Europe USA Protein Industry Revenue (billion) Forecast, by Application 2020 & 2033
- Table 28: Global USA Protein Industry Revenue billion Forecast, by Source 2020 & 2033
- Table 29: Global USA Protein Industry Revenue billion Forecast, by End User 2020 & 2033
- Table 30: Global USA Protein Industry Revenue billion Forecast, by Country 2020 & 2033
- Table 31: Turkey USA Protein Industry Revenue (billion) Forecast, by Application 2020 & 2033
- Table 32: Israel USA Protein Industry Revenue (billion) Forecast, by Application 2020 & 2033
- Table 33: GCC USA Protein Industry Revenue (billion) Forecast, by Application 2020 & 2033
- Table 34: North Africa USA Protein Industry Revenue (billion) Forecast, by Application 2020 & 2033
- Table 35: South Africa USA Protein Industry Revenue (billion) Forecast, by Application 2020 & 2033
- Table 36: Rest of Middle East & Africa USA Protein Industry Revenue (billion) Forecast, by Application 2020 & 2033
- Table 37: Global USA Protein Industry Revenue billion Forecast, by Source 2020 & 2033
- Table 38: Global USA Protein Industry Revenue billion Forecast, by End User 2020 & 2033
- Table 39: Global USA Protein Industry Revenue billion Forecast, by Country 2020 & 2033
- Table 40: China USA Protein Industry Revenue (billion) Forecast, by Application 2020 & 2033
- Table 41: India USA Protein Industry Revenue (billion) Forecast, by Application 2020 & 2033
- Table 42: Japan USA Protein Industry Revenue (billion) Forecast, by Application 2020 & 2033
- Table 43: South Korea USA Protein Industry Revenue (billion) Forecast, by Application 2020 & 2033
- Table 44: ASEAN USA Protein Industry Revenue (billion) Forecast, by Application 2020 & 2033
- Table 45: Oceania USA Protein Industry Revenue (billion) Forecast, by Application 2020 & 2033
- Table 46: Rest of Asia Pacific USA Protein Industry Revenue (billion) Forecast, by Application 2020 & 2033
Frequently Asked Questions
1. What is the projected Compound Annual Growth Rate (CAGR) of the USA Protein Industry?
The projected CAGR is approximately 10.3%.
2. Which companies are prominent players in the USA Protein Industry?
Key companies in the market include CHS Inc, Darling Ingredients Inc, MGP, Arla Foods amba, Gelita AG, AMCO Proteins, International Flavors & Fragrances Inc, Archer Daniels Midland Company, Glanbia PLC, Ajinomoto Co Inc, Bunge Limited, Roquette Frères, Agropur Dairy Cooperative, Kerry Group PLC, Farbest-Tallman Foods Corporation, Fonterra Co-operative Group Limited, Ingredion Incorporated, Corbion NV, Südzucker Grou.
3. What are the main segments of the USA Protein Industry?
The market segments include Source, End User.
4. Can you provide details about the market size?
The market size is estimated to be USD 29.78 billion as of 2022.
5. What are some drivers contributing to market growth?
Increasing Urbanization; Growing Disposable Income.
6. What are the notable trends driving market growth?
OTHER KEY INDUSTRY TRENDS COVERED IN THE REPORT.
7. Are there any restraints impacting market growth?
High-price and additional delivery charges.
8. Can you provide examples of recent developments in the market?
August 2022: Optimum Nutrition announced the launch of its new Gold Standard Protein Shake. The RTD is available in chocolate and vanilla flavors, and formulated with 24 grams of protein per serving.June 2022: Fonterra JV has entered into a joint venture with Tillamook country creamery association(TCCA) and a three-mile canyon farm in the United States to launch Pro-Optima TM, a grade A functional whey protein concentrate (fWPC).August 2021: Darling Ingredients expanded its existing manufacturing facility that includes Nebraska’s first operation dedicated solely to poultry conversion. This expanded manufacturing unit may also facilitate protein conversion.
9. What pricing options are available for accessing the report?
Pricing options include single-user, multi-user, and enterprise licenses priced at USD 3800, USD 4500, and USD 5800 respectively.
10. Is the market size provided in terms of value or volume?
The market size is provided in terms of value, measured in billion.
11. Are there any specific market keywords associated with the report?
Yes, the market keyword associated with the report is "USA Protein Industry," which aids in identifying and referencing the specific market segment covered.
12. How do I determine which pricing option suits my needs best?
The pricing options vary based on user requirements and access needs. Individual users may opt for single-user licenses, while businesses requiring broader access may choose multi-user or enterprise licenses for cost-effective access to the report.
13. Are there any additional resources or data provided in the USA Protein Industry report?
While the report offers comprehensive insights, it's advisable to review the specific contents or supplementary materials provided to ascertain if additional resources or data are available.
14. How can I stay updated on further developments or reports in the USA Protein Industry?
To stay informed about further developments, trends, and reports in the USA Protein Industry, consider subscribing to industry newsletters, following relevant companies and organizations, or regularly checking reputable industry news sources and publications.
Methodology
Step 1 - Identification of Relevant Samples Size from Population Database


Step 2 - Approaches for Defining Global Market Size (Value, Volume* & Price*)

Note*: In applicable scenarios
Step 3 - Data Sources
Primary Research
- Web Analytics
- Survey Reports
- Research Institute
- Latest Research Reports
- Opinion Leaders
Secondary Research
- Annual Reports
- White Paper
- Latest Press Release
- Industry Association
- Paid Database
- Investor Presentations

Step 4 - Data Triangulation
Involves using different sources of information in order to increase the validity of a study
These sources are likely to be stakeholders in a program - participants, other researchers, program staff, other community members, and so on.
Then we put all data in single framework & apply various statistical tools to find out the dynamic on the market.
During the analysis stage, feedback from the stakeholder groups would be compared to determine areas of agreement as well as areas of divergence