

Key Insights
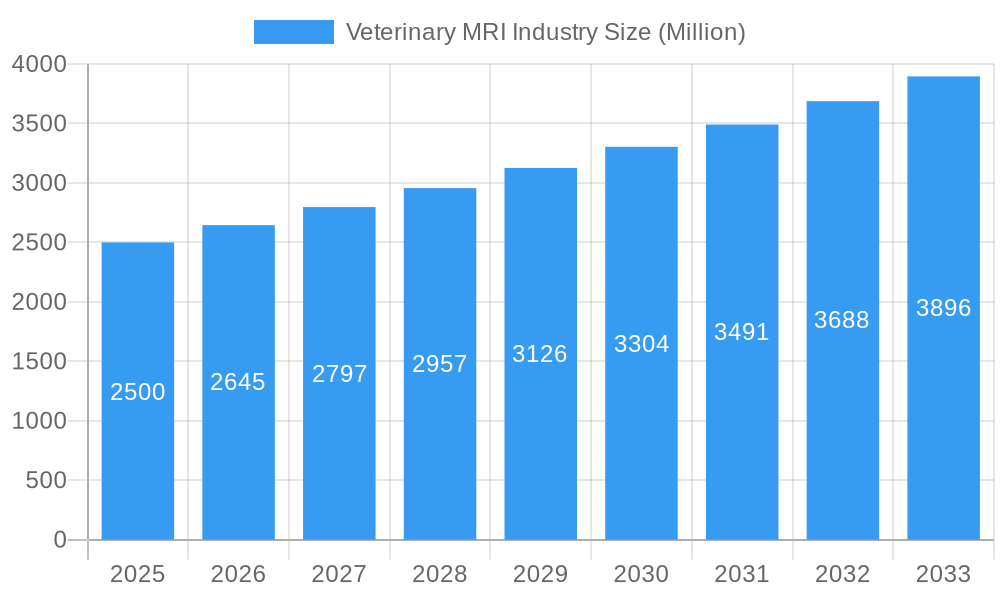
The veterinary MRI market is poised for significant expansion, projected to reach $2.7 billion by 2025, with a Compound Annual Growth Rate (CAGR) of 5.2%. This growth is driven by the rising incidence of complex orthopedic and neurological conditions in companion animals, alongside increasing pet ownership and veterinary healthcare expenditure. Advanced diagnostic imaging, such as MRI, is instrumental in improving treatment outcomes and animal welfare. Technological innovations are yielding more compact, cost-effective, and user-friendly MRI systems tailored for veterinary use. Key application segments like cardiology, oncology, and neurology demonstrate robust growth, highlighting the demand for sophisticated diagnostic tools. North America and Europe currently dominate the market, supported by developed veterinary infrastructures and high pet ownership. The Asia-Pacific region offers substantial growth potential due to increasing disposable incomes and rising awareness of advanced veterinary care.
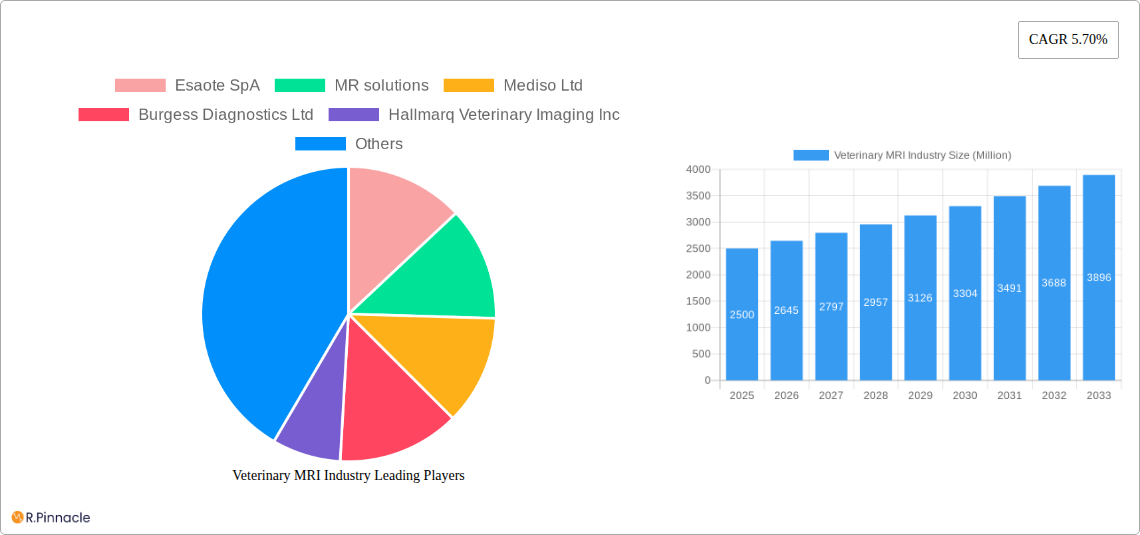
Veterinary MRI Industry Market Size (In Billion)
The competitive landscape features established and emerging companies focused on veterinary MRI systems and software. Strategic investments in research and development are driving technological advancements and market expansion. Challenges such as regulatory compliance and high initial investment costs are present but are offset by positive market indicators. Growth is further supported by expanding veterinary education in advanced diagnostic imaging and the increasing adoption of MRI in specialized veterinary clinics. This confluence of factors indicates sustained market growth and significant opportunities for stakeholders across diverse segments and geographies.
Veterinary MRI Industry Company Market Share
Veterinary MRI Industry Market Report: 2019-2033
This comprehensive report provides a detailed analysis of the Veterinary MRI industry, projecting a market value of $XX Million by 2033. Leveraging data from 2019-2024 (historical period), with 2025 as the base and estimated year, and forecasting to 2033, this report is an invaluable resource for industry professionals, investors, and strategic decision-makers. The report utilizes a robust methodology and incorporates insights from key players like Esaote SpA, MR solutions, Mediso Ltd, Burgess Diagnostics Ltd, Hallmarq Veterinary Imaging Inc, Shenzhen Mindray Bio-Medical Electronics Co, Universal Medical Systems Inc, Imotek International Ltd, and Bruker Corporation.
Veterinary MRI Industry Market Structure & Innovation Trends
This section analyzes the competitive landscape, innovation drivers, and regulatory influences shaping the Veterinary MRI market. The market exhibits a moderately consolidated structure, with the top five players holding an estimated XX% market share in 2025. Innovation is driven by advancements in MRI technology, including higher field strength magnets, improved image quality, and advanced software solutions. Regulatory frameworks vary across regions, impacting market access and product approvals. The market also faces competition from alternative diagnostic imaging technologies such as ultrasound and X-ray. M&A activity in the sector has been moderate, with several deals valued at over $XX Million in the past five years contributing to consolidation. Key trends include:
- Increasing demand for advanced imaging techniques: driving innovation in MRI system capabilities.
- Rising adoption of digital imaging and telehealth: transforming data management and remote diagnostics.
- Stringent regulatory approvals: necessitating compliance and impacting market entry strategies.
- Strategic alliances and partnerships: shaping the competitive landscape through collaborations.
Veterinary MRI Industry Market Dynamics & Trends
The Veterinary MRI market is projected to experience a CAGR of XX% during the forecast period (2025-2033), driven by several key factors. Increased pet ownership, rising pet healthcare expenditure, technological advancements enhancing image quality and diagnostic accuracy, and growing awareness among veterinary professionals about the benefits of MRI are fueling market growth. Technological disruptions, such as the development of portable MRI systems and AI-powered image analysis software, are reshaping the industry. Consumer preferences are shifting towards higher-quality, faster, and more convenient imaging services. Competitive dynamics are intense, with existing players focusing on innovation, strategic partnerships, and geographic expansion. Market penetration of MRI systems in veterinary clinics remains relatively low, presenting substantial growth opportunities.
Dominant Regions & Segments in Veterinary MRI Industry
North America currently dominates the Veterinary MRI market, accounting for approximately XX% of global revenue in 2025. This dominance stems from factors such as:
- High pet ownership rates: creating substantial demand for advanced veterinary care.
- Well-established veterinary infrastructure: facilitating the adoption of advanced imaging technologies.
- Favorable regulatory environment: promoting market access and innovation.
Key Segments:
- Product Type: MRI Systems hold the largest market share, followed by Imaging Software and Others.
- Application: Oncology leads in application-specific revenue, with Cardiology and Neurology following closely.
- Animal Type: Small animals represent the majority of procedures, while large animals account for a smaller yet growing segment.
Veterinary MRI Industry Product Innovations
Recent innovations focus on improving image quality, reducing scan times, and enhancing user-friendliness. Compact MRI systems designed for smaller clinics are gaining popularity. AI-powered software solutions automate image analysis, improving diagnostic accuracy and efficiency. These innovations provide competitive advantages by delivering faster results, improving diagnostic accuracy, and reducing overall costs.
Report Scope & Segmentation Analysis
This report segments the Veterinary MRI market by product type (MRI systems, imaging software, others), application (cardiology, oncology, neurology, orthopedics, other applications), and animal type (small animals, large animals). Each segment exhibits distinct growth trajectories, driven by specific factors, including technological advancements, regulatory changes, and regional variations in veterinary healthcare infrastructure. Growth projections are provided for each segment, outlining market sizes and competitive dynamics for the forecast period.
Key Drivers of Veterinary MRI Industry Growth
Several factors fuel the growth of the Veterinary MRI market. These include:
- Technological advancements leading to improved image quality and faster scan times.
- Rising pet ownership and increased pet healthcare expenditure.
- Growing awareness among veterinary professionals about the benefits of MRI.
- Favorable regulatory environments in several key markets.
Challenges in the Veterinary MRI Industry Sector
The industry faces several challenges, including:
- High initial investment costs for MRI systems, limiting accessibility for smaller clinics.
- Stringent regulatory requirements for medical devices, impacting market entry.
- Competition from alternative diagnostic imaging techniques like ultrasound and X-ray.
- Supply chain disruptions impacting the availability of components and equipment.
Emerging Opportunities in Veterinary MRI Industry
Opportunities lie in:
- Expansion into emerging markets with growing pet ownership and veterinary infrastructure.
- Development of portable and cost-effective MRI systems.
- Integration of AI and machine learning for improved image analysis and diagnosis.
- Focus on specialized applications, such as equine and avian MRI.
Leading Players in the Veterinary MRI Industry Market
- Esaote SpA
- MR solutions
- Mediso Ltd
- Burgess Diagnostics Ltd
- Hallmarq Veterinary Imaging Inc
- Shenzhen Mindray Bio-Medical Electronics Co
- Universal Medical Systems Inc
- Imotek International Ltd
- Bruker Corporation
Key Developments in Veterinary MRI Industry Industry
- April 2022: Launch of three new Veterinary Urgent Care Clinics in San Diego, expanding access to veterinary services, potentially increasing demand for diagnostic imaging.
- August 2021: Partnership between National Veterinary Associates and Ethos Veterinary Health, potentially driving investment in advanced technologies like MRI within their network.
Future Outlook for Veterinary MRI Industry Market
The Veterinary MRI market is poised for significant growth over the next decade. Continued technological advancements, expanding pet healthcare expenditure, and increased awareness of the benefits of MRI will drive market expansion. Strategic partnerships, mergers and acquisitions, and geographic expansion will shape the competitive landscape. The focus on improving accessibility and affordability of MRI services will be crucial for unlocking the full market potential.
Veterinary MRI Industry Segmentation
-
1. Product Type
- 1.1. MRI Systems
- 1.2. Imaging Software
- 1.3. Others
-
2. Application
- 2.1. Cardiology
- 2.2. Oncology
- 2.3. Neurology
- 2.4. Orthopedics
- 2.5. Other Applications
-
3. Animal Type
- 3.1. Small Animals
- 3.2. Large Animals
Veterinary MRI Industry Segmentation By Geography
-
1. North America
- 1.1. United States
- 1.2. Canada
- 1.3. Mexico
-
2. Europe
- 2.1. United Kingdom
- 2.2. Germany
- 2.3. France
- 2.4. Italy
- 2.5. Spain
- 2.6. Rest of Europe
-
3. Asia Pacific
- 3.1. China
- 3.2. Japan
- 3.3. India
- 3.4. Australia
- 3.5. South Korea
- 3.6. Rest of Asia Pacific
-
4. Middle East and Africa
- 4.1. GCC
- 4.2. South Africa
- 4.3. Rest of Middle East and Africa
-
5. South America
- 5.1. Brazil
- 5.2. Argentina
- 5.3. Rest of South America
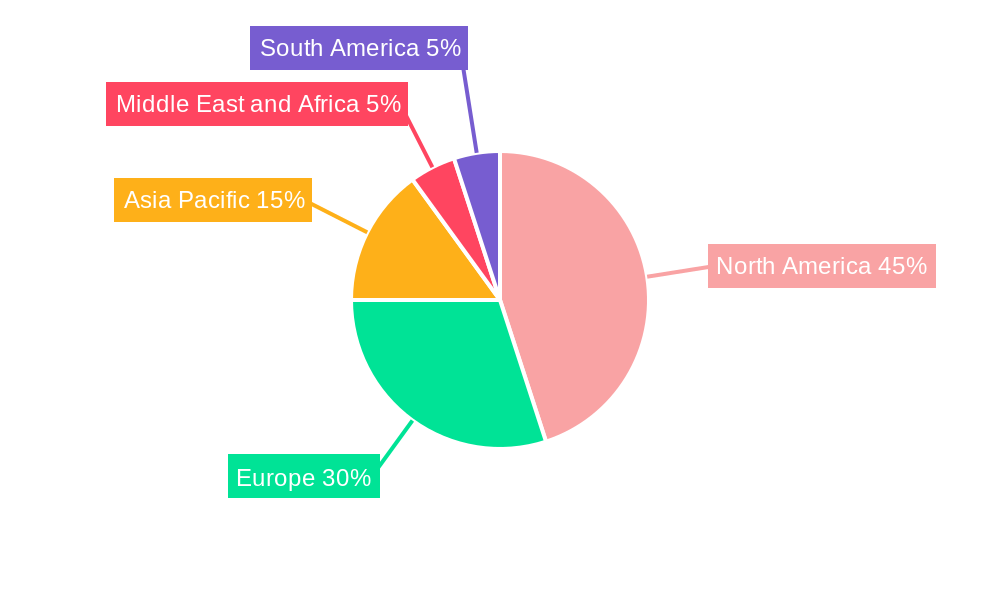
Veterinary MRI Industry Regional Market Share
Geographic Coverage of Veterinary MRI Industry
Veterinary MRI Industry REPORT HIGHLIGHTS
| Aspects | Details |
|---|---|
| Study Period | 2020-2034 |
| Base Year | 2025 |
| Estimated Year | 2026 |
| Forecast Period | 2026-2034 |
| Historical Period | 2020-2025 |
| Growth Rate | CAGR of 5.2% from 2020-2034 |
| Segmentation |
|
Table of Contents
- 1. Introduction
- 1.1. Research Scope
- 1.2. Market Segmentation
- 1.3. Research Objective
- 1.4. Definitions and Assumptions
- 2. Executive Summary
- 2.1. Market Snapshot
- 3. Market Dynamics
- 3.1. Market Drivers
- 3.2. Market Restrains
- 3.3. Market Trends
- 3.4. Market Opportunities
- 4. Market Factor Analysis
- 4.1. Porters Five Forces
- 4.1.1. Bargaining Power of Suppliers
- 4.1.2. Bargaining Power of Buyers
- 4.1.3. Threat of New Entrants
- 4.1.4. Threat of Substitutes
- 4.1.5. Competitive Rivalry
- 4.2. PESTEL analysis
- 4.3. BCG Analysis
- 4.3.1. Stars (High Growth, High Market Share)
- 4.3.2. Cash Cows (Low Growth, High Market Share)
- 4.3.3. Question Mark (High Growth, Low Market Share)
- 4.3.4. Dogs (Low Growth, Low Market Share)
- 4.4. Ansoff Matrix Analysis
- 4.5. Supply Chain Analysis
- 4.6. Regulatory Landscape
- 4.7. Current Market Potential and Opportunity Assessment (TAM–SAM–SOM Framework)
- 4.8. PRI Analyst Note
- 4.1. Porters Five Forces
- 5. Market Analysis, Insights and Forecast 2021-2033
- 5.1. Market Analysis, Insights and Forecast - by Product Type
- 5.1.1. MRI Systems
- 5.1.2. Imaging Software
- 5.1.3. Others
- 5.2. Market Analysis, Insights and Forecast - by Application
- 5.2.1. Cardiology
- 5.2.2. Oncology
- 5.2.3. Neurology
- 5.2.4. Orthopedics
- 5.2.5. Other Applications
- 5.3. Market Analysis, Insights and Forecast - by Animal Type
- 5.3.1. Small Animals
- 5.3.2. Large Animals
- 5.4. Market Analysis, Insights and Forecast - by Region
- 5.4.1. North America
- 5.4.2. Europe
- 5.4.3. Asia Pacific
- 5.4.4. Middle East and Africa
- 5.4.5. South America
- 5.1. Market Analysis, Insights and Forecast - by Product Type
- 6. Global Veterinary MRI Industry Analysis, Insights and Forecast, 2021-2033
- 6.1. Market Analysis, Insights and Forecast - by Product Type
- 6.1.1. MRI Systems
- 6.1.2. Imaging Software
- 6.1.3. Others
- 6.2. Market Analysis, Insights and Forecast - by Application
- 6.2.1. Cardiology
- 6.2.2. Oncology
- 6.2.3. Neurology
- 6.2.4. Orthopedics
- 6.2.5. Other Applications
- 6.3. Market Analysis, Insights and Forecast - by Animal Type
- 6.3.1. Small Animals
- 6.3.2. Large Animals
- 6.1. Market Analysis, Insights and Forecast - by Product Type
- 7. North America Veterinary MRI Industry Analysis, Insights and Forecast, 2020-2032
- 7.1. Market Analysis, Insights and Forecast - by Product Type
- 7.1.1. MRI Systems
- 7.1.2. Imaging Software
- 7.1.3. Others
- 7.2. Market Analysis, Insights and Forecast - by Application
- 7.2.1. Cardiology
- 7.2.2. Oncology
- 7.2.3. Neurology
- 7.2.4. Orthopedics
- 7.2.5. Other Applications
- 7.3. Market Analysis, Insights and Forecast - by Animal Type
- 7.3.1. Small Animals
- 7.3.2. Large Animals
- 7.1. Market Analysis, Insights and Forecast - by Product Type
- 8. Europe Veterinary MRI Industry Analysis, Insights and Forecast, 2020-2032
- 8.1. Market Analysis, Insights and Forecast - by Product Type
- 8.1.1. MRI Systems
- 8.1.2. Imaging Software
- 8.1.3. Others
- 8.2. Market Analysis, Insights and Forecast - by Application
- 8.2.1. Cardiology
- 8.2.2. Oncology
- 8.2.3. Neurology
- 8.2.4. Orthopedics
- 8.2.5. Other Applications
- 8.3. Market Analysis, Insights and Forecast - by Animal Type
- 8.3.1. Small Animals
- 8.3.2. Large Animals
- 8.1. Market Analysis, Insights and Forecast - by Product Type
- 9. Asia Pacific Veterinary MRI Industry Analysis, Insights and Forecast, 2020-2032
- 9.1. Market Analysis, Insights and Forecast - by Product Type
- 9.1.1. MRI Systems
- 9.1.2. Imaging Software
- 9.1.3. Others
- 9.2. Market Analysis, Insights and Forecast - by Application
- 9.2.1. Cardiology
- 9.2.2. Oncology
- 9.2.3. Neurology
- 9.2.4. Orthopedics
- 9.2.5. Other Applications
- 9.3. Market Analysis, Insights and Forecast - by Animal Type
- 9.3.1. Small Animals
- 9.3.2. Large Animals
- 9.1. Market Analysis, Insights and Forecast - by Product Type
- 10. Middle East and Africa Veterinary MRI Industry Analysis, Insights and Forecast, 2020-2032
- 10.1. Market Analysis, Insights and Forecast - by Product Type
- 10.1.1. MRI Systems
- 10.1.2. Imaging Software
- 10.1.3. Others
- 10.2. Market Analysis, Insights and Forecast - by Application
- 10.2.1. Cardiology
- 10.2.2. Oncology
- 10.2.3. Neurology
- 10.2.4. Orthopedics
- 10.2.5. Other Applications
- 10.3. Market Analysis, Insights and Forecast - by Animal Type
- 10.3.1. Small Animals
- 10.3.2. Large Animals
- 10.1. Market Analysis, Insights and Forecast - by Product Type
- 11. South America Veterinary MRI Industry Analysis, Insights and Forecast, 2020-2032
- 11.1. Market Analysis, Insights and Forecast - by Product Type
- 11.1.1. MRI Systems
- 11.1.2. Imaging Software
- 11.1.3. Others
- 11.2. Market Analysis, Insights and Forecast - by Application
- 11.2.1. Cardiology
- 11.2.2. Oncology
- 11.2.3. Neurology
- 11.2.4. Orthopedics
- 11.2.5. Other Applications
- 11.3. Market Analysis, Insights and Forecast - by Animal Type
- 11.3.1. Small Animals
- 11.3.2. Large Animals
- 11.1. Market Analysis, Insights and Forecast - by Product Type
- 12. Competitive Analysis
- 12.1. Company Profiles
- 12.1.1 Esaote SpA
- 12.1.1.1. Company Overview
- 12.1.1.2. Products
- 12.1.1.3. Company Financials
- 12.1.1.4. SWOT Analysis
- 12.1.2 MR solutions
- 12.1.2.1. Company Overview
- 12.1.2.2. Products
- 12.1.2.3. Company Financials
- 12.1.2.4. SWOT Analysis
- 12.1.3 Mediso Ltd
- 12.1.3.1. Company Overview
- 12.1.3.2. Products
- 12.1.3.3. Company Financials
- 12.1.3.4. SWOT Analysis
- 12.1.4 Burgess Diagnostics Ltd
- 12.1.4.1. Company Overview
- 12.1.4.2. Products
- 12.1.4.3. Company Financials
- 12.1.4.4. SWOT Analysis
- 12.1.5 Hallmarq Veterinary Imaging Inc
- 12.1.5.1. Company Overview
- 12.1.5.2. Products
- 12.1.5.3. Company Financials
- 12.1.5.4. SWOT Analysis
- 12.1.6 Shenzhen Mindray Bio-Medical Electronics Co
- 12.1.6.1. Company Overview
- 12.1.6.2. Products
- 12.1.6.3. Company Financials
- 12.1.6.4. SWOT Analysis
- 12.1.7 Universal Medical Systems Inc
- 12.1.7.1. Company Overview
- 12.1.7.2. Products
- 12.1.7.3. Company Financials
- 12.1.7.4. SWOT Analysis
- 12.1.8 Imotek International Ltd
- 12.1.8.1. Company Overview
- 12.1.8.2. Products
- 12.1.8.3. Company Financials
- 12.1.8.4. SWOT Analysis
- 12.1.9 Bruker Corporation
- 12.1.9.1. Company Overview
- 12.1.9.2. Products
- 12.1.9.3. Company Financials
- 12.1.9.4. SWOT Analysis
- 12.1.1 Esaote SpA
- 12.2. Market Entropy
- 12.2.1 Company's Key Areas Served
- 12.2.2 Recent Developments
- 12.3. Company Market Share Analysis 2025
- 12.3.1 Top 5 Companies Market Share Analysis
- 12.3.2 Top 3 Companies Market Share Analysis
- 12.4. List of Potential Customers
- 13. Research Methodology
List of Figures
- Figure 1: Global Veterinary MRI Industry Revenue Breakdown (billion, %) by Region 2025 & 2033
- Figure 2: North America Veterinary MRI Industry Revenue (billion), by Product Type 2025 & 2033
- Figure 3: North America Veterinary MRI Industry Revenue Share (%), by Product Type 2025 & 2033
- Figure 4: North America Veterinary MRI Industry Revenue (billion), by Application 2025 & 2033
- Figure 5: North America Veterinary MRI Industry Revenue Share (%), by Application 2025 & 2033
- Figure 6: North America Veterinary MRI Industry Revenue (billion), by Animal Type 2025 & 2033
- Figure 7: North America Veterinary MRI Industry Revenue Share (%), by Animal Type 2025 & 2033
- Figure 8: North America Veterinary MRI Industry Revenue (billion), by Country 2025 & 2033
- Figure 9: North America Veterinary MRI Industry Revenue Share (%), by Country 2025 & 2033
- Figure 10: Europe Veterinary MRI Industry Revenue (billion), by Product Type 2025 & 2033
- Figure 11: Europe Veterinary MRI Industry Revenue Share (%), by Product Type 2025 & 2033
- Figure 12: Europe Veterinary MRI Industry Revenue (billion), by Application 2025 & 2033
- Figure 13: Europe Veterinary MRI Industry Revenue Share (%), by Application 2025 & 2033
- Figure 14: Europe Veterinary MRI Industry Revenue (billion), by Animal Type 2025 & 2033
- Figure 15: Europe Veterinary MRI Industry Revenue Share (%), by Animal Type 2025 & 2033
- Figure 16: Europe Veterinary MRI Industry Revenue (billion), by Country 2025 & 2033
- Figure 17: Europe Veterinary MRI Industry Revenue Share (%), by Country 2025 & 2033
- Figure 18: Asia Pacific Veterinary MRI Industry Revenue (billion), by Product Type 2025 & 2033
- Figure 19: Asia Pacific Veterinary MRI Industry Revenue Share (%), by Product Type 2025 & 2033
- Figure 20: Asia Pacific Veterinary MRI Industry Revenue (billion), by Application 2025 & 2033
- Figure 21: Asia Pacific Veterinary MRI Industry Revenue Share (%), by Application 2025 & 2033
- Figure 22: Asia Pacific Veterinary MRI Industry Revenue (billion), by Animal Type 2025 & 2033
- Figure 23: Asia Pacific Veterinary MRI Industry Revenue Share (%), by Animal Type 2025 & 2033
- Figure 24: Asia Pacific Veterinary MRI Industry Revenue (billion), by Country 2025 & 2033
- Figure 25: Asia Pacific Veterinary MRI Industry Revenue Share (%), by Country 2025 & 2033
- Figure 26: Middle East and Africa Veterinary MRI Industry Revenue (billion), by Product Type 2025 & 2033
- Figure 27: Middle East and Africa Veterinary MRI Industry Revenue Share (%), by Product Type 2025 & 2033
- Figure 28: Middle East and Africa Veterinary MRI Industry Revenue (billion), by Application 2025 & 2033
- Figure 29: Middle East and Africa Veterinary MRI Industry Revenue Share (%), by Application 2025 & 2033
- Figure 30: Middle East and Africa Veterinary MRI Industry Revenue (billion), by Animal Type 2025 & 2033
- Figure 31: Middle East and Africa Veterinary MRI Industry Revenue Share (%), by Animal Type 2025 & 2033
- Figure 32: Middle East and Africa Veterinary MRI Industry Revenue (billion), by Country 2025 & 2033
- Figure 33: Middle East and Africa Veterinary MRI Industry Revenue Share (%), by Country 2025 & 2033
- Figure 34: South America Veterinary MRI Industry Revenue (billion), by Product Type 2025 & 2033
- Figure 35: South America Veterinary MRI Industry Revenue Share (%), by Product Type 2025 & 2033
- Figure 36: South America Veterinary MRI Industry Revenue (billion), by Application 2025 & 2033
- Figure 37: South America Veterinary MRI Industry Revenue Share (%), by Application 2025 & 2033
- Figure 38: South America Veterinary MRI Industry Revenue (billion), by Animal Type 2025 & 2033
- Figure 39: South America Veterinary MRI Industry Revenue Share (%), by Animal Type 2025 & 2033
- Figure 40: South America Veterinary MRI Industry Revenue (billion), by Country 2025 & 2033
- Figure 41: South America Veterinary MRI Industry Revenue Share (%), by Country 2025 & 2033
List of Tables
- Table 1: Global Veterinary MRI Industry Revenue billion Forecast, by Product Type 2020 & 2033
- Table 2: Global Veterinary MRI Industry Revenue billion Forecast, by Application 2020 & 2033
- Table 3: Global Veterinary MRI Industry Revenue billion Forecast, by Animal Type 2020 & 2033
- Table 4: Global Veterinary MRI Industry Revenue billion Forecast, by Region 2020 & 2033
- Table 5: Global Veterinary MRI Industry Revenue billion Forecast, by Product Type 2020 & 2033
- Table 6: Global Veterinary MRI Industry Revenue billion Forecast, by Application 2020 & 2033
- Table 7: Global Veterinary MRI Industry Revenue billion Forecast, by Animal Type 2020 & 2033
- Table 8: Global Veterinary MRI Industry Revenue billion Forecast, by Country 2020 & 2033
- Table 9: United States Veterinary MRI Industry Revenue (billion) Forecast, by Application 2020 & 2033
- Table 10: Canada Veterinary MRI Industry Revenue (billion) Forecast, by Application 2020 & 2033
- Table 11: Mexico Veterinary MRI Industry Revenue (billion) Forecast, by Application 2020 & 2033
- Table 12: Global Veterinary MRI Industry Revenue billion Forecast, by Product Type 2020 & 2033
- Table 13: Global Veterinary MRI Industry Revenue billion Forecast, by Application 2020 & 2033
- Table 14: Global Veterinary MRI Industry Revenue billion Forecast, by Animal Type 2020 & 2033
- Table 15: Global Veterinary MRI Industry Revenue billion Forecast, by Country 2020 & 2033
- Table 16: United Kingdom Veterinary MRI Industry Revenue (billion) Forecast, by Application 2020 & 2033
- Table 17: Germany Veterinary MRI Industry Revenue (billion) Forecast, by Application 2020 & 2033
- Table 18: France Veterinary MRI Industry Revenue (billion) Forecast, by Application 2020 & 2033
- Table 19: Italy Veterinary MRI Industry Revenue (billion) Forecast, by Application 2020 & 2033
- Table 20: Spain Veterinary MRI Industry Revenue (billion) Forecast, by Application 2020 & 2033
- Table 21: Rest of Europe Veterinary MRI Industry Revenue (billion) Forecast, by Application 2020 & 2033
- Table 22: Global Veterinary MRI Industry Revenue billion Forecast, by Product Type 2020 & 2033
- Table 23: Global Veterinary MRI Industry Revenue billion Forecast, by Application 2020 & 2033
- Table 24: Global Veterinary MRI Industry Revenue billion Forecast, by Animal Type 2020 & 2033
- Table 25: Global Veterinary MRI Industry Revenue billion Forecast, by Country 2020 & 2033
- Table 26: China Veterinary MRI Industry Revenue (billion) Forecast, by Application 2020 & 2033
- Table 27: Japan Veterinary MRI Industry Revenue (billion) Forecast, by Application 2020 & 2033
- Table 28: India Veterinary MRI Industry Revenue (billion) Forecast, by Application 2020 & 2033
- Table 29: Australia Veterinary MRI Industry Revenue (billion) Forecast, by Application 2020 & 2033
- Table 30: South Korea Veterinary MRI Industry Revenue (billion) Forecast, by Application 2020 & 2033
- Table 31: Rest of Asia Pacific Veterinary MRI Industry Revenue (billion) Forecast, by Application 2020 & 2033
- Table 32: Global Veterinary MRI Industry Revenue billion Forecast, by Product Type 2020 & 2033
- Table 33: Global Veterinary MRI Industry Revenue billion Forecast, by Application 2020 & 2033
- Table 34: Global Veterinary MRI Industry Revenue billion Forecast, by Animal Type 2020 & 2033
- Table 35: Global Veterinary MRI Industry Revenue billion Forecast, by Country 2020 & 2033
- Table 36: GCC Veterinary MRI Industry Revenue (billion) Forecast, by Application 2020 & 2033
- Table 37: South Africa Veterinary MRI Industry Revenue (billion) Forecast, by Application 2020 & 2033
- Table 38: Rest of Middle East and Africa Veterinary MRI Industry Revenue (billion) Forecast, by Application 2020 & 2033
- Table 39: Global Veterinary MRI Industry Revenue billion Forecast, by Product Type 2020 & 2033
- Table 40: Global Veterinary MRI Industry Revenue billion Forecast, by Application 2020 & 2033
- Table 41: Global Veterinary MRI Industry Revenue billion Forecast, by Animal Type 2020 & 2033
- Table 42: Global Veterinary MRI Industry Revenue billion Forecast, by Country 2020 & 2033
- Table 43: Brazil Veterinary MRI Industry Revenue (billion) Forecast, by Application 2020 & 2033
- Table 44: Argentina Veterinary MRI Industry Revenue (billion) Forecast, by Application 2020 & 2033
- Table 45: Rest of South America Veterinary MRI Industry Revenue (billion) Forecast, by Application 2020 & 2033
Frequently Asked Questions
1. What is the projected Compound Annual Growth Rate (CAGR) of the Veterinary MRI Industry?
The projected CAGR is approximately 5.2%.
2. Which companies are prominent players in the Veterinary MRI Industry?
Key companies in the market include Esaote SpA, MR solutions, Mediso Ltd, Burgess Diagnostics Ltd, Hallmarq Veterinary Imaging Inc, Shenzhen Mindray Bio-Medical Electronics Co, Universal Medical Systems Inc, Imotek International Ltd, Bruker Corporation.
3. What are the main segments of the Veterinary MRI Industry?
The market segments include Product Type, Application, Animal Type.
4. Can you provide details about the market size?
The market size is estimated to be USD 2.7 billion as of 2022.
5. What are some drivers contributing to market growth?
Increased Pet Ownership and Initiatives for Animal Health; Technological Advancements in Veterinary Imaging.
6. What are the notable trends driving market growth?
Cardiology is Expected to Witness Healthy Growth in the Application Segment.
7. Are there any restraints impacting market growth?
High Cost of MRI Systems; Lack of Skilled Veterinarians.
8. Can you provide examples of recent developments in the market?
In April 2022, three new purpose-built clinics Veterinary Urgent Care Clinics launched in San Diego in Rancho Peñasquitos, Oceanside, and Irvine in Orange County.
9. What pricing options are available for accessing the report?
Pricing options include single-user, multi-user, and enterprise licenses priced at USD 4750, USD 5250, and USD 8750 respectively.
10. Is the market size provided in terms of value or volume?
The market size is provided in terms of value, measured in billion.
11. Are there any specific market keywords associated with the report?
Yes, the market keyword associated with the report is "Veterinary MRI Industry," which aids in identifying and referencing the specific market segment covered.
12. How do I determine which pricing option suits my needs best?
The pricing options vary based on user requirements and access needs. Individual users may opt for single-user licenses, while businesses requiring broader access may choose multi-user or enterprise licenses for cost-effective access to the report.
13. Are there any additional resources or data provided in the Veterinary MRI Industry report?
While the report offers comprehensive insights, it's advisable to review the specific contents or supplementary materials provided to ascertain if additional resources or data are available.
14. How can I stay updated on further developments or reports in the Veterinary MRI Industry?
To stay informed about further developments, trends, and reports in the Veterinary MRI Industry, consider subscribing to industry newsletters, following relevant companies and organizations, or regularly checking reputable industry news sources and publications.
Methodology
Step 1 - Identification of Relevant Samples Size from Population Database


Step 2 - Approaches for Defining Global Market Size (Value, Volume* & Price*)

Note*: In applicable scenarios
Step 3 - Data Sources
Primary Research
- Web Analytics
- Survey Reports
- Research Institute
- Latest Research Reports
- Opinion Leaders
Secondary Research
- Annual Reports
- White Paper
- Latest Press Release
- Industry Association
- Paid Database
- Investor Presentations

Step 4 - Data Triangulation
Involves using different sources of information in order to increase the validity of a study
These sources are likely to be stakeholders in a program - participants, other researchers, program staff, other community members, and so on.
Then we put all data in single framework & apply various statistical tools to find out the dynamic on the market.
During the analysis stage, feedback from the stakeholder groups would be compared to determine areas of agreement as well as areas of divergence