

Key Insights
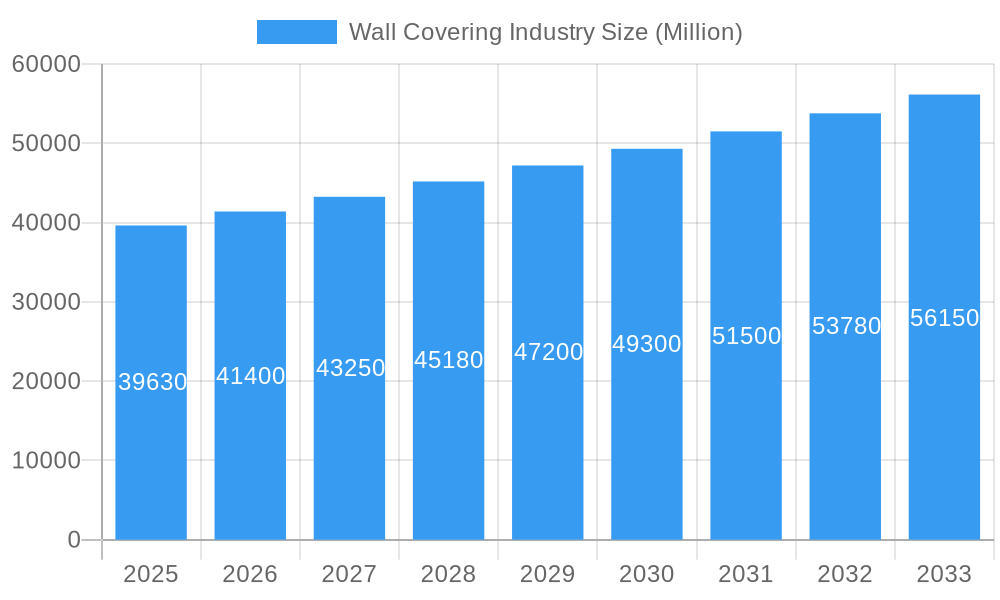
The global wall covering market, valued at $39.63 billion in 2025, is projected to experience robust growth, driven by a Compound Annual Growth Rate (CAGR) of 4.47% from 2025 to 2033. This expansion is fueled by several key factors. Firstly, the increasing focus on home renovation and interior design, particularly among millennials and Gen Z, is boosting demand for aesthetically pleasing and functional wall coverings. Secondly, the rise of e-commerce platforms has significantly broadened market accessibility and facilitated convenient purchasing. The diversification of product types, encompassing wall panels, wallpaper, tiles, and metal wall coverings, caters to diverse preferences and design styles, further stimulating market growth. Finally, the burgeoning commercial construction sector, particularly in developing economies, is a significant driver, as businesses prioritize creating visually appealing and functional spaces. While challenges exist, such as fluctuating raw material prices and potential environmental concerns related to certain manufacturing processes, the overall market outlook remains positive.
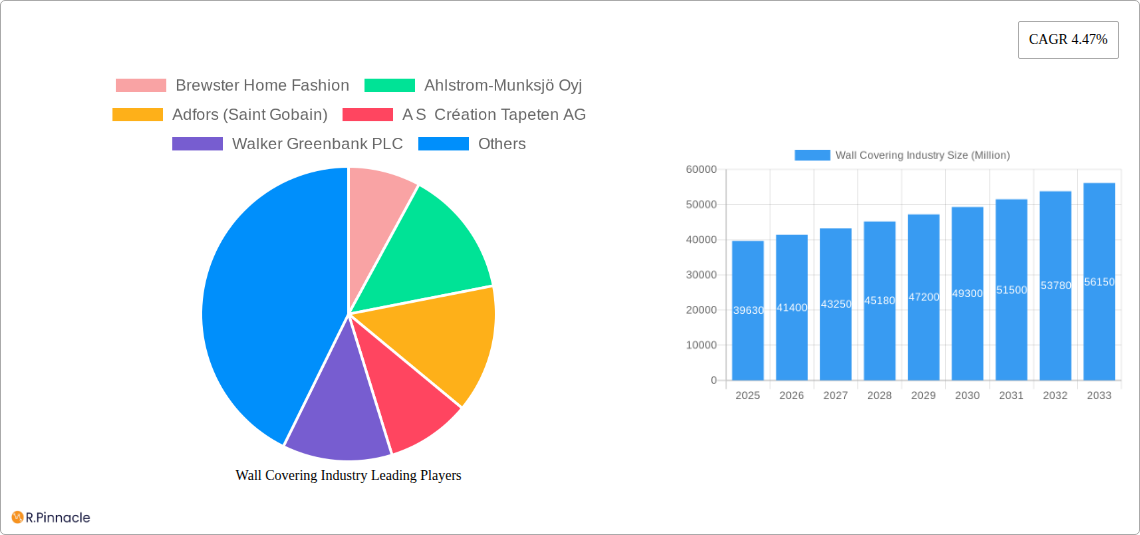
Wall Covering Industry Market Size (In Billion)
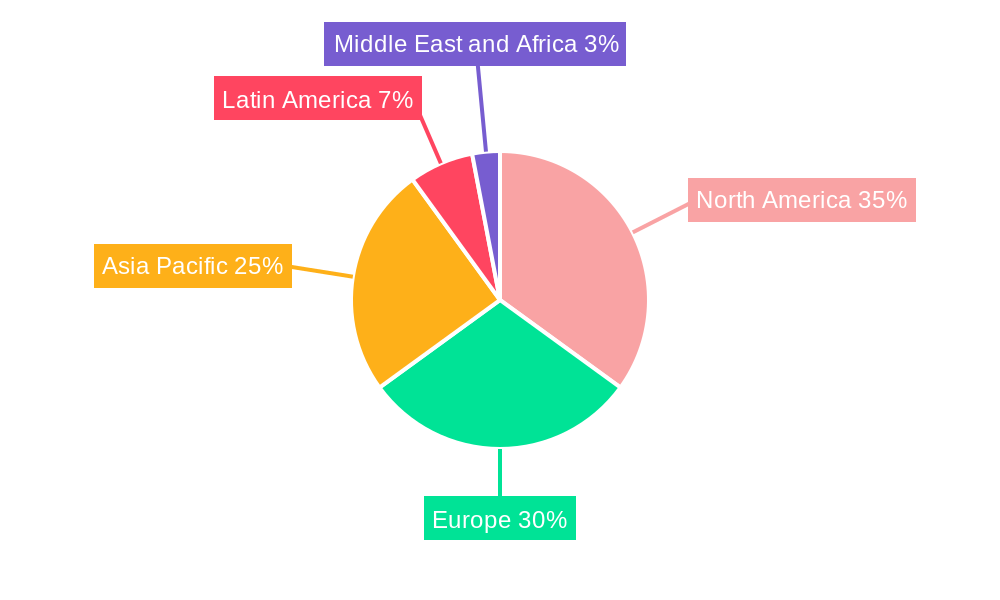
The market segmentation reveals significant opportunities. The residential sector currently dominates, but commercial applications are showing accelerated growth. E-commerce is rapidly gaining market share as a distribution channel, surpassing traditional channels like specialty stores and home centers in certain segments. Among product types, wallpaper maintains a substantial share, while wall panels are experiencing rapid growth, driven by their durability and ease of installation. Geographically, North America and Europe currently hold the largest market shares, but the Asia-Pacific region is exhibiting the most rapid growth potential, fuelled by rising disposable incomes and urbanization. Strategic investments in innovation, sustainable materials, and targeted marketing campaigns within key demographics will be critical for success in this dynamic and competitive market.
Wall Covering Industry Company Market Share
Wall Covering Industry Report: 2019-2033
This comprehensive report provides a detailed analysis of the global wall covering industry, encompassing market size, segmentation, trends, and future projections. With a study period spanning 2019-2033, a base year of 2025, and a forecast period of 2025-2033, this report offers invaluable insights for industry professionals, investors, and stakeholders seeking to navigate this dynamic market. The report projects a market value exceeding $XX Million by 2033.
Wall Covering Industry Market Structure & Innovation Trends
The global wall covering market exhibits a moderately consolidated structure, with several key players holding significant market share. Brewster Home Fashion, Ahlstrom-Munksjö Oyj, Adfors (Saint Gobain), A S Création Tapeten AG, Walker Greenbank PLC, Grandeco Wallfashion Group, Benjamin Moore & Co, J Josephson Inc, Asian Paints Ltd, and York Wallcoverings Inc are some of the prominent companies shaping the industry landscape. While precise market share data varies by segment, these companies collectively account for a substantial portion of the global market, estimated at over 50% in 2025.
Innovation in the wall covering industry is driven by several factors:
- Technological advancements: The development of new materials, printing techniques, and installation methods fuels innovation.
- Sustainability concerns: The increasing demand for eco-friendly and sustainable wall coverings is pushing companies to adopt innovative manufacturing processes and utilize recycled materials.
- Design trends: Evolving aesthetic preferences are driving the creation of new patterns, textures, and colors.
Mergers and acquisitions (M&A) have played a significant role in shaping the industry landscape. In recent years, there have been several notable deals, although specific deal values for many transactions remain undisclosed, contributing to a lack of publicly available information. The total M&A deal value in the industry between 2019 and 2024 is estimated to be $XX Million.
Wall Covering Industry Market Dynamics & Trends
The wall covering market is experiencing robust growth, driven by several key factors. The Compound Annual Growth Rate (CAGR) for the period 2025-2033 is projected to be XX%. This growth is fueled by:
- Rising disposable incomes: In several regions, increasing disposable incomes are leading to higher spending on home improvement and interior decoration.
- Urbanization: Rapid urbanization is creating a surge in demand for housing and commercial spaces, boosting the need for wall coverings.
- E-commerce growth: The expanding e-commerce sector is providing new channels for consumers to purchase wall coverings.
- Increased awareness about interior design: Growing awareness about interior design trends is driving interest in enhancing the aesthetics of residential and commercial spaces.
Technological disruptions, such as the introduction of 3D-printed wall coverings and digitally printed wallpapers, are further influencing market dynamics. While these technologies are still in their early stages of adoption, they are anticipated to significantly impact the industry in the coming years, potentially altering production processes and market segmentation.
The competitive landscape is characterized by intense competition among established players and emerging companies. This competition is mainly based on factors like product quality, design, price, and distribution channels. Market penetration for digitally printed wallpaper is growing at a CAGR of XX%, indicating a shifting consumer preference for personalized and customized wall coverings.
Dominant Regions & Segments in Wall Covering Industry
The North American and European regions currently dominate the global wall covering market, primarily driven by robust construction activities and high consumer spending. However, the Asia-Pacific region is projected to experience the fastest growth in the forecast period.
Key Drivers by Region:
- North America: Strong housing market, high consumer spending on home improvement, and technological advancements.
- Europe: High construction activity, a preference for premium wall coverings, and established manufacturing capabilities.
- Asia-Pacific: Rapid urbanization, economic growth, and rising disposable incomes.
Dominant Segments:
- By Distribution Channel: E-commerce is showing the fastest growth, driven by convenience and reach, while specialty stores still hold a large market share due to the ability to provide expert advice and customized solutions. Mass merchandisers are appealing due to competitive pricing.
- By Product Type: Wallpaper remains the largest segment, but wall panels are experiencing strong growth due to their durability and ease of installation.
- By Application: Residential remains the most dominant segment by application, although commercial applications are showing increasing growth due to renovation and construction projects.
Wall Covering Industry Product Innovations
Recent innovations include the use of sustainable materials, such as bamboo and recycled paper, in wallpaper production. The development of peel-and-stick wallpapers has simplified installation and increased their appeal to DIY enthusiasts. Digitally printed wallpapers offer personalized designs, creating a niche segment that drives innovation within the industry. Smart wall coverings, incorporating features like integrated lighting or soundproofing, are also emerging, signifying a transition towards technologically advanced wall treatments.
Report Scope & Segmentation Analysis
This report segments the wall covering market in the following ways:
By Distribution Channel: Specialty Store, Home Center, Building Material Dealer, Furniture Store, Mass Merchandizer, E-commerce, Other Distribution Channels. Each segment demonstrates unique growth trajectories, based on factors like pricing strategy, market reach, and consumer demographics.
By Product Type: Wall Panel, Wallpaper, Tile, Metal Wall Covering, Other Product Types. Growth within these segments is directly linked to technological advances, cost, and application versatility.
By Application: Commercial, Residential. Residential is a larger market currently, but commercial applications show strong growth potential driven by construction and renovation projects.
Market sizes and growth projections for each segment are detailed within the full report. Competitive analysis within each segment is also provided.
Key Drivers of Wall Covering Industry Growth
Several factors are driving the growth of the wall covering industry. Firstly, rising disposable incomes and increasing urbanization are creating greater demand for home improvements and commercial space enhancements. Secondly, the expansion of e-commerce platforms has broadened market access and opened new avenues for sales. Finally, technological advancements, such as improved printing techniques and the development of sustainable materials, are driving innovation and differentiation. This is further spurred by an increasing focus on aesthetic customization of interior spaces.
Challenges in the Wall Covering Industry Sector
The industry faces several challenges. Fluctuations in raw material prices, particularly for paper and other materials, impact profitability and pricing strategies. Supply chain disruptions can impact production and delivery timelines. Furthermore, intense competition from both established and emerging players requires a constant focus on product innovation and differentiation to maintain competitiveness and market share. Stringent environmental regulations also pose challenges in terms of compliance and material sourcing.
Emerging Opportunities in Wall Covering Industry
The growing demand for sustainable and eco-friendly wall coverings presents significant opportunities. The development of smart wall coverings with integrated technology (such as lighting or soundproofing) is another emerging area of significant growth. Additionally, there is potential for expansion into new geographical markets, especially in rapidly developing economies. Further customization options that align with a consumer's individual taste will also drive demand.
Leading Players in the Wall Covering Industry Market
- Brewster Home Fashion
- Ahlstrom-Munksjö Oyj
- Adfors (Saint Gobain)
- A S Création Tapeten AG
- Walker Greenbank PLC
- Grandeco Wallfashion Group
- Benjamin Moore & Co
- J Josephson Inc
- Asian Paints Ltd
- York Wallcoverings Inc
Key Developments in Wall Covering Industry
- May 2023: Asian Paints launched its home studio in Chennai, showcasing a new collection of home decor items, including wallpapers. This expansion strengthens their presence in the Indian market.
- August 2022: Sanderson Design Group partnered with Disney, securing licensing rights to produce Disney-themed wallpapers and textiles. This collaboration is likely to boost brand recognition and market share.
Future Outlook for Wall Covering Industry Market
The future of the wall covering industry looks promising, with continuous growth expected across various segments. The rising popularity of eco-friendly options, combined with advancements in technology, will further fuel market expansion. Strategic partnerships, product diversification, and a focus on sustainable practices will be crucial factors in determining future market leadership. The global market is projected to witness significant growth fueled by rising disposable incomes, rapid urbanization, and increasing consumer preference for aesthetic customization of living spaces.
Wall Covering Industry Segmentation
-
1. Product Type
- 1.1. Wall Panel
-
1.2. Wall Paper
- 1.2.1. Vinyl Wallpaper
- 1.2.2. Non-woven Wallpaper
- 1.2.3. Paper-based Wallpaper
- 1.2.4. Fabric Wallpaper
- 1.2.5. Other Wallpaper Types
- 1.3. Tile
- 1.4. Metal Wall Covering
- 1.5. Other Product Types
-
2. Application
- 2.1. Commercial
- 2.2. Residential
-
3. Distribution Channel
- 3.1. Specialty Store
- 3.2. Home Center
- 3.3. Building Material Dealer
- 3.4. Furniture Store
- 3.5. Mass Merchandizer
- 3.6. E-commerce
- 3.7. Other Distribution Channels
Wall Covering Industry Segmentation By Geography
-
1. North America
- 1.1. United States
- 1.2. Canada
-
2. Europe
- 2.1. United Kingdom
- 2.2. Germany
- 2.3. France
- 2.4. Spain
- 2.5. Italy
-
3. Asia Pacific
- 3.1. China
- 3.2. India
- 3.3. Japan
- 4. Australia and New Zealand
-
5. Latin America
- 5.1. Brazil
- 5.2. Mexico
- 5.3. Argentina
-
6. Middle East and Africa
- 6.1. Saudi Arabia
- 6.2. United Arab Emirates
- 6.3. South Africa
Wall Covering Industry Regional Market Share
Geographic Coverage of Wall Covering Industry
Wall Covering Industry REPORT HIGHLIGHTS
| Aspects | Details |
|---|---|
| Study Period | 2020-2034 |
| Base Year | 2025 |
| Estimated Year | 2026 |
| Forecast Period | 2026-2034 |
| Historical Period | 2020-2025 |
| Growth Rate | CAGR of 4.47% from 2020-2034 |
| Segmentation |
|
Table of Contents
- 1. Introduction
- 1.1. Research Scope
- 1.2. Market Segmentation
- 1.3. Research Objective
- 1.4. Definitions and Assumptions
- 2. Executive Summary
- 2.1. Market Snapshot
- 3. Market Dynamics
- 3.1. Market Drivers
- 3.2. Market Restrains
- 3.3. Market Trends
- 3.4. Market Opportunities
- 4. Market Factor Analysis
- 4.1. Porters Five Forces
- 4.1.1. Bargaining Power of Suppliers
- 4.1.2. Bargaining Power of Buyers
- 4.1.3. Threat of New Entrants
- 4.1.4. Threat of Substitutes
- 4.1.5. Competitive Rivalry
- 4.2. PESTEL analysis
- 4.3. BCG Analysis
- 4.3.1. Stars (High Growth, High Market Share)
- 4.3.2. Cash Cows (Low Growth, High Market Share)
- 4.3.3. Question Mark (High Growth, Low Market Share)
- 4.3.4. Dogs (Low Growth, Low Market Share)
- 4.4. Ansoff Matrix Analysis
- 4.5. Supply Chain Analysis
- 4.6. Regulatory Landscape
- 4.7. Current Market Potential and Opportunity Assessment (TAM–SAM–SOM Framework)
- 4.8. PRI Analyst Note
- 4.1. Porters Five Forces
- 5. Market Analysis, Insights and Forecast 2021-2033
- 5.1. Market Analysis, Insights and Forecast - by Product Type
- 5.1.1. Wall Panel
- 5.1.2. Wall Paper
- 5.1.2.1. Vinyl Wallpaper
- 5.1.2.2. Non-woven Wallpaper
- 5.1.2.3. Paper-based Wallpaper
- 5.1.2.4. Fabric Wallpaper
- 5.1.2.5. Other Wallpaper Types
- 5.1.3. Tile
- 5.1.4. Metal Wall Covering
- 5.1.5. Other Product Types
- 5.2. Market Analysis, Insights and Forecast - by Application
- 5.2.1. Commercial
- 5.2.2. Residential
- 5.3. Market Analysis, Insights and Forecast - by Distribution Channel
- 5.3.1. Specialty Store
- 5.3.2. Home Center
- 5.3.3. Building Material Dealer
- 5.3.4. Furniture Store
- 5.3.5. Mass Merchandizer
- 5.3.6. E-commerce
- 5.3.7. Other Distribution Channels
- 5.4. Market Analysis, Insights and Forecast - by Region
- 5.4.1. North America
- 5.4.2. Europe
- 5.4.3. Asia Pacific
- 5.4.4. Australia and New Zealand
- 5.4.5. Latin America
- 5.4.6. Middle East and Africa
- 5.1. Market Analysis, Insights and Forecast - by Product Type
- 6. Global Wall Covering Industry Analysis, Insights and Forecast, 2021-2033
- 6.1. Market Analysis, Insights and Forecast - by Product Type
- 6.1.1. Wall Panel
- 6.1.2. Wall Paper
- 6.1.2.1. Vinyl Wallpaper
- 6.1.2.2. Non-woven Wallpaper
- 6.1.2.3. Paper-based Wallpaper
- 6.1.2.4. Fabric Wallpaper
- 6.1.2.5. Other Wallpaper Types
- 6.1.3. Tile
- 6.1.4. Metal Wall Covering
- 6.1.5. Other Product Types
- 6.2. Market Analysis, Insights and Forecast - by Application
- 6.2.1. Commercial
- 6.2.2. Residential
- 6.3. Market Analysis, Insights and Forecast - by Distribution Channel
- 6.3.1. Specialty Store
- 6.3.2. Home Center
- 6.3.3. Building Material Dealer
- 6.3.4. Furniture Store
- 6.3.5. Mass Merchandizer
- 6.3.6. E-commerce
- 6.3.7. Other Distribution Channels
- 6.1. Market Analysis, Insights and Forecast - by Product Type
- 7. North America Wall Covering Industry Analysis, Insights and Forecast, 2020-2032
- 7.1. Market Analysis, Insights and Forecast - by Product Type
- 7.1.1. Wall Panel
- 7.1.2. Wall Paper
- 7.1.2.1. Vinyl Wallpaper
- 7.1.2.2. Non-woven Wallpaper
- 7.1.2.3. Paper-based Wallpaper
- 7.1.2.4. Fabric Wallpaper
- 7.1.2.5. Other Wallpaper Types
- 7.1.3. Tile
- 7.1.4. Metal Wall Covering
- 7.1.5. Other Product Types
- 7.2. Market Analysis, Insights and Forecast - by Application
- 7.2.1. Commercial
- 7.2.2. Residential
- 7.3. Market Analysis, Insights and Forecast - by Distribution Channel
- 7.3.1. Specialty Store
- 7.3.2. Home Center
- 7.3.3. Building Material Dealer
- 7.3.4. Furniture Store
- 7.3.5. Mass Merchandizer
- 7.3.6. E-commerce
- 7.3.7. Other Distribution Channels
- 7.1. Market Analysis, Insights and Forecast - by Product Type
- 8. Europe Wall Covering Industry Analysis, Insights and Forecast, 2020-2032
- 8.1. Market Analysis, Insights and Forecast - by Product Type
- 8.1.1. Wall Panel
- 8.1.2. Wall Paper
- 8.1.2.1. Vinyl Wallpaper
- 8.1.2.2. Non-woven Wallpaper
- 8.1.2.3. Paper-based Wallpaper
- 8.1.2.4. Fabric Wallpaper
- 8.1.2.5. Other Wallpaper Types
- 8.1.3. Tile
- 8.1.4. Metal Wall Covering
- 8.1.5. Other Product Types
- 8.2. Market Analysis, Insights and Forecast - by Application
- 8.2.1. Commercial
- 8.2.2. Residential
- 8.3. Market Analysis, Insights and Forecast - by Distribution Channel
- 8.3.1. Specialty Store
- 8.3.2. Home Center
- 8.3.3. Building Material Dealer
- 8.3.4. Furniture Store
- 8.3.5. Mass Merchandizer
- 8.3.6. E-commerce
- 8.3.7. Other Distribution Channels
- 8.1. Market Analysis, Insights and Forecast - by Product Type
- 9. Asia Pacific Wall Covering Industry Analysis, Insights and Forecast, 2020-2032
- 9.1. Market Analysis, Insights and Forecast - by Product Type
- 9.1.1. Wall Panel
- 9.1.2. Wall Paper
- 9.1.2.1. Vinyl Wallpaper
- 9.1.2.2. Non-woven Wallpaper
- 9.1.2.3. Paper-based Wallpaper
- 9.1.2.4. Fabric Wallpaper
- 9.1.2.5. Other Wallpaper Types
- 9.1.3. Tile
- 9.1.4. Metal Wall Covering
- 9.1.5. Other Product Types
- 9.2. Market Analysis, Insights and Forecast - by Application
- 9.2.1. Commercial
- 9.2.2. Residential
- 9.3. Market Analysis, Insights and Forecast - by Distribution Channel
- 9.3.1. Specialty Store
- 9.3.2. Home Center
- 9.3.3. Building Material Dealer
- 9.3.4. Furniture Store
- 9.3.5. Mass Merchandizer
- 9.3.6. E-commerce
- 9.3.7. Other Distribution Channels
- 9.1. Market Analysis, Insights and Forecast - by Product Type
- 10. Australia and New Zealand Wall Covering Industry Analysis, Insights and Forecast, 2020-2032
- 10.1. Market Analysis, Insights and Forecast - by Product Type
- 10.1.1. Wall Panel
- 10.1.2. Wall Paper
- 10.1.2.1. Vinyl Wallpaper
- 10.1.2.2. Non-woven Wallpaper
- 10.1.2.3. Paper-based Wallpaper
- 10.1.2.4. Fabric Wallpaper
- 10.1.2.5. Other Wallpaper Types
- 10.1.3. Tile
- 10.1.4. Metal Wall Covering
- 10.1.5. Other Product Types
- 10.2. Market Analysis, Insights and Forecast - by Application
- 10.2.1. Commercial
- 10.2.2. Residential
- 10.3. Market Analysis, Insights and Forecast - by Distribution Channel
- 10.3.1. Specialty Store
- 10.3.2. Home Center
- 10.3.3. Building Material Dealer
- 10.3.4. Furniture Store
- 10.3.5. Mass Merchandizer
- 10.3.6. E-commerce
- 10.3.7. Other Distribution Channels
- 10.1. Market Analysis, Insights and Forecast - by Product Type
- 11. Latin America Wall Covering Industry Analysis, Insights and Forecast, 2020-2032
- 11.1. Market Analysis, Insights and Forecast - by Product Type
- 11.1.1. Wall Panel
- 11.1.2. Wall Paper
- 11.1.2.1. Vinyl Wallpaper
- 11.1.2.2. Non-woven Wallpaper
- 11.1.2.3. Paper-based Wallpaper
- 11.1.2.4. Fabric Wallpaper
- 11.1.2.5. Other Wallpaper Types
- 11.1.3. Tile
- 11.1.4. Metal Wall Covering
- 11.1.5. Other Product Types
- 11.2. Market Analysis, Insights and Forecast - by Application
- 11.2.1. Commercial
- 11.2.2. Residential
- 11.3. Market Analysis, Insights and Forecast - by Distribution Channel
- 11.3.1. Specialty Store
- 11.3.2. Home Center
- 11.3.3. Building Material Dealer
- 11.3.4. Furniture Store
- 11.3.5. Mass Merchandizer
- 11.3.6. E-commerce
- 11.3.7. Other Distribution Channels
- 11.1. Market Analysis, Insights and Forecast - by Product Type
- 12. Middle East and Africa Wall Covering Industry Analysis, Insights and Forecast, 2020-2032
- 12.1. Market Analysis, Insights and Forecast - by Product Type
- 12.1.1. Wall Panel
- 12.1.2. Wall Paper
- 12.1.2.1. Vinyl Wallpaper
- 12.1.2.2. Non-woven Wallpaper
- 12.1.2.3. Paper-based Wallpaper
- 12.1.2.4. Fabric Wallpaper
- 12.1.2.5. Other Wallpaper Types
- 12.1.3. Tile
- 12.1.4. Metal Wall Covering
- 12.1.5. Other Product Types
- 12.2. Market Analysis, Insights and Forecast - by Application
- 12.2.1. Commercial
- 12.2.2. Residential
- 12.3. Market Analysis, Insights and Forecast - by Distribution Channel
- 12.3.1. Specialty Store
- 12.3.2. Home Center
- 12.3.3. Building Material Dealer
- 12.3.4. Furniture Store
- 12.3.5. Mass Merchandizer
- 12.3.6. E-commerce
- 12.3.7. Other Distribution Channels
- 12.1. Market Analysis, Insights and Forecast - by Product Type
- 13. Competitive Analysis
- 13.1. Company Profiles
- 13.1.1 Brewster Home Fashion
- 13.1.1.1. Company Overview
- 13.1.1.2. Products
- 13.1.1.3. Company Financials
- 13.1.1.4. SWOT Analysis
- 13.1.2 Ahlstrom-Munksjö Oyj
- 13.1.2.1. Company Overview
- 13.1.2.2. Products
- 13.1.2.3. Company Financials
- 13.1.2.4. SWOT Analysis
- 13.1.3 Adfors (Saint Gobain)
- 13.1.3.1. Company Overview
- 13.1.3.2. Products
- 13.1.3.3. Company Financials
- 13.1.3.4. SWOT Analysis
- 13.1.4 A S Création Tapeten AG
- 13.1.4.1. Company Overview
- 13.1.4.2. Products
- 13.1.4.3. Company Financials
- 13.1.4.4. SWOT Analysis
- 13.1.5 Walker Greenbank PLC
- 13.1.5.1. Company Overview
- 13.1.5.2. Products
- 13.1.5.3. Company Financials
- 13.1.5.4. SWOT Analysis
- 13.1.6 Grandeco Wallfashion Group
- 13.1.6.1. Company Overview
- 13.1.6.2. Products
- 13.1.6.3. Company Financials
- 13.1.6.4. SWOT Analysis
- 13.1.7 Benjamin Moore & Co
- 13.1.7.1. Company Overview
- 13.1.7.2. Products
- 13.1.7.3. Company Financials
- 13.1.7.4. SWOT Analysis
- 13.1.8 J Josephson Inc
- 13.1.8.1. Company Overview
- 13.1.8.2. Products
- 13.1.8.3. Company Financials
- 13.1.8.4. SWOT Analysis
- 13.1.9 Asian Paints Ltd
- 13.1.9.1. Company Overview
- 13.1.9.2. Products
- 13.1.9.3. Company Financials
- 13.1.9.4. SWOT Analysis
- 13.1.10 York Wallcoverings Inc
- 13.1.10.1. Company Overview
- 13.1.10.2. Products
- 13.1.10.3. Company Financials
- 13.1.10.4. SWOT Analysis
- 13.1.1 Brewster Home Fashion
- 13.2. Market Entropy
- 13.2.1 Company's Key Areas Served
- 13.2.2 Recent Developments
- 13.3. Company Market Share Analysis 2025
- 13.3.1 Top 5 Companies Market Share Analysis
- 13.3.2 Top 3 Companies Market Share Analysis
- 13.4. List of Potential Customers
- 14. Research Methodology
List of Figures
- Figure 1: Global Wall Covering Industry Revenue Breakdown (Million, %) by Region 2025 & 2033
- Figure 2: North America Wall Covering Industry Revenue (Million), by Product Type 2025 & 2033
- Figure 3: North America Wall Covering Industry Revenue Share (%), by Product Type 2025 & 2033
- Figure 4: North America Wall Covering Industry Revenue (Million), by Application 2025 & 2033
- Figure 5: North America Wall Covering Industry Revenue Share (%), by Application 2025 & 2033
- Figure 6: North America Wall Covering Industry Revenue (Million), by Distribution Channel 2025 & 2033
- Figure 7: North America Wall Covering Industry Revenue Share (%), by Distribution Channel 2025 & 2033
- Figure 8: North America Wall Covering Industry Revenue (Million), by Country 2025 & 2033
- Figure 9: North America Wall Covering Industry Revenue Share (%), by Country 2025 & 2033
- Figure 10: Europe Wall Covering Industry Revenue (Million), by Product Type 2025 & 2033
- Figure 11: Europe Wall Covering Industry Revenue Share (%), by Product Type 2025 & 2033
- Figure 12: Europe Wall Covering Industry Revenue (Million), by Application 2025 & 2033
- Figure 13: Europe Wall Covering Industry Revenue Share (%), by Application 2025 & 2033
- Figure 14: Europe Wall Covering Industry Revenue (Million), by Distribution Channel 2025 & 2033
- Figure 15: Europe Wall Covering Industry Revenue Share (%), by Distribution Channel 2025 & 2033
- Figure 16: Europe Wall Covering Industry Revenue (Million), by Country 2025 & 2033
- Figure 17: Europe Wall Covering Industry Revenue Share (%), by Country 2025 & 2033
- Figure 18: Asia Pacific Wall Covering Industry Revenue (Million), by Product Type 2025 & 2033
- Figure 19: Asia Pacific Wall Covering Industry Revenue Share (%), by Product Type 2025 & 2033
- Figure 20: Asia Pacific Wall Covering Industry Revenue (Million), by Application 2025 & 2033
- Figure 21: Asia Pacific Wall Covering Industry Revenue Share (%), by Application 2025 & 2033
- Figure 22: Asia Pacific Wall Covering Industry Revenue (Million), by Distribution Channel 2025 & 2033
- Figure 23: Asia Pacific Wall Covering Industry Revenue Share (%), by Distribution Channel 2025 & 2033
- Figure 24: Asia Pacific Wall Covering Industry Revenue (Million), by Country 2025 & 2033
- Figure 25: Asia Pacific Wall Covering Industry Revenue Share (%), by Country 2025 & 2033
- Figure 26: Australia and New Zealand Wall Covering Industry Revenue (Million), by Product Type 2025 & 2033
- Figure 27: Australia and New Zealand Wall Covering Industry Revenue Share (%), by Product Type 2025 & 2033
- Figure 28: Australia and New Zealand Wall Covering Industry Revenue (Million), by Application 2025 & 2033
- Figure 29: Australia and New Zealand Wall Covering Industry Revenue Share (%), by Application 2025 & 2033
- Figure 30: Australia and New Zealand Wall Covering Industry Revenue (Million), by Distribution Channel 2025 & 2033
- Figure 31: Australia and New Zealand Wall Covering Industry Revenue Share (%), by Distribution Channel 2025 & 2033
- Figure 32: Australia and New Zealand Wall Covering Industry Revenue (Million), by Country 2025 & 2033
- Figure 33: Australia and New Zealand Wall Covering Industry Revenue Share (%), by Country 2025 & 2033
- Figure 34: Latin America Wall Covering Industry Revenue (Million), by Product Type 2025 & 2033
- Figure 35: Latin America Wall Covering Industry Revenue Share (%), by Product Type 2025 & 2033
- Figure 36: Latin America Wall Covering Industry Revenue (Million), by Application 2025 & 2033
- Figure 37: Latin America Wall Covering Industry Revenue Share (%), by Application 2025 & 2033
- Figure 38: Latin America Wall Covering Industry Revenue (Million), by Distribution Channel 2025 & 2033
- Figure 39: Latin America Wall Covering Industry Revenue Share (%), by Distribution Channel 2025 & 2033
- Figure 40: Latin America Wall Covering Industry Revenue (Million), by Country 2025 & 2033
- Figure 41: Latin America Wall Covering Industry Revenue Share (%), by Country 2025 & 2033
- Figure 42: Middle East and Africa Wall Covering Industry Revenue (Million), by Product Type 2025 & 2033
- Figure 43: Middle East and Africa Wall Covering Industry Revenue Share (%), by Product Type 2025 & 2033
- Figure 44: Middle East and Africa Wall Covering Industry Revenue (Million), by Application 2025 & 2033
- Figure 45: Middle East and Africa Wall Covering Industry Revenue Share (%), by Application 2025 & 2033
- Figure 46: Middle East and Africa Wall Covering Industry Revenue (Million), by Distribution Channel 2025 & 2033
- Figure 47: Middle East and Africa Wall Covering Industry Revenue Share (%), by Distribution Channel 2025 & 2033
- Figure 48: Middle East and Africa Wall Covering Industry Revenue (Million), by Country 2025 & 2033
- Figure 49: Middle East and Africa Wall Covering Industry Revenue Share (%), by Country 2025 & 2033
List of Tables
- Table 1: Global Wall Covering Industry Revenue Million Forecast, by Product Type 2020 & 2033
- Table 2: Global Wall Covering Industry Revenue Million Forecast, by Application 2020 & 2033
- Table 3: Global Wall Covering Industry Revenue Million Forecast, by Distribution Channel 2020 & 2033
- Table 4: Global Wall Covering Industry Revenue Million Forecast, by Region 2020 & 2033
- Table 5: Global Wall Covering Industry Revenue Million Forecast, by Product Type 2020 & 2033
- Table 6: Global Wall Covering Industry Revenue Million Forecast, by Application 2020 & 2033
- Table 7: Global Wall Covering Industry Revenue Million Forecast, by Distribution Channel 2020 & 2033
- Table 8: Global Wall Covering Industry Revenue Million Forecast, by Country 2020 & 2033
- Table 9: United States Wall Covering Industry Revenue (Million) Forecast, by Application 2020 & 2033
- Table 10: Canada Wall Covering Industry Revenue (Million) Forecast, by Application 2020 & 2033
- Table 11: Global Wall Covering Industry Revenue Million Forecast, by Product Type 2020 & 2033
- Table 12: Global Wall Covering Industry Revenue Million Forecast, by Application 2020 & 2033
- Table 13: Global Wall Covering Industry Revenue Million Forecast, by Distribution Channel 2020 & 2033
- Table 14: Global Wall Covering Industry Revenue Million Forecast, by Country 2020 & 2033
- Table 15: United Kingdom Wall Covering Industry Revenue (Million) Forecast, by Application 2020 & 2033
- Table 16: Germany Wall Covering Industry Revenue (Million) Forecast, by Application 2020 & 2033
- Table 17: France Wall Covering Industry Revenue (Million) Forecast, by Application 2020 & 2033
- Table 18: Spain Wall Covering Industry Revenue (Million) Forecast, by Application 2020 & 2033
- Table 19: Italy Wall Covering Industry Revenue (Million) Forecast, by Application 2020 & 2033
- Table 20: Global Wall Covering Industry Revenue Million Forecast, by Product Type 2020 & 2033
- Table 21: Global Wall Covering Industry Revenue Million Forecast, by Application 2020 & 2033
- Table 22: Global Wall Covering Industry Revenue Million Forecast, by Distribution Channel 2020 & 2033
- Table 23: Global Wall Covering Industry Revenue Million Forecast, by Country 2020 & 2033
- Table 24: China Wall Covering Industry Revenue (Million) Forecast, by Application 2020 & 2033
- Table 25: India Wall Covering Industry Revenue (Million) Forecast, by Application 2020 & 2033
- Table 26: Japan Wall Covering Industry Revenue (Million) Forecast, by Application 2020 & 2033
- Table 27: Global Wall Covering Industry Revenue Million Forecast, by Product Type 2020 & 2033
- Table 28: Global Wall Covering Industry Revenue Million Forecast, by Application 2020 & 2033
- Table 29: Global Wall Covering Industry Revenue Million Forecast, by Distribution Channel 2020 & 2033
- Table 30: Global Wall Covering Industry Revenue Million Forecast, by Country 2020 & 2033
- Table 31: Global Wall Covering Industry Revenue Million Forecast, by Product Type 2020 & 2033
- Table 32: Global Wall Covering Industry Revenue Million Forecast, by Application 2020 & 2033
- Table 33: Global Wall Covering Industry Revenue Million Forecast, by Distribution Channel 2020 & 2033
- Table 34: Global Wall Covering Industry Revenue Million Forecast, by Country 2020 & 2033
- Table 35: Brazil Wall Covering Industry Revenue (Million) Forecast, by Application 2020 & 2033
- Table 36: Mexico Wall Covering Industry Revenue (Million) Forecast, by Application 2020 & 2033
- Table 37: Argentina Wall Covering Industry Revenue (Million) Forecast, by Application 2020 & 2033
- Table 38: Global Wall Covering Industry Revenue Million Forecast, by Product Type 2020 & 2033
- Table 39: Global Wall Covering Industry Revenue Million Forecast, by Application 2020 & 2033
- Table 40: Global Wall Covering Industry Revenue Million Forecast, by Distribution Channel 2020 & 2033
- Table 41: Global Wall Covering Industry Revenue Million Forecast, by Country 2020 & 2033
- Table 42: Saudi Arabia Wall Covering Industry Revenue (Million) Forecast, by Application 2020 & 2033
- Table 43: United Arab Emirates Wall Covering Industry Revenue (Million) Forecast, by Application 2020 & 2033
- Table 44: South Africa Wall Covering Industry Revenue (Million) Forecast, by Application 2020 & 2033
Frequently Asked Questions
1. What is the projected Compound Annual Growth Rate (CAGR) of the Wall Covering Industry?
The projected CAGR is approximately 4.47%.
2. Which companies are prominent players in the Wall Covering Industry?
Key companies in the market include Brewster Home Fashion, Ahlstrom-Munksjö Oyj, Adfors (Saint Gobain), A S Création Tapeten AG, Walker Greenbank PLC, Grandeco Wallfashion Group, Benjamin Moore & Co, J Josephson Inc, Asian Paints Ltd, York Wallcoverings Inc.
3. What are the main segments of the Wall Covering Industry?
The market segments include Product Type, Application, Distribution Channel.
4. Can you provide details about the market size?
The market size is estimated to be USD 39.63 Million as of 2022.
5. What are some drivers contributing to market growth?
Increasing Number of Residential Buildings; Availability of Styled Products; Increase in Do-it-yourself (DIY) Trends.
6. What are the notable trends driving market growth?
Wall Panel Segment is Expected Hold Significant Market Share.
7. Are there any restraints impacting market growth?
Limiting Availability and High Cost of Raw Materials.
8. Can you provide examples of recent developments in the market?
May 2023: Asian Paints announced the launch of the homes studio in Chennai and the 2023 collection for home decor. The studio offers a garden selection of fabrics, wallpapers, bedding, and rugs.
9. What pricing options are available for accessing the report?
Pricing options include single-user, multi-user, and enterprise licenses priced at USD 4750, USD 5250, and USD 8750 respectively.
10. Is the market size provided in terms of value or volume?
The market size is provided in terms of value, measured in Million.
11. Are there any specific market keywords associated with the report?
Yes, the market keyword associated with the report is "Wall Covering Industry," which aids in identifying and referencing the specific market segment covered.
12. How do I determine which pricing option suits my needs best?
The pricing options vary based on user requirements and access needs. Individual users may opt for single-user licenses, while businesses requiring broader access may choose multi-user or enterprise licenses for cost-effective access to the report.
13. Are there any additional resources or data provided in the Wall Covering Industry report?
While the report offers comprehensive insights, it's advisable to review the specific contents or supplementary materials provided to ascertain if additional resources or data are available.
14. How can I stay updated on further developments or reports in the Wall Covering Industry?
To stay informed about further developments, trends, and reports in the Wall Covering Industry, consider subscribing to industry newsletters, following relevant companies and organizations, or regularly checking reputable industry news sources and publications.
Methodology
Step 1 - Identification of Relevant Samples Size from Population Database


Step 2 - Approaches for Defining Global Market Size (Value, Volume* & Price*)

Note*: In applicable scenarios
Step 3 - Data Sources
Primary Research
- Web Analytics
- Survey Reports
- Research Institute
- Latest Research Reports
- Opinion Leaders
Secondary Research
- Annual Reports
- White Paper
- Latest Press Release
- Industry Association
- Paid Database
- Investor Presentations

Step 4 - Data Triangulation
Involves using different sources of information in order to increase the validity of a study
These sources are likely to be stakeholders in a program - participants, other researchers, program staff, other community members, and so on.
Then we put all data in single framework & apply various statistical tools to find out the dynamic on the market.
During the analysis stage, feedback from the stakeholder groups would be compared to determine areas of agreement as well as areas of divergence