

Key Insights
The global whiplash protection systems market is experiencing significant expansion, propelled by increased vehicle production, a rise in road accidents, and evolving safety regulations advocating for advanced safety features. The market, valued at $8.93 billion in its base year of 2025, is forecast to grow at a Compound Annual Growth Rate (CAGR) of 8.42%. This growth is primarily driven by the increasing integration of proactive head restraints, offering superior protection over traditional systems. Technological advancements in sensor technology, AI, and materials science are also enabling the development of more effective whiplash protection solutions. While passenger cars currently lead the market, commercial vehicles are projected for substantial growth due to heightened safety demands in fleets. North America and Europe represent established markets, with Asia-Pacific emerging as a high-growth region driven by rising vehicle sales and infrastructure development. Challenges include the initial cost of advanced systems and the need for greater consumer education.
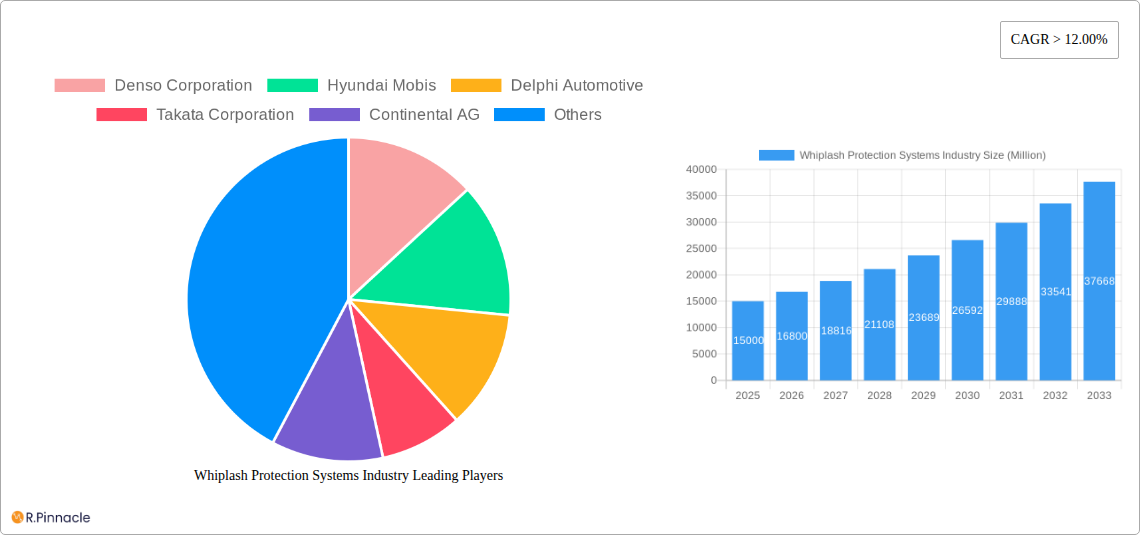
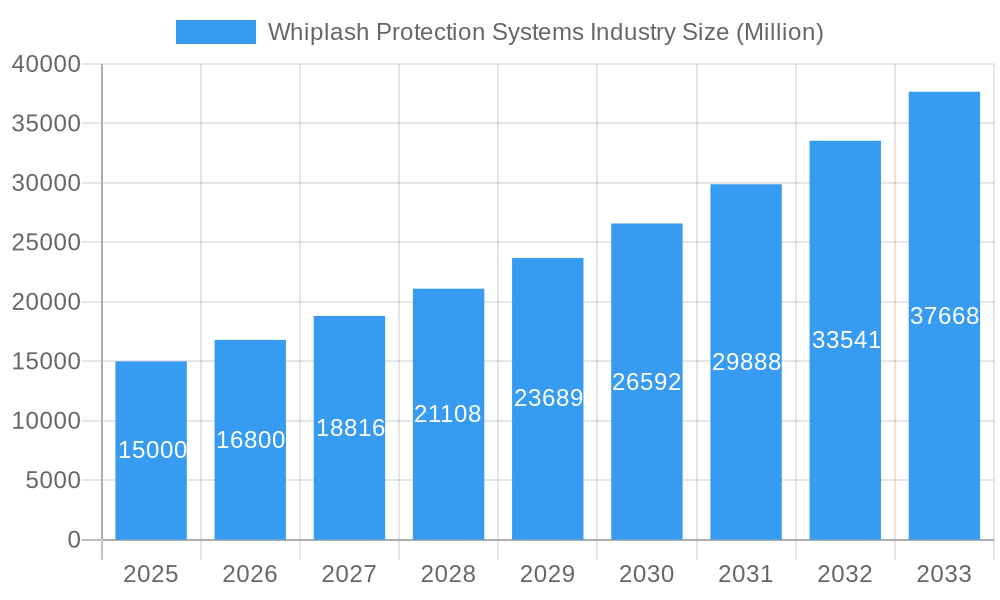
Whiplash Protection Systems Industry Market Size (In Billion)
The outlook for the whiplash protection systems market remains highly optimistic, fueled by ongoing innovation and tightening global safety standards. Key industry players, including Denso, Hyundai Mobis, Autoliv, and Bosch, are leading the development of advanced systems. Strategic collaborations, mergers, and acquisitions are anticipated as companies aim to enhance market presence and technological expertise. Furthermore, the drive towards lightweight vehicle construction, without compromising safety, will continue to stimulate innovation in whiplash protection systems.
Whiplash Protection Systems Industry Company Market Share
Whiplash Protection Systems Market Report: 2019-2033 Forecast
This comprehensive report provides an in-depth analysis of the global Whiplash Protection Systems industry, offering invaluable insights for industry professionals, investors, and strategic decision-makers. The study period covers 2019-2033, with 2025 as the base and estimated year. The report projects a market valued at $XX Million in 2025, experiencing significant growth throughout the forecast period (2025-2033).
Whiplash Protection Systems Industry Market Structure & Innovation Trends
The Whiplash Protection Systems market is moderately concentrated, with key players such as Denso Corporation, Hyundai Mobis, Delphi Automotive, Takata Corporation, Continental AG, Autoliv Inc, Robert Bosch GmbH, Lear Corporation, Wabco, Grammer AG, and others holding significant market share. The exact market share for each company is not readily available at the time of writing but can be obtained from the complete report. Innovation is driven by stringent safety regulations, increasing consumer demand for enhanced vehicle safety, and the continuous development of advanced technologies like proactive head restraints. Mergers and acquisitions (M&A) activity has been moderate in recent years, with deal values totaling approximately $XX Million in the historical period (2019-2024). The market faces competitive pressures from substitute products like improved seat designs and advanced airbag systems. The end-user demographic is primarily automotive manufacturers and their supply chains, including Tier 1 and Tier 2 suppliers.
- Market Concentration: Moderately concentrated.
- Innovation Drivers: Safety regulations, consumer demand, technological advancements.
- M&A Activity: $XX Million (2019-2024).
- Product Substitutes: Improved seat designs, advanced airbags.
Whiplash Protection Systems Industry Market Dynamics & Trends
The global Whiplash Protection Systems market exhibits a robust Compound Annual Growth Rate (CAGR) of XX% during the forecast period (2025-2033), driven by several key factors. Rising vehicle production, particularly in developing economies, is a significant growth driver. The increasing adoption of advanced driver-assistance systems (ADAS) and autonomous driving technologies further fuels demand for enhanced safety features, including advanced whiplash protection systems. Consumer preferences are shifting towards vehicles equipped with comprehensive safety features, thereby impacting market penetration positively. Technological advancements, including the development of lighter, more effective, and cost-efficient materials, are shaping the competitive landscape. Market penetration of proactive head restraints is expected to increase significantly. The intensifying competition among market participants is driving innovation and price optimization within the industry.
Dominant Regions & Segments in Whiplash Protection Systems Industry
The North American region currently dominates the Whiplash Protection Systems market, driven by stringent safety standards and high vehicle ownership rates. Within vehicle types, Passenger Cars represent the largest segment. In terms of system types, the Reactive Head Restraint segment currently holds the largest market share. However, the Proactive Head Restraint segment is poised for significant growth due to its advanced functionalities and increasing adoption.
- North America: Stringent safety regulations, high vehicle ownership.
- Passenger Cars: Largest segment due to high vehicle production.
- Reactive Head Restraint: Largest market share, but Proactive Head Restraint is a rapidly growing segment.
- Commercial Vehicle: Significant growth potential due to increased focus on driver safety.
Whiplash Protection Systems Industry Product Innovations
Recent product innovations focus on integrating lighter materials to reduce vehicle weight without compromising safety performance, improving system responsiveness, and incorporating advanced sensors for better whiplash mitigation. These advancements enhance safety and improve fuel efficiency, making the systems increasingly attractive to manufacturers. The market trend points toward more sophisticated and integrated systems offering superior protection and enhanced vehicle ergonomics.
Report Scope & Segmentation Analysis
This report segments the Whiplash Protection Systems market by:
Vehicle Type: Passenger Cars (XX Million in 2025, XX% CAGR), Commercial Vehicle (XX Million in 2025, XX% CAGR). Passenger Car segment is predicted to maintain its dominance driven by high volume production, whereas Commercial Vehicle segment is expected to grow faster due to increased safety regulations for commercial fleets.
System Type: Reactive Head Restraint (XX Million in 2025, XX% CAGR), Proactive Head Restraint (XX Million in 2025, XX% CAGR), Others (XX Million in 2025, XX% CAGR). Proactive head restraints are anticipated to experience higher growth due to technological advancements and improved safety capabilities compared to reactive restraints. Others include a variety of emerging technologies in the field.
Each segment analysis includes market size projections, competitive landscape assessments, and growth drivers.
Key Drivers of Whiplash Protection Systems Industry Growth
Several key factors contribute to the growth of this market. Stringent government regulations regarding vehicle safety are a major driver, mandating the inclusion of effective whiplash protection systems in new vehicles. Technological advancements, particularly in sensor technology and materials science, are leading to the development of more efficient and cost-effective systems. Increasing consumer awareness of vehicle safety and a growing preference for advanced safety features further bolster market growth.
Challenges in the Whiplash Protection Systems Industry Sector
The industry faces challenges such as fluctuating raw material prices, which directly impact production costs. Supply chain disruptions can cause delays and affect production output. Intense competition among established players and the emergence of new entrants pose a constant pressure on profit margins. Meeting stringent regulatory compliance requirements across different regions adds complexity and increases operational expenses. These challenges can collectively affect market expansion.
Emerging Opportunities in Whiplash Protection Systems Industry
Emerging markets, particularly in developing countries, present significant growth opportunities. The integration of Whiplash Protection Systems with ADAS and autonomous driving technologies will generate new market segments. Developments in lightweight materials and improved sensor technologies offer opportunities for innovation and improved cost-effectiveness.
Leading Players in the Whiplash Protection Systems Industry Market
Key Developments in Whiplash Protection Systems Industry Industry
- January 2023: Autoliv Inc. launched a new generation of whiplash protection system incorporating advanced sensor technology.
- June 2022: Denso Corporation and Hyundai Mobis announced a joint venture to develop next-generation whiplash protection systems.
- (Add other relevant developments with dates)
Future Outlook for Whiplash Protection Systems Industry Market
The future outlook for the Whiplash Protection Systems market is positive, driven by continuous technological advancements, increasing safety regulations, and rising consumer awareness. The market is expected to witness significant growth, particularly in emerging markets and segments like proactive head restraints and integration with autonomous driving features. Strategic partnerships, collaborations, and investments in research and development will further shape the market's trajectory and offer lucrative opportunities for key players.
Whiplash Protection Systems Industry Segmentation
-
1. Vehicle Type
- 1.1. Passenger Cars
- 1.2. Commercial Vehicle
-
2. System Type
- 2.1. Reactive Head Restraint
- 2.2. Proactive Head Restraint
- 2.3. Others
Whiplash Protection Systems Industry Segmentation By Geography
-
1. North America
- 1.1. United States
- 1.2. Canada
- 1.3. Rest of North America
-
2. Europe
- 2.1. Germany
- 2.2. United Kingdom
- 2.3. France
- 2.4. Italy
- 2.5. Rest of Europe
-
3. Asia Pacific
- 3.1. India
- 3.2. China
- 3.3. Japan
- 3.4. South Korea
- 3.5. Rest of Asia Pacific
-
4. Rest of the World
- 4.1. Brazil
- 4.2. Mexico
- 4.3. South Africa
- 4.4. Other Countries
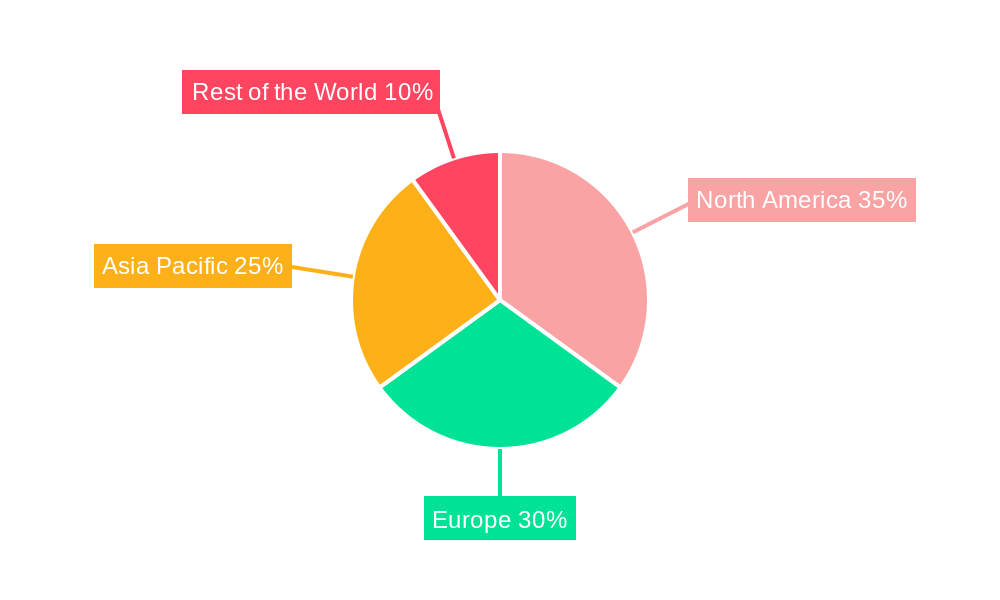
Whiplash Protection Systems Industry Regional Market Share
Geographic Coverage of Whiplash Protection Systems Industry
Whiplash Protection Systems Industry REPORT HIGHLIGHTS
| Aspects | Details |
|---|---|
| Study Period | 2020-2034 |
| Base Year | 2025 |
| Estimated Year | 2026 |
| Forecast Period | 2026-2034 |
| Historical Period | 2020-2025 |
| Growth Rate | CAGR of 8.42% from 2020-2034 |
| Segmentation |
|
Table of Contents
- 1. Introduction
- 1.1. Research Scope
- 1.2. Market Segmentation
- 1.3. Research Objective
- 1.4. Definitions and Assumptions
- 2. Executive Summary
- 2.1. Market Snapshot
- 3. Market Dynamics
- 3.1. Market Drivers
- 3.2. Market Restrains
- 3.3. Market Trends
- 3.4. Market Opportunities
- 4. Market Factor Analysis
- 4.1. Porters Five Forces
- 4.1.1. Bargaining Power of Suppliers
- 4.1.2. Bargaining Power of Buyers
- 4.1.3. Threat of New Entrants
- 4.1.4. Threat of Substitutes
- 4.1.5. Competitive Rivalry
- 4.2. PESTEL analysis
- 4.3. BCG Analysis
- 4.3.1. Stars (High Growth, High Market Share)
- 4.3.2. Cash Cows (Low Growth, High Market Share)
- 4.3.3. Question Mark (High Growth, Low Market Share)
- 4.3.4. Dogs (Low Growth, Low Market Share)
- 4.4. Ansoff Matrix Analysis
- 4.5. Supply Chain Analysis
- 4.6. Regulatory Landscape
- 4.7. Current Market Potential and Opportunity Assessment (TAM–SAM–SOM Framework)
- 4.8. PRI Analyst Note
- 4.1. Porters Five Forces
- 5. Market Analysis, Insights and Forecast 2021-2033
- 5.1. Market Analysis, Insights and Forecast - by Vehicle Type
- 5.1.1. Passenger Cars
- 5.1.2. Commercial Vehicle
- 5.2. Market Analysis, Insights and Forecast - by System Type
- 5.2.1. Reactive Head Restraint
- 5.2.2. Proactive Head Restraint
- 5.2.3. Others
- 5.3. Market Analysis, Insights and Forecast - by Region
- 5.3.1. North America
- 5.3.2. Europe
- 5.3.3. Asia Pacific
- 5.3.4. Rest of the World
- 5.1. Market Analysis, Insights and Forecast - by Vehicle Type
- 6. Global Whiplash Protection Systems Industry Analysis, Insights and Forecast, 2021-2033
- 6.1. Market Analysis, Insights and Forecast - by Vehicle Type
- 6.1.1. Passenger Cars
- 6.1.2. Commercial Vehicle
- 6.2. Market Analysis, Insights and Forecast - by System Type
- 6.2.1. Reactive Head Restraint
- 6.2.2. Proactive Head Restraint
- 6.2.3. Others
- 6.1. Market Analysis, Insights and Forecast - by Vehicle Type
- 7. North America Whiplash Protection Systems Industry Analysis, Insights and Forecast, 2020-2032
- 7.1. Market Analysis, Insights and Forecast - by Vehicle Type
- 7.1.1. Passenger Cars
- 7.1.2. Commercial Vehicle
- 7.2. Market Analysis, Insights and Forecast - by System Type
- 7.2.1. Reactive Head Restraint
- 7.2.2. Proactive Head Restraint
- 7.2.3. Others
- 7.1. Market Analysis, Insights and Forecast - by Vehicle Type
- 8. Europe Whiplash Protection Systems Industry Analysis, Insights and Forecast, 2020-2032
- 8.1. Market Analysis, Insights and Forecast - by Vehicle Type
- 8.1.1. Passenger Cars
- 8.1.2. Commercial Vehicle
- 8.2. Market Analysis, Insights and Forecast - by System Type
- 8.2.1. Reactive Head Restraint
- 8.2.2. Proactive Head Restraint
- 8.2.3. Others
- 8.1. Market Analysis, Insights and Forecast - by Vehicle Type
- 9. Asia Pacific Whiplash Protection Systems Industry Analysis, Insights and Forecast, 2020-2032
- 9.1. Market Analysis, Insights and Forecast - by Vehicle Type
- 9.1.1. Passenger Cars
- 9.1.2. Commercial Vehicle
- 9.2. Market Analysis, Insights and Forecast - by System Type
- 9.2.1. Reactive Head Restraint
- 9.2.2. Proactive Head Restraint
- 9.2.3. Others
- 9.1. Market Analysis, Insights and Forecast - by Vehicle Type
- 10. Rest of the World Whiplash Protection Systems Industry Analysis, Insights and Forecast, 2020-2032
- 10.1. Market Analysis, Insights and Forecast - by Vehicle Type
- 10.1.1. Passenger Cars
- 10.1.2. Commercial Vehicle
- 10.2. Market Analysis, Insights and Forecast - by System Type
- 10.2.1. Reactive Head Restraint
- 10.2.2. Proactive Head Restraint
- 10.2.3. Others
- 10.1. Market Analysis, Insights and Forecast - by Vehicle Type
- 11. Competitive Analysis
- 11.1. Company Profiles
- 11.1.1 Denso Corporation
- 11.1.1.1. Company Overview
- 11.1.1.2. Products
- 11.1.1.3. Company Financials
- 11.1.1.4. SWOT Analysis
- 11.1.2 Hyundai Mobis
- 11.1.2.1. Company Overview
- 11.1.2.2. Products
- 11.1.2.3. Company Financials
- 11.1.2.4. SWOT Analysis
- 11.1.3 Delphi Automotive
- 11.1.3.1. Company Overview
- 11.1.3.2. Products
- 11.1.3.3. Company Financials
- 11.1.3.4. SWOT Analysis
- 11.1.4 Takata Corporation
- 11.1.4.1. Company Overview
- 11.1.4.2. Products
- 11.1.4.3. Company Financials
- 11.1.4.4. SWOT Analysis
- 11.1.5 Continental AG
- 11.1.5.1. Company Overview
- 11.1.5.2. Products
- 11.1.5.3. Company Financials
- 11.1.5.4. SWOT Analysis
- 11.1.6 Autoliv Inc
- 11.1.6.1. Company Overview
- 11.1.6.2. Products
- 11.1.6.3. Company Financials
- 11.1.6.4. SWOT Analysis
- 11.1.7 Robert Bosch GmbH
- 11.1.7.1. Company Overview
- 11.1.7.2. Products
- 11.1.7.3. Company Financials
- 11.1.7.4. SWOT Analysis
- 11.1.8 Lear Corporation
- 11.1.8.1. Company Overview
- 11.1.8.2. Products
- 11.1.8.3. Company Financials
- 11.1.8.4. SWOT Analysis
- 11.1.9 Wabco*List Not Exhaustive
- 11.1.9.1. Company Overview
- 11.1.9.2. Products
- 11.1.9.3. Company Financials
- 11.1.9.4. SWOT Analysis
- 11.1.10 Grammer AG
- 11.1.10.1. Company Overview
- 11.1.10.2. Products
- 11.1.10.3. Company Financials
- 11.1.10.4. SWOT Analysis
- 11.1.1 Denso Corporation
- 11.2. Market Entropy
- 11.2.1 Company's Key Areas Served
- 11.2.2 Recent Developments
- 11.3. Company Market Share Analysis 2025
- 11.3.1 Top 5 Companies Market Share Analysis
- 11.3.2 Top 3 Companies Market Share Analysis
- 11.4. List of Potential Customers
- 12. Research Methodology
List of Figures
- Figure 1: Global Whiplash Protection Systems Industry Revenue Breakdown (billion, %) by Region 2025 & 2033
- Figure 2: North America Whiplash Protection Systems Industry Revenue (billion), by Vehicle Type 2025 & 2033
- Figure 3: North America Whiplash Protection Systems Industry Revenue Share (%), by Vehicle Type 2025 & 2033
- Figure 4: North America Whiplash Protection Systems Industry Revenue (billion), by System Type 2025 & 2033
- Figure 5: North America Whiplash Protection Systems Industry Revenue Share (%), by System Type 2025 & 2033
- Figure 6: North America Whiplash Protection Systems Industry Revenue (billion), by Country 2025 & 2033
- Figure 7: North America Whiplash Protection Systems Industry Revenue Share (%), by Country 2025 & 2033
- Figure 8: Europe Whiplash Protection Systems Industry Revenue (billion), by Vehicle Type 2025 & 2033
- Figure 9: Europe Whiplash Protection Systems Industry Revenue Share (%), by Vehicle Type 2025 & 2033
- Figure 10: Europe Whiplash Protection Systems Industry Revenue (billion), by System Type 2025 & 2033
- Figure 11: Europe Whiplash Protection Systems Industry Revenue Share (%), by System Type 2025 & 2033
- Figure 12: Europe Whiplash Protection Systems Industry Revenue (billion), by Country 2025 & 2033
- Figure 13: Europe Whiplash Protection Systems Industry Revenue Share (%), by Country 2025 & 2033
- Figure 14: Asia Pacific Whiplash Protection Systems Industry Revenue (billion), by Vehicle Type 2025 & 2033
- Figure 15: Asia Pacific Whiplash Protection Systems Industry Revenue Share (%), by Vehicle Type 2025 & 2033
- Figure 16: Asia Pacific Whiplash Protection Systems Industry Revenue (billion), by System Type 2025 & 2033
- Figure 17: Asia Pacific Whiplash Protection Systems Industry Revenue Share (%), by System Type 2025 & 2033
- Figure 18: Asia Pacific Whiplash Protection Systems Industry Revenue (billion), by Country 2025 & 2033
- Figure 19: Asia Pacific Whiplash Protection Systems Industry Revenue Share (%), by Country 2025 & 2033
- Figure 20: Rest of the World Whiplash Protection Systems Industry Revenue (billion), by Vehicle Type 2025 & 2033
- Figure 21: Rest of the World Whiplash Protection Systems Industry Revenue Share (%), by Vehicle Type 2025 & 2033
- Figure 22: Rest of the World Whiplash Protection Systems Industry Revenue (billion), by System Type 2025 & 2033
- Figure 23: Rest of the World Whiplash Protection Systems Industry Revenue Share (%), by System Type 2025 & 2033
- Figure 24: Rest of the World Whiplash Protection Systems Industry Revenue (billion), by Country 2025 & 2033
- Figure 25: Rest of the World Whiplash Protection Systems Industry Revenue Share (%), by Country 2025 & 2033
List of Tables
- Table 1: Global Whiplash Protection Systems Industry Revenue billion Forecast, by Vehicle Type 2020 & 2033
- Table 2: Global Whiplash Protection Systems Industry Revenue billion Forecast, by System Type 2020 & 2033
- Table 3: Global Whiplash Protection Systems Industry Revenue billion Forecast, by Region 2020 & 2033
- Table 4: Global Whiplash Protection Systems Industry Revenue billion Forecast, by Vehicle Type 2020 & 2033
- Table 5: Global Whiplash Protection Systems Industry Revenue billion Forecast, by System Type 2020 & 2033
- Table 6: Global Whiplash Protection Systems Industry Revenue billion Forecast, by Country 2020 & 2033
- Table 7: United States Whiplash Protection Systems Industry Revenue (billion) Forecast, by Application 2020 & 2033
- Table 8: Canada Whiplash Protection Systems Industry Revenue (billion) Forecast, by Application 2020 & 2033
- Table 9: Rest of North America Whiplash Protection Systems Industry Revenue (billion) Forecast, by Application 2020 & 2033
- Table 10: Global Whiplash Protection Systems Industry Revenue billion Forecast, by Vehicle Type 2020 & 2033
- Table 11: Global Whiplash Protection Systems Industry Revenue billion Forecast, by System Type 2020 & 2033
- Table 12: Global Whiplash Protection Systems Industry Revenue billion Forecast, by Country 2020 & 2033
- Table 13: Germany Whiplash Protection Systems Industry Revenue (billion) Forecast, by Application 2020 & 2033
- Table 14: United Kingdom Whiplash Protection Systems Industry Revenue (billion) Forecast, by Application 2020 & 2033
- Table 15: France Whiplash Protection Systems Industry Revenue (billion) Forecast, by Application 2020 & 2033
- Table 16: Italy Whiplash Protection Systems Industry Revenue (billion) Forecast, by Application 2020 & 2033
- Table 17: Rest of Europe Whiplash Protection Systems Industry Revenue (billion) Forecast, by Application 2020 & 2033
- Table 18: Global Whiplash Protection Systems Industry Revenue billion Forecast, by Vehicle Type 2020 & 2033
- Table 19: Global Whiplash Protection Systems Industry Revenue billion Forecast, by System Type 2020 & 2033
- Table 20: Global Whiplash Protection Systems Industry Revenue billion Forecast, by Country 2020 & 2033
- Table 21: India Whiplash Protection Systems Industry Revenue (billion) Forecast, by Application 2020 & 2033
- Table 22: China Whiplash Protection Systems Industry Revenue (billion) Forecast, by Application 2020 & 2033
- Table 23: Japan Whiplash Protection Systems Industry Revenue (billion) Forecast, by Application 2020 & 2033
- Table 24: South Korea Whiplash Protection Systems Industry Revenue (billion) Forecast, by Application 2020 & 2033
- Table 25: Rest of Asia Pacific Whiplash Protection Systems Industry Revenue (billion) Forecast, by Application 2020 & 2033
- Table 26: Global Whiplash Protection Systems Industry Revenue billion Forecast, by Vehicle Type 2020 & 2033
- Table 27: Global Whiplash Protection Systems Industry Revenue billion Forecast, by System Type 2020 & 2033
- Table 28: Global Whiplash Protection Systems Industry Revenue billion Forecast, by Country 2020 & 2033
- Table 29: Brazil Whiplash Protection Systems Industry Revenue (billion) Forecast, by Application 2020 & 2033
- Table 30: Mexico Whiplash Protection Systems Industry Revenue (billion) Forecast, by Application 2020 & 2033
- Table 31: South Africa Whiplash Protection Systems Industry Revenue (billion) Forecast, by Application 2020 & 2033
- Table 32: Other Countries Whiplash Protection Systems Industry Revenue (billion) Forecast, by Application 2020 & 2033
Frequently Asked Questions
1. What is the projected Compound Annual Growth Rate (CAGR) of the Whiplash Protection Systems Industry?
The projected CAGR is approximately 8.42%.
2. Which companies are prominent players in the Whiplash Protection Systems Industry?
Key companies in the market include Denso Corporation, Hyundai Mobis, Delphi Automotive, Takata Corporation, Continental AG, Autoliv Inc, Robert Bosch GmbH, Lear Corporation, Wabco*List Not Exhaustive, Grammer AG.
3. What are the main segments of the Whiplash Protection Systems Industry?
The market segments include Vehicle Type, System Type.
4. Can you provide details about the market size?
The market size is estimated to be USD 8.93 billion as of 2022.
5. What are some drivers contributing to market growth?
ADOPTION OF STEER-BY-WIRE SYSTEM AIDING MARKET GROWTH; Others.
6. What are the notable trends driving market growth?
Technological Developments Will Help This Market Grow.
7. Are there any restraints impacting market growth?
RAW MATERIAL PRICE INCREASES ARE EXPECTED TO STIFLE MARKET GROWTH; Others.
8. Can you provide examples of recent developments in the market?
N/A
9. What pricing options are available for accessing the report?
Pricing options include single-user, multi-user, and enterprise licenses priced at USD 4750, USD 5250, and USD 8750 respectively.
10. Is the market size provided in terms of value or volume?
The market size is provided in terms of value, measured in billion.
11. Are there any specific market keywords associated with the report?
Yes, the market keyword associated with the report is "Whiplash Protection Systems Industry," which aids in identifying and referencing the specific market segment covered.
12. How do I determine which pricing option suits my needs best?
The pricing options vary based on user requirements and access needs. Individual users may opt for single-user licenses, while businesses requiring broader access may choose multi-user or enterprise licenses for cost-effective access to the report.
13. Are there any additional resources or data provided in the Whiplash Protection Systems Industry report?
While the report offers comprehensive insights, it's advisable to review the specific contents or supplementary materials provided to ascertain if additional resources or data are available.
14. How can I stay updated on further developments or reports in the Whiplash Protection Systems Industry?
To stay informed about further developments, trends, and reports in the Whiplash Protection Systems Industry, consider subscribing to industry newsletters, following relevant companies and organizations, or regularly checking reputable industry news sources and publications.
Methodology
Step 1 - Identification of Relevant Samples Size from Population Database


Step 2 - Approaches for Defining Global Market Size (Value, Volume* & Price*)

Note*: In applicable scenarios
Step 3 - Data Sources
Primary Research
- Web Analytics
- Survey Reports
- Research Institute
- Latest Research Reports
- Opinion Leaders
Secondary Research
- Annual Reports
- White Paper
- Latest Press Release
- Industry Association
- Paid Database
- Investor Presentations

Step 4 - Data Triangulation
Involves using different sources of information in order to increase the validity of a study
These sources are likely to be stakeholders in a program - participants, other researchers, program staff, other community members, and so on.
Then we put all data in single framework & apply various statistical tools to find out the dynamic on the market.
During the analysis stage, feedback from the stakeholder groups would be compared to determine areas of agreement as well as areas of divergence