Key Insights
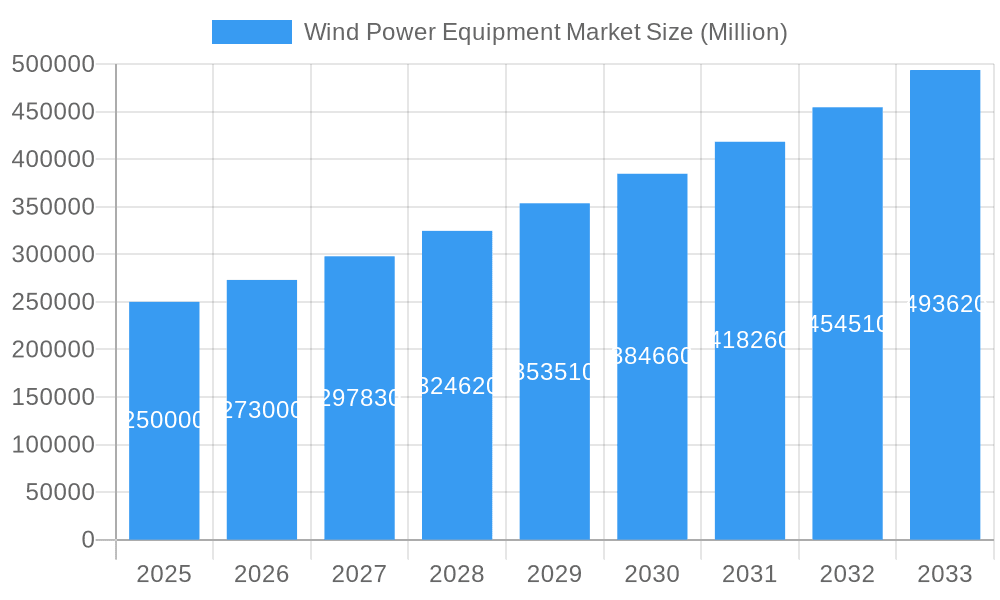
The global wind power equipment market is experiencing robust growth, driven by increasing concerns about climate change and the urgent need for renewable energy sources. A 9.12% CAGR indicates a significant expansion, projected to reach substantial value by 2033. This growth is fueled by supportive government policies promoting renewable energy adoption, decreasing costs of wind turbine technology, and a rising demand for cleaner electricity generation across various sectors. Key market segments, including onshore and offshore wind projects, show strong potential, with offshore installations likely to witness faster expansion due to the vast untapped potential in this area. The equipment types, such as rotors/blades, towers, and generators, all contribute significantly to the market value, with ongoing innovation in materials and design leading to enhanced efficiency and cost reductions. Major players like Vestas, Siemens Gamesa, and Goldwind are actively investing in research and development, expanding their manufacturing capacities, and forging strategic partnerships to consolidate their market positions and capitalize on the expanding market opportunities. The geographic distribution reveals significant regional variations, with North America, Europe, and Asia-Pacific leading the market. China, in particular, plays a crucial role in global wind power equipment manufacturing and deployment. However, challenges remain, including grid infrastructure limitations in certain regions, potential permitting delays, and fluctuating commodity prices impacting production costs. Nevertheless, the long-term outlook for the wind power equipment market remains exceptionally positive, fueled by continued technological advancements, supportive policies, and growing global energy demands.
Wind Power Equipment Market Market Size (In Billion)

The market segmentation offers valuable insights. Onshore wind projects currently dominate due to lower installation costs and easier access, but offshore installations are expected to experience accelerated growth in the coming years, driven by higher energy yields and less visual impact. Within equipment types, the rotor/blade segment commands a substantial share, followed by towers and generators. The "Other Equipment Types" category reflects the growing sophistication of wind farms, encompassing advanced technologies like energy storage solutions and smart grid integration components. Competition is intense, with established players alongside emerging companies vying for market share. Strategic collaborations, mergers and acquisitions, and continuous technological innovation are vital to success in this dynamic market landscape. The regional data highlights the concentrated nature of the market, but emerging markets in Asia Pacific, Latin America, and the Middle East and Africa present significant future growth opportunities. Careful consideration of regional regulatory frameworks and local market conditions will be crucial for companies aiming to achieve global reach.
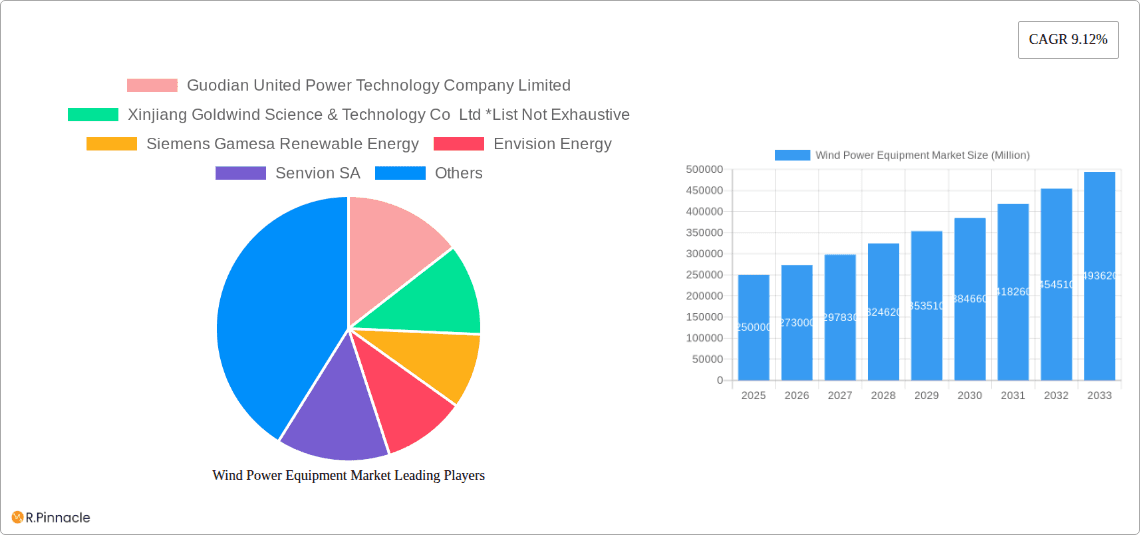
Wind Power Equipment Market Company Market Share
Wind Power Equipment Market Report: 2019-2033
This comprehensive report provides a detailed analysis of the global Wind Power Equipment Market, offering actionable insights for industry professionals and investors. The study period covers 2019-2033, with 2025 as the base year and forecast period extending to 2033. We delve into market dynamics, segmentation, key players, and future growth prospects, providing a 360° view of this rapidly evolving sector.
Wind Power Equipment Market Structure & Innovation Trends
This section analyzes the market concentration, highlighting the market share of key players like Vestas Wind Systems AS, Siemens Gamesa Renewable Energy, and Goldwind, alongside emerging competitors. We examine innovation drivers such as advancements in turbine technology (e.g., larger rotor diameters, higher capacity factors) and the role of government policies and subsidies in shaping the market landscape. Regulatory frameworks impacting the manufacturing and deployment of wind power equipment are also explored. The analysis includes a review of M&A activities, including deal values and their impact on market consolidation. The report also considers the impact of substitute technologies and end-user demographics on market growth.
- Market Concentration: High concentration with a few dominant players controlling significant market share. xx% of the market is controlled by the top 5 players (estimated).
- Innovation Drivers: Advancements in blade design, improved generator efficiency, and smart grid integration.
- Regulatory Frameworks: Government policies promoting renewable energy, feed-in tariffs, and carbon emission reduction targets are driving demand.
- M&A Activities: Significant M&A activity observed in recent years, with deal values exceeding xx Million in the last 5 years (estimated).
Wind Power Equipment Market Dynamics & Trends
This section delves into the key dynamics shaping the wind power equipment market. We explore market growth drivers, examining factors like increasing demand for renewable energy, supportive government policies, and declining equipment costs. Technological disruptions, such as the development of floating offshore wind turbines and advancements in energy storage solutions are analyzed. We also consider shifts in consumer preferences toward sustainable energy and the impact of geopolitical factors on the market. Competitive dynamics, including pricing strategies and technological advancements of leading players, are discussed. The report projects a CAGR of xx% during the forecast period, with increasing market penetration in key regions.
Dominant Regions & Segments in Wind Power Equipment Market
This section identifies the leading regions and segments within the wind power equipment market. We analyze onshore and offshore wind segments, examining their respective growth drivers, challenges, and market sizes. Further, we dissect the market by equipment type: Rotor/Blade, Tower, Generator, and Other Equipment Types, providing detailed analysis for each segment.
Dominant Regions:
- Europe: Strong governmental support for renewable energy and established infrastructure.
- Asia-Pacific: Rapid economic growth, increasing energy demands, and government incentives are driving market expansion.
- North America: Growing focus on renewable energy and supportive policy frameworks contribute to market growth.
Dominant Segments:
- Onshore: Continues to be the largest segment due to established infrastructure and lower installation costs.
- Offshore: Experiencing rapid growth due to advancements in turbine technology and increasing capacity.
- Rotor/Blade: Largest segment by equipment type due to continual development in blade size and efficiency.
- Tower: Steady growth mirroring the overall market trends.
- Generator: Significant technological advancements driving growth.
Detailed analysis including economic policies and infrastructure development impacting each segment and region is provided within the report.
Wind Power Equipment Market Product Innovations
Recent years have witnessed significant product innovations, including the development of larger, more efficient wind turbines with longer blades and improved generator designs. These advancements have led to increased energy generation capacity and reduced levelized cost of energy. Furthermore, the industry is exploring new materials and manufacturing techniques to enhance durability and reduce costs. The market is witnessing a growing adoption of digital technologies for predictive maintenance and operational optimization. These innovations improve the overall efficiency and lifespan of wind power equipment, making them a more attractive option for investors and developers.
Report Scope & Segmentation Analysis
The report provides a detailed segmentation analysis of the wind power equipment market across various parameters.
By Location: Onshore and Offshore, with individual growth projections and market size estimates for each segment. Onshore is expected to hold a larger market share initially, while offshore is projected to grow at a faster rate during the forecast period.
By Equipment Type: Rotor/Blade, Tower, Generator, and Other Equipment Types. Each segment’s growth trajectory, market size, and competitive landscape are discussed. The Rotor/Blade segment is expected to hold a significant market share. Competitive dynamics are analyzed for each segment, discussing key players and their strategies.
Key Drivers of Wind Power Equipment Market Growth
The growth of the wind power equipment market is primarily driven by the increasing global demand for renewable energy sources, stringent environmental regulations aimed at reducing greenhouse gas emissions, and supportive government policies promoting the adoption of wind energy. Falling technology costs and advancements in turbine technology further contribute to market growth. The development of smart grids and efficient energy storage solutions are also driving adoption.
Challenges in the Wind Power Equipment Market Sector
The wind power equipment market faces challenges such as the intermittent nature of wind energy, dependence on weather patterns, and the high initial capital investment required for project development. Supply chain disruptions can significantly impact the manufacturing and deployment of equipment. Competition from other renewable energy sources, and regulatory hurdles in different regions also pose challenges. These factors contribute to fluctuating demand and potential delays in project execution impacting overall revenue.
Emerging Opportunities in Wind Power Equipment Market
Emerging opportunities in the wind power equipment market include the growth of offshore wind, the development of floating offshore wind farms, and the increasing integration of wind energy into smart grids and microgrids. Expansion into new markets, such as developing economies with high renewable energy potential, presents further opportunities. Technological advancements in energy storage solutions and digitalization of the industry offer additional avenues for growth.
Leading Players in the Wind Power Equipment Market Market
Key Developments in Wind Power Equipment Market Industry
- May 2023: Suzlon secures a 69 MW wind energy order in India, deploying 23 x 3 MW WTGs with HLT towers.
- October 2022: Suzlon Group wins a 144.9 MW order from Aditya Birla Group, installing 69 x 2.1 MW WTGs with HLT towers in Gujarat and Madhya Pradesh.
- January 2022: The Blue Circle and CleanTech Global Renewables Inc. sign a contract for a 1.2 GW offshore wind project in the Philippines, featuring 100 x 12 MW turbines.
Future Outlook for Wind Power Equipment Market Market
The future outlook for the wind power equipment market is positive, driven by growing global demand for renewable energy and supportive government policies. Technological advancements, cost reductions, and the increasing competitiveness of wind energy are expected to fuel market growth. Strategic partnerships, technological innovations, and expansion into new markets will be crucial for success in this dynamic sector. The market is expected to witness significant growth over the forecast period, driven by several factors, including increased investment in renewable energy projects and government initiatives aimed at reducing carbon emissions.
Wind Power Equipment Market Segmentation
-
1. Location
- 1.1. Onshore
- 1.2. Offshore
-
2. Equipment Type
- 2.1. Rotor/Blade
- 2.2. Tower
- 2.3. Generator
- 2.4. Other Equipment Types
Wind Power Equipment Market Segmentation By Geography
-
1. North America
- 1.1. United States of America
- 1.2. Canada
- 1.3. Rest of the North America
-
2. Europe
- 2.1. United Kingdom
- 2.2. France
- 2.3. Norway
- 2.4. Italy
- 2.5. Germany
- 2.6. Rest of the Europe
-
3. Asia Pacific
- 3.1. China
- 3.2. India
- 3.3. Japan
- 3.4. Rest of the Asia Pacific
-
4. Middle East and Africa
- 4.1. United Arab Emirates
- 4.2. Saudi Arabia
- 4.3. South Africa
- 4.4. Rest of the Middle East and Africa
-
5. South America
- 5.1. Brazil
- 5.2. Argentina
- 5.3. Rest of the South America
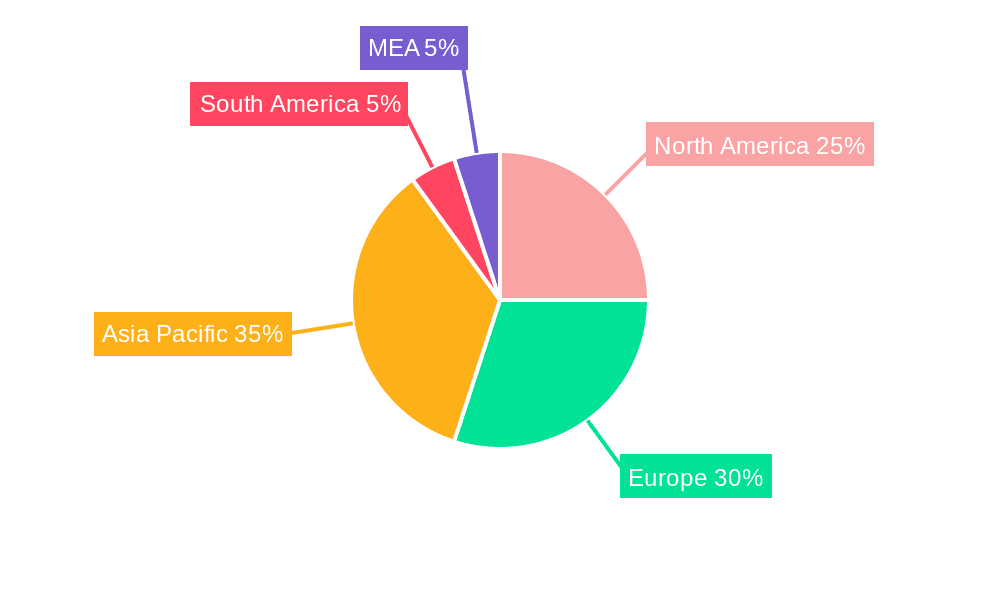
Wind Power Equipment Market Regional Market Share
Geographic Coverage of Wind Power Equipment Market
Wind Power Equipment Market REPORT HIGHLIGHTS
| Aspects | Details |
|---|---|
| Study Period | 2020-2034 |
| Base Year | 2025 |
| Estimated Year | 2026 |
| Forecast Period | 2026-2034 |
| Historical Period | 2020-2025 |
| Growth Rate | CAGR of 6.5% from 2020-2034 |
| Segmentation |
|
Table of Contents
- 1. Introduction
- 1.1. Research Scope
- 1.2. Market Segmentation
- 1.3. Research Methodology
- 1.4. Definitions and Assumptions
- 2. Executive Summary
- 2.1. Introduction
- 3. Market Dynamics
- 3.1. Introduction
- 3.2. Market Drivers
- 3.2.1. 4.; The Declining Cost of Wind Energy4.; Increasing Investments in the Wind Power Sector
- 3.3. Market Restrains
- 3.3.1. 4.; Substitution From Solar Energy and Gas-Fired Power Plants
- 3.4. Market Trends
- 3.4.1. Increasing Demand from Onshore Wind Power Industry
- 4. Market Factor Analysis
- 4.1. Porters Five Forces
- 4.2. Supply/Value Chain
- 4.3. PESTEL analysis
- 4.4. Market Entropy
- 4.5. Patent/Trademark Analysis
- 5. Global Wind Power Equipment Market Analysis, Insights and Forecast, 2020-2032
- 5.1. Market Analysis, Insights and Forecast - by Location
- 5.1.1. Onshore
- 5.1.2. Offshore
- 5.2. Market Analysis, Insights and Forecast - by Equipment Type
- 5.2.1. Rotor/Blade
- 5.2.2. Tower
- 5.2.3. Generator
- 5.2.4. Other Equipment Types
- 5.3. Market Analysis, Insights and Forecast - by Region
- 5.3.1. North America
- 5.3.2. Europe
- 5.3.3. Asia Pacific
- 5.3.4. Middle East and Africa
- 5.3.5. South America
- 5.1. Market Analysis, Insights and Forecast - by Location
- 6. North America Wind Power Equipment Market Analysis, Insights and Forecast, 2020-2032
- 6.1. Market Analysis, Insights and Forecast - by Location
- 6.1.1. Onshore
- 6.1.2. Offshore
- 6.2. Market Analysis, Insights and Forecast - by Equipment Type
- 6.2.1. Rotor/Blade
- 6.2.2. Tower
- 6.2.3. Generator
- 6.2.4. Other Equipment Types
- 6.1. Market Analysis, Insights and Forecast - by Location
- 7. Europe Wind Power Equipment Market Analysis, Insights and Forecast, 2020-2032
- 7.1. Market Analysis, Insights and Forecast - by Location
- 7.1.1. Onshore
- 7.1.2. Offshore
- 7.2. Market Analysis, Insights and Forecast - by Equipment Type
- 7.2.1. Rotor/Blade
- 7.2.2. Tower
- 7.2.3. Generator
- 7.2.4. Other Equipment Types
- 7.1. Market Analysis, Insights and Forecast - by Location
- 8. Asia Pacific Wind Power Equipment Market Analysis, Insights and Forecast, 2020-2032
- 8.1. Market Analysis, Insights and Forecast - by Location
- 8.1.1. Onshore
- 8.1.2. Offshore
- 8.2. Market Analysis, Insights and Forecast - by Equipment Type
- 8.2.1. Rotor/Blade
- 8.2.2. Tower
- 8.2.3. Generator
- 8.2.4. Other Equipment Types
- 8.1. Market Analysis, Insights and Forecast - by Location
- 9. Middle East and Africa Wind Power Equipment Market Analysis, Insights and Forecast, 2020-2032
- 9.1. Market Analysis, Insights and Forecast - by Location
- 9.1.1. Onshore
- 9.1.2. Offshore
- 9.2. Market Analysis, Insights and Forecast - by Equipment Type
- 9.2.1. Rotor/Blade
- 9.2.2. Tower
- 9.2.3. Generator
- 9.2.4. Other Equipment Types
- 9.1. Market Analysis, Insights and Forecast - by Location
- 10. South America Wind Power Equipment Market Analysis, Insights and Forecast, 2020-2032
- 10.1. Market Analysis, Insights and Forecast - by Location
- 10.1.1. Onshore
- 10.1.2. Offshore
- 10.2. Market Analysis, Insights and Forecast - by Equipment Type
- 10.2.1. Rotor/Blade
- 10.2.2. Tower
- 10.2.3. Generator
- 10.2.4. Other Equipment Types
- 10.1. Market Analysis, Insights and Forecast - by Location
- 11. Competitive Analysis
- 11.1. Global Market Share Analysis 2025
- 11.2. Company Profiles
- 11.2.1 Guodian United Power Technology Company Limited
- 11.2.1.1. Overview
- 11.2.1.2. Products
- 11.2.1.3. SWOT Analysis
- 11.2.1.4. Recent Developments
- 11.2.1.5. Financials (Based on Availability)
- 11.2.2 Xinjiang Goldwind Science & Technology Co Ltd *List Not Exhaustive
- 11.2.2.1. Overview
- 11.2.2.2. Products
- 11.2.2.3. SWOT Analysis
- 11.2.2.4. Recent Developments
- 11.2.2.5. Financials (Based on Availability)
- 11.2.3 Siemens Gamesa Renewable Energy
- 11.2.3.1. Overview
- 11.2.3.2. Products
- 11.2.3.3. SWOT Analysis
- 11.2.3.4. Recent Developments
- 11.2.3.5. Financials (Based on Availability)
- 11.2.4 Envision Energy
- 11.2.4.1. Overview
- 11.2.4.2. Products
- 11.2.4.3. SWOT Analysis
- 11.2.4.4. Recent Developments
- 11.2.4.5. Financials (Based on Availability)
- 11.2.5 Senvion SA
- 11.2.5.1. Overview
- 11.2.5.2. Products
- 11.2.5.3. SWOT Analysis
- 11.2.5.4. Recent Developments
- 11.2.5.5. Financials (Based on Availability)
- 11.2.6 Vestas Wind Systems AS
- 11.2.6.1. Overview
- 11.2.6.2. Products
- 11.2.6.3. SWOT Analysis
- 11.2.6.4. Recent Developments
- 11.2.6.5. Financials (Based on Availability)
- 11.2.7 General Electric Company
- 11.2.7.1. Overview
- 11.2.7.2. Products
- 11.2.7.3. SWOT Analysis
- 11.2.7.4. Recent Developments
- 11.2.7.5. Financials (Based on Availability)
- 11.2.8 Enercon GmbH
- 11.2.8.1. Overview
- 11.2.8.2. Products
- 11.2.8.3. SWOT Analysis
- 11.2.8.4. Recent Developments
- 11.2.8.5. Financials (Based on Availability)
- 11.2.9 Ming Yang Wind Power Group Limited
- 11.2.9.1. Overview
- 11.2.9.2. Products
- 11.2.9.3. SWOT Analysis
- 11.2.9.4. Recent Developments
- 11.2.9.5. Financials (Based on Availability)
- 11.2.10 Nordex SE
- 11.2.10.1. Overview
- 11.2.10.2. Products
- 11.2.10.3. SWOT Analysis
- 11.2.10.4. Recent Developments
- 11.2.10.5. Financials (Based on Availability)
- 11.2.1 Guodian United Power Technology Company Limited
List of Figures
- Figure 1: Global Wind Power Equipment Market Revenue Breakdown (undefined, %) by Region 2025 & 2033
- Figure 2: Global Wind Power Equipment Market Volume Breakdown (K Units, %) by Region 2025 & 2033
- Figure 3: North America Wind Power Equipment Market Revenue (undefined), by Location 2025 & 2033
- Figure 4: North America Wind Power Equipment Market Volume (K Units), by Location 2025 & 2033
- Figure 5: North America Wind Power Equipment Market Revenue Share (%), by Location 2025 & 2033
- Figure 6: North America Wind Power Equipment Market Volume Share (%), by Location 2025 & 2033
- Figure 7: North America Wind Power Equipment Market Revenue (undefined), by Equipment Type 2025 & 2033
- Figure 8: North America Wind Power Equipment Market Volume (K Units), by Equipment Type 2025 & 2033
- Figure 9: North America Wind Power Equipment Market Revenue Share (%), by Equipment Type 2025 & 2033
- Figure 10: North America Wind Power Equipment Market Volume Share (%), by Equipment Type 2025 & 2033
- Figure 11: North America Wind Power Equipment Market Revenue (undefined), by Country 2025 & 2033
- Figure 12: North America Wind Power Equipment Market Volume (K Units), by Country 2025 & 2033
- Figure 13: North America Wind Power Equipment Market Revenue Share (%), by Country 2025 & 2033
- Figure 14: North America Wind Power Equipment Market Volume Share (%), by Country 2025 & 2033
- Figure 15: Europe Wind Power Equipment Market Revenue (undefined), by Location 2025 & 2033
- Figure 16: Europe Wind Power Equipment Market Volume (K Units), by Location 2025 & 2033
- Figure 17: Europe Wind Power Equipment Market Revenue Share (%), by Location 2025 & 2033
- Figure 18: Europe Wind Power Equipment Market Volume Share (%), by Location 2025 & 2033
- Figure 19: Europe Wind Power Equipment Market Revenue (undefined), by Equipment Type 2025 & 2033
- Figure 20: Europe Wind Power Equipment Market Volume (K Units), by Equipment Type 2025 & 2033
- Figure 21: Europe Wind Power Equipment Market Revenue Share (%), by Equipment Type 2025 & 2033
- Figure 22: Europe Wind Power Equipment Market Volume Share (%), by Equipment Type 2025 & 2033
- Figure 23: Europe Wind Power Equipment Market Revenue (undefined), by Country 2025 & 2033
- Figure 24: Europe Wind Power Equipment Market Volume (K Units), by Country 2025 & 2033
- Figure 25: Europe Wind Power Equipment Market Revenue Share (%), by Country 2025 & 2033
- Figure 26: Europe Wind Power Equipment Market Volume Share (%), by Country 2025 & 2033
- Figure 27: Asia Pacific Wind Power Equipment Market Revenue (undefined), by Location 2025 & 2033
- Figure 28: Asia Pacific Wind Power Equipment Market Volume (K Units), by Location 2025 & 2033
- Figure 29: Asia Pacific Wind Power Equipment Market Revenue Share (%), by Location 2025 & 2033
- Figure 30: Asia Pacific Wind Power Equipment Market Volume Share (%), by Location 2025 & 2033
- Figure 31: Asia Pacific Wind Power Equipment Market Revenue (undefined), by Equipment Type 2025 & 2033
- Figure 32: Asia Pacific Wind Power Equipment Market Volume (K Units), by Equipment Type 2025 & 2033
- Figure 33: Asia Pacific Wind Power Equipment Market Revenue Share (%), by Equipment Type 2025 & 2033
- Figure 34: Asia Pacific Wind Power Equipment Market Volume Share (%), by Equipment Type 2025 & 2033
- Figure 35: Asia Pacific Wind Power Equipment Market Revenue (undefined), by Country 2025 & 2033
- Figure 36: Asia Pacific Wind Power Equipment Market Volume (K Units), by Country 2025 & 2033
- Figure 37: Asia Pacific Wind Power Equipment Market Revenue Share (%), by Country 2025 & 2033
- Figure 38: Asia Pacific Wind Power Equipment Market Volume Share (%), by Country 2025 & 2033
- Figure 39: Middle East and Africa Wind Power Equipment Market Revenue (undefined), by Location 2025 & 2033
- Figure 40: Middle East and Africa Wind Power Equipment Market Volume (K Units), by Location 2025 & 2033
- Figure 41: Middle East and Africa Wind Power Equipment Market Revenue Share (%), by Location 2025 & 2033
- Figure 42: Middle East and Africa Wind Power Equipment Market Volume Share (%), by Location 2025 & 2033
- Figure 43: Middle East and Africa Wind Power Equipment Market Revenue (undefined), by Equipment Type 2025 & 2033
- Figure 44: Middle East and Africa Wind Power Equipment Market Volume (K Units), by Equipment Type 2025 & 2033
- Figure 45: Middle East and Africa Wind Power Equipment Market Revenue Share (%), by Equipment Type 2025 & 2033
- Figure 46: Middle East and Africa Wind Power Equipment Market Volume Share (%), by Equipment Type 2025 & 2033
- Figure 47: Middle East and Africa Wind Power Equipment Market Revenue (undefined), by Country 2025 & 2033
- Figure 48: Middle East and Africa Wind Power Equipment Market Volume (K Units), by Country 2025 & 2033
- Figure 49: Middle East and Africa Wind Power Equipment Market Revenue Share (%), by Country 2025 & 2033
- Figure 50: Middle East and Africa Wind Power Equipment Market Volume Share (%), by Country 2025 & 2033
- Figure 51: South America Wind Power Equipment Market Revenue (undefined), by Location 2025 & 2033
- Figure 52: South America Wind Power Equipment Market Volume (K Units), by Location 2025 & 2033
- Figure 53: South America Wind Power Equipment Market Revenue Share (%), by Location 2025 & 2033
- Figure 54: South America Wind Power Equipment Market Volume Share (%), by Location 2025 & 2033
- Figure 55: South America Wind Power Equipment Market Revenue (undefined), by Equipment Type 2025 & 2033
- Figure 56: South America Wind Power Equipment Market Volume (K Units), by Equipment Type 2025 & 2033
- Figure 57: South America Wind Power Equipment Market Revenue Share (%), by Equipment Type 2025 & 2033
- Figure 58: South America Wind Power Equipment Market Volume Share (%), by Equipment Type 2025 & 2033
- Figure 59: South America Wind Power Equipment Market Revenue (undefined), by Country 2025 & 2033
- Figure 60: South America Wind Power Equipment Market Volume (K Units), by Country 2025 & 2033
- Figure 61: South America Wind Power Equipment Market Revenue Share (%), by Country 2025 & 2033
- Figure 62: South America Wind Power Equipment Market Volume Share (%), by Country 2025 & 2033
List of Tables
- Table 1: Global Wind Power Equipment Market Revenue undefined Forecast, by Location 2020 & 2033
- Table 2: Global Wind Power Equipment Market Volume K Units Forecast, by Location 2020 & 2033
- Table 3: Global Wind Power Equipment Market Revenue undefined Forecast, by Equipment Type 2020 & 2033
- Table 4: Global Wind Power Equipment Market Volume K Units Forecast, by Equipment Type 2020 & 2033
- Table 5: Global Wind Power Equipment Market Revenue undefined Forecast, by Region 2020 & 2033
- Table 6: Global Wind Power Equipment Market Volume K Units Forecast, by Region 2020 & 2033
- Table 7: Global Wind Power Equipment Market Revenue undefined Forecast, by Location 2020 & 2033
- Table 8: Global Wind Power Equipment Market Volume K Units Forecast, by Location 2020 & 2033
- Table 9: Global Wind Power Equipment Market Revenue undefined Forecast, by Equipment Type 2020 & 2033
- Table 10: Global Wind Power Equipment Market Volume K Units Forecast, by Equipment Type 2020 & 2033
- Table 11: Global Wind Power Equipment Market Revenue undefined Forecast, by Country 2020 & 2033
- Table 12: Global Wind Power Equipment Market Volume K Units Forecast, by Country 2020 & 2033
- Table 13: United States of America Wind Power Equipment Market Revenue (undefined) Forecast, by Application 2020 & 2033
- Table 14: United States of America Wind Power Equipment Market Volume (K Units) Forecast, by Application 2020 & 2033
- Table 15: Canada Wind Power Equipment Market Revenue (undefined) Forecast, by Application 2020 & 2033
- Table 16: Canada Wind Power Equipment Market Volume (K Units) Forecast, by Application 2020 & 2033
- Table 17: Rest of the North America Wind Power Equipment Market Revenue (undefined) Forecast, by Application 2020 & 2033
- Table 18: Rest of the North America Wind Power Equipment Market Volume (K Units) Forecast, by Application 2020 & 2033
- Table 19: Global Wind Power Equipment Market Revenue undefined Forecast, by Location 2020 & 2033
- Table 20: Global Wind Power Equipment Market Volume K Units Forecast, by Location 2020 & 2033
- Table 21: Global Wind Power Equipment Market Revenue undefined Forecast, by Equipment Type 2020 & 2033
- Table 22: Global Wind Power Equipment Market Volume K Units Forecast, by Equipment Type 2020 & 2033
- Table 23: Global Wind Power Equipment Market Revenue undefined Forecast, by Country 2020 & 2033
- Table 24: Global Wind Power Equipment Market Volume K Units Forecast, by Country 2020 & 2033
- Table 25: United Kingdom Wind Power Equipment Market Revenue (undefined) Forecast, by Application 2020 & 2033
- Table 26: United Kingdom Wind Power Equipment Market Volume (K Units) Forecast, by Application 2020 & 2033
- Table 27: France Wind Power Equipment Market Revenue (undefined) Forecast, by Application 2020 & 2033
- Table 28: France Wind Power Equipment Market Volume (K Units) Forecast, by Application 2020 & 2033
- Table 29: Norway Wind Power Equipment Market Revenue (undefined) Forecast, by Application 2020 & 2033
- Table 30: Norway Wind Power Equipment Market Volume (K Units) Forecast, by Application 2020 & 2033
- Table 31: Italy Wind Power Equipment Market Revenue (undefined) Forecast, by Application 2020 & 2033
- Table 32: Italy Wind Power Equipment Market Volume (K Units) Forecast, by Application 2020 & 2033
- Table 33: Germany Wind Power Equipment Market Revenue (undefined) Forecast, by Application 2020 & 2033
- Table 34: Germany Wind Power Equipment Market Volume (K Units) Forecast, by Application 2020 & 2033
- Table 35: Rest of the Europe Wind Power Equipment Market Revenue (undefined) Forecast, by Application 2020 & 2033
- Table 36: Rest of the Europe Wind Power Equipment Market Volume (K Units) Forecast, by Application 2020 & 2033
- Table 37: Global Wind Power Equipment Market Revenue undefined Forecast, by Location 2020 & 2033
- Table 38: Global Wind Power Equipment Market Volume K Units Forecast, by Location 2020 & 2033
- Table 39: Global Wind Power Equipment Market Revenue undefined Forecast, by Equipment Type 2020 & 2033
- Table 40: Global Wind Power Equipment Market Volume K Units Forecast, by Equipment Type 2020 & 2033
- Table 41: Global Wind Power Equipment Market Revenue undefined Forecast, by Country 2020 & 2033
- Table 42: Global Wind Power Equipment Market Volume K Units Forecast, by Country 2020 & 2033
- Table 43: China Wind Power Equipment Market Revenue (undefined) Forecast, by Application 2020 & 2033
- Table 44: China Wind Power Equipment Market Volume (K Units) Forecast, by Application 2020 & 2033
- Table 45: India Wind Power Equipment Market Revenue (undefined) Forecast, by Application 2020 & 2033
- Table 46: India Wind Power Equipment Market Volume (K Units) Forecast, by Application 2020 & 2033
- Table 47: Japan Wind Power Equipment Market Revenue (undefined) Forecast, by Application 2020 & 2033
- Table 48: Japan Wind Power Equipment Market Volume (K Units) Forecast, by Application 2020 & 2033
- Table 49: Rest of the Asia Pacific Wind Power Equipment Market Revenue (undefined) Forecast, by Application 2020 & 2033
- Table 50: Rest of the Asia Pacific Wind Power Equipment Market Volume (K Units) Forecast, by Application 2020 & 2033
- Table 51: Global Wind Power Equipment Market Revenue undefined Forecast, by Location 2020 & 2033
- Table 52: Global Wind Power Equipment Market Volume K Units Forecast, by Location 2020 & 2033
- Table 53: Global Wind Power Equipment Market Revenue undefined Forecast, by Equipment Type 2020 & 2033
- Table 54: Global Wind Power Equipment Market Volume K Units Forecast, by Equipment Type 2020 & 2033
- Table 55: Global Wind Power Equipment Market Revenue undefined Forecast, by Country 2020 & 2033
- Table 56: Global Wind Power Equipment Market Volume K Units Forecast, by Country 2020 & 2033
- Table 57: United Arab Emirates Wind Power Equipment Market Revenue (undefined) Forecast, by Application 2020 & 2033
- Table 58: United Arab Emirates Wind Power Equipment Market Volume (K Units) Forecast, by Application 2020 & 2033
- Table 59: Saudi Arabia Wind Power Equipment Market Revenue (undefined) Forecast, by Application 2020 & 2033
- Table 60: Saudi Arabia Wind Power Equipment Market Volume (K Units) Forecast, by Application 2020 & 2033
- Table 61: South Africa Wind Power Equipment Market Revenue (undefined) Forecast, by Application 2020 & 2033
- Table 62: South Africa Wind Power Equipment Market Volume (K Units) Forecast, by Application 2020 & 2033
- Table 63: Rest of the Middle East and Africa Wind Power Equipment Market Revenue (undefined) Forecast, by Application 2020 & 2033
- Table 64: Rest of the Middle East and Africa Wind Power Equipment Market Volume (K Units) Forecast, by Application 2020 & 2033
- Table 65: Global Wind Power Equipment Market Revenue undefined Forecast, by Location 2020 & 2033
- Table 66: Global Wind Power Equipment Market Volume K Units Forecast, by Location 2020 & 2033
- Table 67: Global Wind Power Equipment Market Revenue undefined Forecast, by Equipment Type 2020 & 2033
- Table 68: Global Wind Power Equipment Market Volume K Units Forecast, by Equipment Type 2020 & 2033
- Table 69: Global Wind Power Equipment Market Revenue undefined Forecast, by Country 2020 & 2033
- Table 70: Global Wind Power Equipment Market Volume K Units Forecast, by Country 2020 & 2033
- Table 71: Brazil Wind Power Equipment Market Revenue (undefined) Forecast, by Application 2020 & 2033
- Table 72: Brazil Wind Power Equipment Market Volume (K Units) Forecast, by Application 2020 & 2033
- Table 73: Argentina Wind Power Equipment Market Revenue (undefined) Forecast, by Application 2020 & 2033
- Table 74: Argentina Wind Power Equipment Market Volume (K Units) Forecast, by Application 2020 & 2033
- Table 75: Rest of the South America Wind Power Equipment Market Revenue (undefined) Forecast, by Application 2020 & 2033
- Table 76: Rest of the South America Wind Power Equipment Market Volume (K Units) Forecast, by Application 2020 & 2033
Frequently Asked Questions
1. What is the projected Compound Annual Growth Rate (CAGR) of the Wind Power Equipment Market?
The projected CAGR is approximately 6.5%.
2. Which companies are prominent players in the Wind Power Equipment Market?
Key companies in the market include Guodian United Power Technology Company Limited, Xinjiang Goldwind Science & Technology Co Ltd *List Not Exhaustive, Siemens Gamesa Renewable Energy, Envision Energy, Senvion SA, Vestas Wind Systems AS, General Electric Company, Enercon GmbH, Ming Yang Wind Power Group Limited, Nordex SE.
3. What are the main segments of the Wind Power Equipment Market?
The market segments include Location, Equipment Type.
4. Can you provide details about the market size?
The market size is estimated to be USD XXX N/A as of 2022.
5. What are some drivers contributing to market growth?
4.; The Declining Cost of Wind Energy4.; Increasing Investments in the Wind Power Sector.
6. What are the notable trends driving market growth?
Increasing Demand from Onshore Wind Power Industry.
7. Are there any restraints impacting market growth?
4.; Substitution From Solar Energy and Gas-Fired Power Plants.
8. Can you provide examples of recent developments in the market?
May 2023: Suzlon, a developer of renewable energy solutions, has received a 69 MW wind energy order from the Indian division of a renowned Nordic Energy Company. Suzlon will deploy 23 wind turbine generators (WTGs) with 3 MW rated capacity and a Hybrid Lattice Tubular (HLT) tower.
9. What pricing options are available for accessing the report?
Pricing options include single-user, multi-user, and enterprise licenses priced at USD 4750, USD 5250, and USD 8750 respectively.
10. Is the market size provided in terms of value or volume?
The market size is provided in terms of value, measured in N/A and volume, measured in K Units.
11. Are there any specific market keywords associated with the report?
Yes, the market keyword associated with the report is "Wind Power Equipment Market," which aids in identifying and referencing the specific market segment covered.
12. How do I determine which pricing option suits my needs best?
The pricing options vary based on user requirements and access needs. Individual users may opt for single-user licenses, while businesses requiring broader access may choose multi-user or enterprise licenses for cost-effective access to the report.
13. Are there any additional resources or data provided in the Wind Power Equipment Market report?
While the report offers comprehensive insights, it's advisable to review the specific contents or supplementary materials provided to ascertain if additional resources or data are available.
14. How can I stay updated on further developments or reports in the Wind Power Equipment Market?
To stay informed about further developments, trends, and reports in the Wind Power Equipment Market, consider subscribing to industry newsletters, following relevant companies and organizations, or regularly checking reputable industry news sources and publications.
Methodology
Step 1 - Identification of Relevant Samples Size from Population Database


Step 2 - Approaches for Defining Global Market Size (Value, Volume* & Price*)

Note*: In applicable scenarios
Step 3 - Data Sources
Primary Research
- Web Analytics
- Survey Reports
- Research Institute
- Latest Research Reports
- Opinion Leaders
Secondary Research
- Annual Reports
- White Paper
- Latest Press Release
- Industry Association
- Paid Database
- Investor Presentations

Step 4 - Data Triangulation
Involves using different sources of information in order to increase the validity of a study
These sources are likely to be stakeholders in a program - participants, other researchers, program staff, other community members, and so on.
Then we put all data in single framework & apply various statistical tools to find out the dynamic on the market.
During the analysis stage, feedback from the stakeholder groups would be compared to determine areas of agreement as well as areas of divergence


