

Key Insights
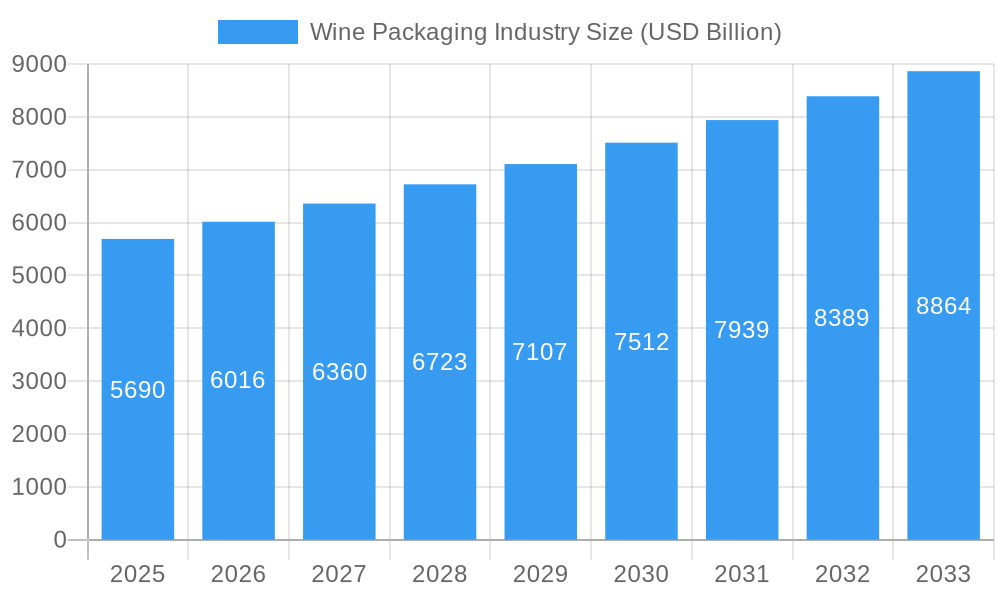
The global wine packaging market, valued at $5.69 billion in 2025, is projected to experience robust growth, exhibiting a compound annual growth rate (CAGR) of 5.48% from 2025 to 2033. This expansion is driven by several key factors. The increasing popularity of wine, particularly among younger demographics, fuels demand for innovative and attractive packaging solutions. Sustainability concerns are also significantly impacting the market, leading to a surge in demand for eco-friendly options like lightweight glass bottles, recycled materials, and bag-in-box packaging. Furthermore, the rise of e-commerce and direct-to-consumer wine sales necessitates packaging that ensures product integrity during shipping and enhances the unboxing experience. Premiumization trends within the wine industry, with consumers increasingly seeking higher-quality wines, also contribute to the market's growth, as premium wines often utilize more sophisticated and expensive packaging. Competition among wine producers is driving innovation in packaging design and functionality to enhance brand appeal and shelf presence.
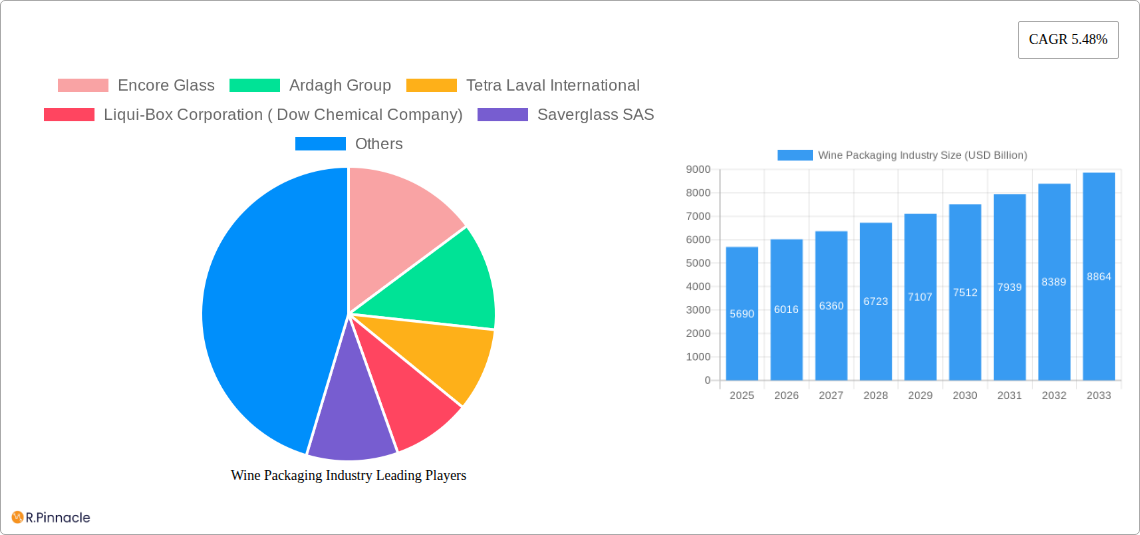
Wine Packaging Industry Market Size (In Billion)
However, the market faces some challenges. Fluctuations in raw material prices, particularly for glass and plastic, can impact production costs and profitability. Stringent environmental regulations related to waste management and packaging disposal pose constraints for producers. Maintaining consistent quality and reducing packaging-related environmental impact are ongoing concerns for businesses in this sector. The market segmentation highlights significant opportunities across different material types (glass, plastic, metal, paperboard) and product types (bottles, bag-in-box, other formats). Glass continues to dominate, favored for its perceived premium quality and ability to preserve wine, but plastic and bag-in-box options are gaining traction due to cost-effectiveness and sustainability features. Regional variations exist, with North America and Europe currently representing significant market shares, but Asia-Pacific is expected to witness substantial growth driven by rising wine consumption in emerging economies. The leading companies in this market are actively investing in research and development to meet evolving consumer demands and strengthen their market positions.
Wine Packaging Industry Company Market Share
Wine Packaging Industry Report: A Comprehensive Market Analysis (2019-2033)
This comprehensive report provides an in-depth analysis of the global wine packaging industry, offering valuable insights for industry professionals, investors, and strategic decision-makers. With a study period spanning 2019-2033, a base year of 2025, and a forecast period of 2025-2033, this report unveils the market's structure, dynamics, and future trajectory, backed by robust data and expert analysis. The market is projected to reach xx USD Billion by 2033, exhibiting a CAGR of xx% during the forecast period.
Wine Packaging Industry Market Structure & Innovation Trends
The wine packaging market is moderately concentrated, with key players such as Encore Glass, Ardagh Group, Tetra Laval International, Liqui-Box Corporation (Dow Chemical Company), Saverglass SAS, Scholle Corporation, TricorBraun Incorporate, Ball Corporation, G3 Enterprises, Maverick Enterprises, Guala Closures, Owens-Illinois Group, and International Paper holding significant market share. However, the presence of smaller, specialized players also contributes to the overall competitive landscape. Innovation is driven by consumer demand for sustainable and aesthetically pleasing packaging, coupled with regulatory pressures to reduce environmental impact.
- Market Concentration: The top 5 players collectively hold an estimated xx% market share in 2025.
- Innovation Drivers: Sustainability, lightweighting, enhanced barrier properties, and e-commerce suitability are key drivers.
- Regulatory Frameworks: Growing regulations on plastic use and emphasis on recycling are shaping packaging choices.
- Product Substitutes: The emergence of alternative packaging formats (e.g., pouches, kegs) presents a competitive challenge.
- M&A Activities: The industry has witnessed significant M&A activity in recent years, with deal values totaling an estimated xx USD Billion between 2019 and 2024. Consolidation is expected to continue, driven by economies of scale and expansion into new markets.
Wine Packaging Industry Market Dynamics & Trends
The wine packaging market is experiencing robust growth, fueled by several factors. The rising global consumption of wine, particularly in emerging markets, is a primary driver. Technological advancements, such as improved barrier materials and lightweighting techniques, are enhancing product shelf life and reducing environmental impact. Consumer preferences are shifting towards sustainable and convenient packaging solutions, further stimulating demand for eco-friendly alternatives. Competitive dynamics are characterized by both innovation and consolidation, with leading players focusing on expanding their product portfolios and geographical reach. The market is also witnessing increasing adoption of e-commerce, demanding packaging suitable for online distribution. The CAGR for the forecast period (2025-2033) is estimated at xx%, with a market penetration rate of xx% by 2033 for sustainable packaging options.
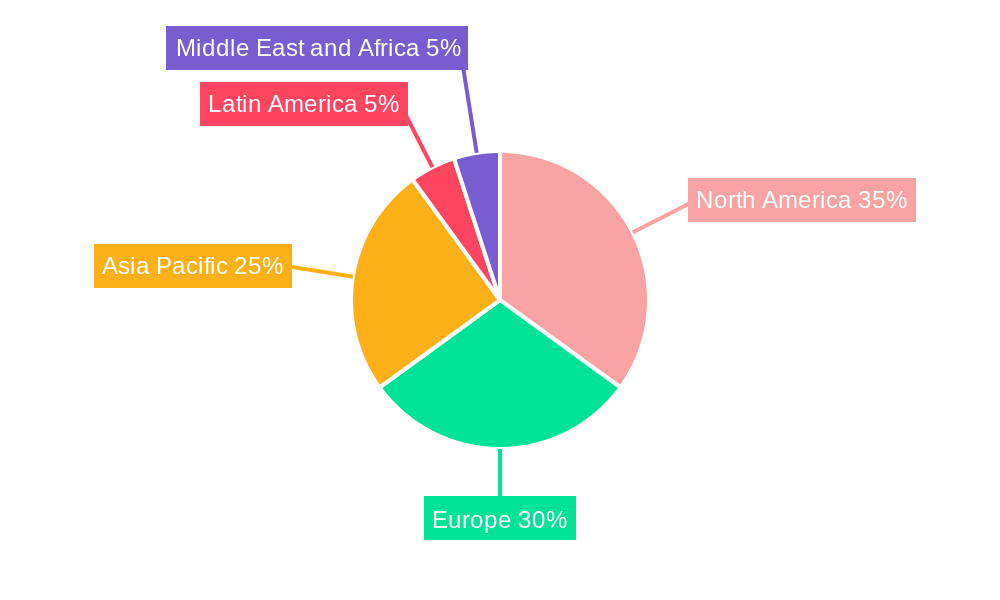
Dominant Regions & Segments in Wine Packaging Industry
The North American and European regions currently dominate the wine packaging market, driven by high wine consumption and established infrastructure. However, the Asia-Pacific region is witnessing rapid growth, fueled by increasing disposable incomes and changing consumer preferences.
Leading Segments:
- Material Type: Glass continues to be the dominant material, valued for its premium image and barrier properties. However, plastic and paperboard are gaining traction due to cost-effectiveness and sustainability concerns. Metal packaging holds a niche but significant share, particularly for high-end wines.
- Product Type: Glass bottles remain the most popular product type, accounting for the largest market share. However, bag-in-box and other innovative packaging formats are witnessing increasing adoption, particularly for bulk wine and e-commerce distribution.
Key Drivers (by Region):
- North America: Strong wine consumption, established distribution networks, and a focus on premiumization.
- Europe: High wine production, diverse consumer preferences, and stringent environmental regulations.
- Asia-Pacific: Rising disposable incomes, increasing wine consumption, and rapid urbanization.
Wine Packaging Industry Product Innovations
Recent product innovations focus on sustainability, lightweighting, and enhanced functionality. This includes the introduction of lightweight glass bottles, improved barrier films for plastic packaging, and innovative bag-in-box solutions with improved dispensing systems. These innovations aim to cater to consumer preferences for eco-friendly and convenient packaging while also enhancing the overall product experience. The market is seeing a trend toward personalized and customizable packaging solutions, reflecting the increasing demand for brand differentiation.
Report Scope & Segmentation Analysis
This report segments the wine packaging market by material type (Glass, Plastic, Metal, Paper Board) and product type (Glass Bottles, Plastic Bottles, Bag-in-Box, Other Product Types). Each segment is analyzed in terms of its market size, growth projections, and competitive dynamics. The report provides detailed insights into the market share of each segment and its future growth potential. For instance, the glass bottle segment is expected to exhibit a CAGR of xx% during the forecast period, driven by its premium image and functionality. Similarly, the bag-in-box segment shows significant growth potential, driven by its cost-effectiveness and sustainability advantages.
Key Drivers of Wine Packaging Industry Growth
Several factors drive the growth of the wine packaging industry. Increased wine consumption globally, particularly in emerging markets, is a key driver. The growing demand for sustainable packaging solutions, driven by environmental concerns and regulations, is significantly impacting market dynamics. Technological advancements in materials science and packaging design lead to the development of innovative and cost-effective packaging formats. Furthermore, the rise of e-commerce in the wine industry necessitates packaging solutions suitable for online distribution and delivery, spurring further growth.
Challenges in the Wine Packaging Industry Sector
The wine packaging industry faces several challenges. Fluctuations in raw material prices, particularly for glass and plastic, impact profitability and product pricing. Stringent environmental regulations and increasing sustainability concerns necessitate investment in eco-friendly materials and technologies. Intense competition among packaging suppliers requires continuous innovation and cost optimization. Supply chain disruptions and logistics challenges further complicate operations and increase costs.
Emerging Opportunities in Wine Packaging Industry
Emerging opportunities lie in the development of sustainable and eco-friendly packaging solutions. The increasing demand for lightweight and tamper-evident packaging presents opportunities for innovation. Expansion into emerging markets with high growth potential offers significant opportunities for market penetration. The growing adoption of digital printing technologies allows for personalized and customizable packaging, enhancing brand differentiation and consumer appeal.
Leading Players in the Wine Packaging Industry Market
- Encore Glass
- Ardagh Group
- Tetra Laval International
- Liqui-Box Corporation (Dow Chemical Company)
- Saverglass SAS
- Scholle Corporation
- TricorBraun Incorporate
- Ball Corporation
- G3 Enterprises
- Maverick Enterprises
- Guala Closures
- Owens-Illinois Group
- International Paper
Key Developments in Wine Packaging Industry
- December 2022: Orora Glass wins the Wine Industry Impacts Awards (WIIA) Packaging & Design category for its lightweight sparkling wine bottle, highlighting the growing importance of sustainable packaging.
- November 2022: Smurfit Kappa launches a sustainable packaging solution for e-commerce wine sales, reflecting the increasing importance of this distribution channel.
Future Outlook for Wine Packaging Industry Market
The future of the wine packaging industry is bright. Continued growth in wine consumption, coupled with technological advancements and increasing consumer awareness of sustainability, will drive market expansion. Innovation in materials, design, and functionality will shape the industry's future trajectory. Strategic partnerships and collaborations among packaging suppliers and wine producers will play a crucial role in shaping market dynamics. The focus on sustainability and eco-friendly solutions is expected to significantly influence future market growth.
Wine Packaging Industry Segmentation
-
1. Material Type
- 1.1. Glass
- 1.2. Plastic
- 1.3. Metal
- 1.4. Paper Board
-
2. Product Type
- 2.1. Glass Bottles
- 2.2. Plastic Bottles
- 2.3. Bag in Box
- 2.4. Other Product Types
Wine Packaging Industry Segmentation By Geography
-
1. North America
- 1.1. United States
- 1.2. Canada
-
2. Europe
- 2.1. United Kingdom
- 2.2. Germany
- 2.3. Italy
- 2.4. France
- 2.5. Spain
- 2.6. Rest of Europe
-
3. Asia Pacific
- 3.1. China
- 3.2. Japan
- 3.3. Australia and New Zealand
- 3.4. Rest of Asia Pacific
- 4. Latin America
- 5. Middle East and Africa
Wine Packaging Industry Regional Market Share
Geographic Coverage of Wine Packaging Industry
Wine Packaging Industry REPORT HIGHLIGHTS
| Aspects | Details |
|---|---|
| Study Period | 2020-2034 |
| Base Year | 2025 |
| Estimated Year | 2026 |
| Forecast Period | 2026-2034 |
| Historical Period | 2020-2025 |
| Growth Rate | CAGR of 5.48% from 2020-2034 |
| Segmentation |
|
Table of Contents
- 1. Introduction
- 1.1. Research Scope
- 1.2. Market Segmentation
- 1.3. Research Objective
- 1.4. Definitions and Assumptions
- 2. Executive Summary
- 2.1. Market Snapshot
- 3. Market Dynamics
- 3.1. Market Drivers
- 3.2. Market Restrains
- 3.3. Market Trends
- 3.4. Market Opportunities
- 4. Market Factor Analysis
- 4.1. Porters Five Forces
- 4.1.1. Bargaining Power of Suppliers
- 4.1.2. Bargaining Power of Buyers
- 4.1.3. Threat of New Entrants
- 4.1.4. Threat of Substitutes
- 4.1.5. Competitive Rivalry
- 4.2. PESTEL analysis
- 4.3. BCG Analysis
- 4.3.1. Stars (High Growth, High Market Share)
- 4.3.2. Cash Cows (Low Growth, High Market Share)
- 4.3.3. Question Mark (High Growth, Low Market Share)
- 4.3.4. Dogs (Low Growth, Low Market Share)
- 4.4. Ansoff Matrix Analysis
- 4.5. Supply Chain Analysis
- 4.6. Regulatory Landscape
- 4.7. Current Market Potential and Opportunity Assessment (TAM–SAM–SOM Framework)
- 4.8. PRI Analyst Note
- 4.1. Porters Five Forces
- 5. Market Analysis, Insights and Forecast 2021-2033
- 5.1. Market Analysis, Insights and Forecast - by Material Type
- 5.1.1. Glass
- 5.1.2. Plastic
- 5.1.3. Metal
- 5.1.4. Paper Board
- 5.2. Market Analysis, Insights and Forecast - by Product Type
- 5.2.1. Glass Bottles
- 5.2.2. Plastic Bottles
- 5.2.3. Bag in Box
- 5.2.4. Other Product Types
- 5.3. Market Analysis, Insights and Forecast - by Region
- 5.3.1. North America
- 5.3.2. Europe
- 5.3.3. Asia Pacific
- 5.3.4. Latin America
- 5.3.5. Middle East and Africa
- 5.1. Market Analysis, Insights and Forecast - by Material Type
- 6. Global Wine Packaging Industry Analysis, Insights and Forecast, 2021-2033
- 6.1. Market Analysis, Insights and Forecast - by Material Type
- 6.1.1. Glass
- 6.1.2. Plastic
- 6.1.3. Metal
- 6.1.4. Paper Board
- 6.2. Market Analysis, Insights and Forecast - by Product Type
- 6.2.1. Glass Bottles
- 6.2.2. Plastic Bottles
- 6.2.3. Bag in Box
- 6.2.4. Other Product Types
- 6.1. Market Analysis, Insights and Forecast - by Material Type
- 7. North America Wine Packaging Industry Analysis, Insights and Forecast, 2020-2032
- 7.1. Market Analysis, Insights and Forecast - by Material Type
- 7.1.1. Glass
- 7.1.2. Plastic
- 7.1.3. Metal
- 7.1.4. Paper Board
- 7.2. Market Analysis, Insights and Forecast - by Product Type
- 7.2.1. Glass Bottles
- 7.2.2. Plastic Bottles
- 7.2.3. Bag in Box
- 7.2.4. Other Product Types
- 7.1. Market Analysis, Insights and Forecast - by Material Type
- 8. Europe Wine Packaging Industry Analysis, Insights and Forecast, 2020-2032
- 8.1. Market Analysis, Insights and Forecast - by Material Type
- 8.1.1. Glass
- 8.1.2. Plastic
- 8.1.3. Metal
- 8.1.4. Paper Board
- 8.2. Market Analysis, Insights and Forecast - by Product Type
- 8.2.1. Glass Bottles
- 8.2.2. Plastic Bottles
- 8.2.3. Bag in Box
- 8.2.4. Other Product Types
- 8.1. Market Analysis, Insights and Forecast - by Material Type
- 9. Asia Pacific Wine Packaging Industry Analysis, Insights and Forecast, 2020-2032
- 9.1. Market Analysis, Insights and Forecast - by Material Type
- 9.1.1. Glass
- 9.1.2. Plastic
- 9.1.3. Metal
- 9.1.4. Paper Board
- 9.2. Market Analysis, Insights and Forecast - by Product Type
- 9.2.1. Glass Bottles
- 9.2.2. Plastic Bottles
- 9.2.3. Bag in Box
- 9.2.4. Other Product Types
- 9.1. Market Analysis, Insights and Forecast - by Material Type
- 10. Latin America Wine Packaging Industry Analysis, Insights and Forecast, 2020-2032
- 10.1. Market Analysis, Insights and Forecast - by Material Type
- 10.1.1. Glass
- 10.1.2. Plastic
- 10.1.3. Metal
- 10.1.4. Paper Board
- 10.2. Market Analysis, Insights and Forecast - by Product Type
- 10.2.1. Glass Bottles
- 10.2.2. Plastic Bottles
- 10.2.3. Bag in Box
- 10.2.4. Other Product Types
- 10.1. Market Analysis, Insights and Forecast - by Material Type
- 11. Middle East and Africa Wine Packaging Industry Analysis, Insights and Forecast, 2020-2032
- 11.1. Market Analysis, Insights and Forecast - by Material Type
- 11.1.1. Glass
- 11.1.2. Plastic
- 11.1.3. Metal
- 11.1.4. Paper Board
- 11.2. Market Analysis, Insights and Forecast - by Product Type
- 11.2.1. Glass Bottles
- 11.2.2. Plastic Bottles
- 11.2.3. Bag in Box
- 11.2.4. Other Product Types
- 11.1. Market Analysis, Insights and Forecast - by Material Type
- 12. Competitive Analysis
- 12.1. Company Profiles
- 12.1.1 Encore Glass
- 12.1.1.1. Company Overview
- 12.1.1.2. Products
- 12.1.1.3. Company Financials
- 12.1.1.4. SWOT Analysis
- 12.1.2 Ardagh Group
- 12.1.2.1. Company Overview
- 12.1.2.2. Products
- 12.1.2.3. Company Financials
- 12.1.2.4. SWOT Analysis
- 12.1.3 Tetra Laval International
- 12.1.3.1. Company Overview
- 12.1.3.2. Products
- 12.1.3.3. Company Financials
- 12.1.3.4. SWOT Analysis
- 12.1.4 Liqui-Box Corporation ( Dow Chemical Company)
- 12.1.4.1. Company Overview
- 12.1.4.2. Products
- 12.1.4.3. Company Financials
- 12.1.4.4. SWOT Analysis
- 12.1.5 Saverglass SAS
- 12.1.5.1. Company Overview
- 12.1.5.2. Products
- 12.1.5.3. Company Financials
- 12.1.5.4. SWOT Analysis
- 12.1.6 Scholle Corporation
- 12.1.6.1. Company Overview
- 12.1.6.2. Products
- 12.1.6.3. Company Financials
- 12.1.6.4. SWOT Analysis
- 12.1.7 TricorBraun Incorporate
- 12.1.7.1. Company Overview
- 12.1.7.2. Products
- 12.1.7.3. Company Financials
- 12.1.7.4. SWOT Analysis
- 12.1.8 Ball Corporation
- 12.1.8.1. Company Overview
- 12.1.8.2. Products
- 12.1.8.3. Company Financials
- 12.1.8.4. SWOT Analysis
- 12.1.9 G3 Enterprises
- 12.1.9.1. Company Overview
- 12.1.9.2. Products
- 12.1.9.3. Company Financials
- 12.1.9.4. SWOT Analysis
- 12.1.10 Maverick Enterprises
- 12.1.10.1. Company Overview
- 12.1.10.2. Products
- 12.1.10.3. Company Financials
- 12.1.10.4. SWOT Analysis
- 12.1.11 Guala Closures
- 12.1.11.1. Company Overview
- 12.1.11.2. Products
- 12.1.11.3. Company Financials
- 12.1.11.4. SWOT Analysis
- 12.1.12 Owens-Illinois Group
- 12.1.12.1. Company Overview
- 12.1.12.2. Products
- 12.1.12.3. Company Financials
- 12.1.12.4. SWOT Analysis
- 12.1.13 International Paper
- 12.1.13.1. Company Overview
- 12.1.13.2. Products
- 12.1.13.3. Company Financials
- 12.1.13.4. SWOT Analysis
- 12.1.1 Encore Glass
- 12.2. Market Entropy
- 12.2.1 Company's Key Areas Served
- 12.2.2 Recent Developments
- 12.3. Company Market Share Analysis 2025
- 12.3.1 Top 5 Companies Market Share Analysis
- 12.3.2 Top 3 Companies Market Share Analysis
- 12.4. List of Potential Customers
- 13. Research Methodology
List of Figures
- Figure 1: Global Wine Packaging Industry Revenue Breakdown (USD Billion, %) by Region 2025 & 2033
- Figure 2: Global Wine Packaging Industry Volume Breakdown (K Tons, %) by Region 2025 & 2033
- Figure 3: North America Wine Packaging Industry Revenue (USD Billion), by Material Type 2025 & 2033
- Figure 4: North America Wine Packaging Industry Volume (K Tons), by Material Type 2025 & 2033
- Figure 5: North America Wine Packaging Industry Revenue Share (%), by Material Type 2025 & 2033
- Figure 6: North America Wine Packaging Industry Volume Share (%), by Material Type 2025 & 2033
- Figure 7: North America Wine Packaging Industry Revenue (USD Billion), by Product Type 2025 & 2033
- Figure 8: North America Wine Packaging Industry Volume (K Tons), by Product Type 2025 & 2033
- Figure 9: North America Wine Packaging Industry Revenue Share (%), by Product Type 2025 & 2033
- Figure 10: North America Wine Packaging Industry Volume Share (%), by Product Type 2025 & 2033
- Figure 11: North America Wine Packaging Industry Revenue (USD Billion), by Country 2025 & 2033
- Figure 12: North America Wine Packaging Industry Volume (K Tons), by Country 2025 & 2033
- Figure 13: North America Wine Packaging Industry Revenue Share (%), by Country 2025 & 2033
- Figure 14: North America Wine Packaging Industry Volume Share (%), by Country 2025 & 2033
- Figure 15: Europe Wine Packaging Industry Revenue (USD Billion), by Material Type 2025 & 2033
- Figure 16: Europe Wine Packaging Industry Volume (K Tons), by Material Type 2025 & 2033
- Figure 17: Europe Wine Packaging Industry Revenue Share (%), by Material Type 2025 & 2033
- Figure 18: Europe Wine Packaging Industry Volume Share (%), by Material Type 2025 & 2033
- Figure 19: Europe Wine Packaging Industry Revenue (USD Billion), by Product Type 2025 & 2033
- Figure 20: Europe Wine Packaging Industry Volume (K Tons), by Product Type 2025 & 2033
- Figure 21: Europe Wine Packaging Industry Revenue Share (%), by Product Type 2025 & 2033
- Figure 22: Europe Wine Packaging Industry Volume Share (%), by Product Type 2025 & 2033
- Figure 23: Europe Wine Packaging Industry Revenue (USD Billion), by Country 2025 & 2033
- Figure 24: Europe Wine Packaging Industry Volume (K Tons), by Country 2025 & 2033
- Figure 25: Europe Wine Packaging Industry Revenue Share (%), by Country 2025 & 2033
- Figure 26: Europe Wine Packaging Industry Volume Share (%), by Country 2025 & 2033
- Figure 27: Asia Pacific Wine Packaging Industry Revenue (USD Billion), by Material Type 2025 & 2033
- Figure 28: Asia Pacific Wine Packaging Industry Volume (K Tons), by Material Type 2025 & 2033
- Figure 29: Asia Pacific Wine Packaging Industry Revenue Share (%), by Material Type 2025 & 2033
- Figure 30: Asia Pacific Wine Packaging Industry Volume Share (%), by Material Type 2025 & 2033
- Figure 31: Asia Pacific Wine Packaging Industry Revenue (USD Billion), by Product Type 2025 & 2033
- Figure 32: Asia Pacific Wine Packaging Industry Volume (K Tons), by Product Type 2025 & 2033
- Figure 33: Asia Pacific Wine Packaging Industry Revenue Share (%), by Product Type 2025 & 2033
- Figure 34: Asia Pacific Wine Packaging Industry Volume Share (%), by Product Type 2025 & 2033
- Figure 35: Asia Pacific Wine Packaging Industry Revenue (USD Billion), by Country 2025 & 2033
- Figure 36: Asia Pacific Wine Packaging Industry Volume (K Tons), by Country 2025 & 2033
- Figure 37: Asia Pacific Wine Packaging Industry Revenue Share (%), by Country 2025 & 2033
- Figure 38: Asia Pacific Wine Packaging Industry Volume Share (%), by Country 2025 & 2033
- Figure 39: Latin America Wine Packaging Industry Revenue (USD Billion), by Material Type 2025 & 2033
- Figure 40: Latin America Wine Packaging Industry Volume (K Tons), by Material Type 2025 & 2033
- Figure 41: Latin America Wine Packaging Industry Revenue Share (%), by Material Type 2025 & 2033
- Figure 42: Latin America Wine Packaging Industry Volume Share (%), by Material Type 2025 & 2033
- Figure 43: Latin America Wine Packaging Industry Revenue (USD Billion), by Product Type 2025 & 2033
- Figure 44: Latin America Wine Packaging Industry Volume (K Tons), by Product Type 2025 & 2033
- Figure 45: Latin America Wine Packaging Industry Revenue Share (%), by Product Type 2025 & 2033
- Figure 46: Latin America Wine Packaging Industry Volume Share (%), by Product Type 2025 & 2033
- Figure 47: Latin America Wine Packaging Industry Revenue (USD Billion), by Country 2025 & 2033
- Figure 48: Latin America Wine Packaging Industry Volume (K Tons), by Country 2025 & 2033
- Figure 49: Latin America Wine Packaging Industry Revenue Share (%), by Country 2025 & 2033
- Figure 50: Latin America Wine Packaging Industry Volume Share (%), by Country 2025 & 2033
- Figure 51: Middle East and Africa Wine Packaging Industry Revenue (USD Billion), by Material Type 2025 & 2033
- Figure 52: Middle East and Africa Wine Packaging Industry Volume (K Tons), by Material Type 2025 & 2033
- Figure 53: Middle East and Africa Wine Packaging Industry Revenue Share (%), by Material Type 2025 & 2033
- Figure 54: Middle East and Africa Wine Packaging Industry Volume Share (%), by Material Type 2025 & 2033
- Figure 55: Middle East and Africa Wine Packaging Industry Revenue (USD Billion), by Product Type 2025 & 2033
- Figure 56: Middle East and Africa Wine Packaging Industry Volume (K Tons), by Product Type 2025 & 2033
- Figure 57: Middle East and Africa Wine Packaging Industry Revenue Share (%), by Product Type 2025 & 2033
- Figure 58: Middle East and Africa Wine Packaging Industry Volume Share (%), by Product Type 2025 & 2033
- Figure 59: Middle East and Africa Wine Packaging Industry Revenue (USD Billion), by Country 2025 & 2033
- Figure 60: Middle East and Africa Wine Packaging Industry Volume (K Tons), by Country 2025 & 2033
- Figure 61: Middle East and Africa Wine Packaging Industry Revenue Share (%), by Country 2025 & 2033
- Figure 62: Middle East and Africa Wine Packaging Industry Volume Share (%), by Country 2025 & 2033
List of Tables
- Table 1: Global Wine Packaging Industry Revenue USD Billion Forecast, by Material Type 2020 & 2033
- Table 2: Global Wine Packaging Industry Volume K Tons Forecast, by Material Type 2020 & 2033
- Table 3: Global Wine Packaging Industry Revenue USD Billion Forecast, by Product Type 2020 & 2033
- Table 4: Global Wine Packaging Industry Volume K Tons Forecast, by Product Type 2020 & 2033
- Table 5: Global Wine Packaging Industry Revenue USD Billion Forecast, by Region 2020 & 2033
- Table 6: Global Wine Packaging Industry Volume K Tons Forecast, by Region 2020 & 2033
- Table 7: Global Wine Packaging Industry Revenue USD Billion Forecast, by Material Type 2020 & 2033
- Table 8: Global Wine Packaging Industry Volume K Tons Forecast, by Material Type 2020 & 2033
- Table 9: Global Wine Packaging Industry Revenue USD Billion Forecast, by Product Type 2020 & 2033
- Table 10: Global Wine Packaging Industry Volume K Tons Forecast, by Product Type 2020 & 2033
- Table 11: Global Wine Packaging Industry Revenue USD Billion Forecast, by Country 2020 & 2033
- Table 12: Global Wine Packaging Industry Volume K Tons Forecast, by Country 2020 & 2033
- Table 13: United States Wine Packaging Industry Revenue (USD Billion) Forecast, by Application 2020 & 2033
- Table 14: United States Wine Packaging Industry Volume (K Tons) Forecast, by Application 2020 & 2033
- Table 15: Canada Wine Packaging Industry Revenue (USD Billion) Forecast, by Application 2020 & 2033
- Table 16: Canada Wine Packaging Industry Volume (K Tons) Forecast, by Application 2020 & 2033
- Table 17: Global Wine Packaging Industry Revenue USD Billion Forecast, by Material Type 2020 & 2033
- Table 18: Global Wine Packaging Industry Volume K Tons Forecast, by Material Type 2020 & 2033
- Table 19: Global Wine Packaging Industry Revenue USD Billion Forecast, by Product Type 2020 & 2033
- Table 20: Global Wine Packaging Industry Volume K Tons Forecast, by Product Type 2020 & 2033
- Table 21: Global Wine Packaging Industry Revenue USD Billion Forecast, by Country 2020 & 2033
- Table 22: Global Wine Packaging Industry Volume K Tons Forecast, by Country 2020 & 2033
- Table 23: United Kingdom Wine Packaging Industry Revenue (USD Billion) Forecast, by Application 2020 & 2033
- Table 24: United Kingdom Wine Packaging Industry Volume (K Tons) Forecast, by Application 2020 & 2033
- Table 25: Germany Wine Packaging Industry Revenue (USD Billion) Forecast, by Application 2020 & 2033
- Table 26: Germany Wine Packaging Industry Volume (K Tons) Forecast, by Application 2020 & 2033
- Table 27: Italy Wine Packaging Industry Revenue (USD Billion) Forecast, by Application 2020 & 2033
- Table 28: Italy Wine Packaging Industry Volume (K Tons) Forecast, by Application 2020 & 2033
- Table 29: France Wine Packaging Industry Revenue (USD Billion) Forecast, by Application 2020 & 2033
- Table 30: France Wine Packaging Industry Volume (K Tons) Forecast, by Application 2020 & 2033
- Table 31: Spain Wine Packaging Industry Revenue (USD Billion) Forecast, by Application 2020 & 2033
- Table 32: Spain Wine Packaging Industry Volume (K Tons) Forecast, by Application 2020 & 2033
- Table 33: Rest of Europe Wine Packaging Industry Revenue (USD Billion) Forecast, by Application 2020 & 2033
- Table 34: Rest of Europe Wine Packaging Industry Volume (K Tons) Forecast, by Application 2020 & 2033
- Table 35: Global Wine Packaging Industry Revenue USD Billion Forecast, by Material Type 2020 & 2033
- Table 36: Global Wine Packaging Industry Volume K Tons Forecast, by Material Type 2020 & 2033
- Table 37: Global Wine Packaging Industry Revenue USD Billion Forecast, by Product Type 2020 & 2033
- Table 38: Global Wine Packaging Industry Volume K Tons Forecast, by Product Type 2020 & 2033
- Table 39: Global Wine Packaging Industry Revenue USD Billion Forecast, by Country 2020 & 2033
- Table 40: Global Wine Packaging Industry Volume K Tons Forecast, by Country 2020 & 2033
- Table 41: China Wine Packaging Industry Revenue (USD Billion) Forecast, by Application 2020 & 2033
- Table 42: China Wine Packaging Industry Volume (K Tons) Forecast, by Application 2020 & 2033
- Table 43: Japan Wine Packaging Industry Revenue (USD Billion) Forecast, by Application 2020 & 2033
- Table 44: Japan Wine Packaging Industry Volume (K Tons) Forecast, by Application 2020 & 2033
- Table 45: Australia and New Zealand Wine Packaging Industry Revenue (USD Billion) Forecast, by Application 2020 & 2033
- Table 46: Australia and New Zealand Wine Packaging Industry Volume (K Tons) Forecast, by Application 2020 & 2033
- Table 47: Rest of Asia Pacific Wine Packaging Industry Revenue (USD Billion) Forecast, by Application 2020 & 2033
- Table 48: Rest of Asia Pacific Wine Packaging Industry Volume (K Tons) Forecast, by Application 2020 & 2033
- Table 49: Global Wine Packaging Industry Revenue USD Billion Forecast, by Material Type 2020 & 2033
- Table 50: Global Wine Packaging Industry Volume K Tons Forecast, by Material Type 2020 & 2033
- Table 51: Global Wine Packaging Industry Revenue USD Billion Forecast, by Product Type 2020 & 2033
- Table 52: Global Wine Packaging Industry Volume K Tons Forecast, by Product Type 2020 & 2033
- Table 53: Global Wine Packaging Industry Revenue USD Billion Forecast, by Country 2020 & 2033
- Table 54: Global Wine Packaging Industry Volume K Tons Forecast, by Country 2020 & 2033
- Table 55: Global Wine Packaging Industry Revenue USD Billion Forecast, by Material Type 2020 & 2033
- Table 56: Global Wine Packaging Industry Volume K Tons Forecast, by Material Type 2020 & 2033
- Table 57: Global Wine Packaging Industry Revenue USD Billion Forecast, by Product Type 2020 & 2033
- Table 58: Global Wine Packaging Industry Volume K Tons Forecast, by Product Type 2020 & 2033
- Table 59: Global Wine Packaging Industry Revenue USD Billion Forecast, by Country 2020 & 2033
- Table 60: Global Wine Packaging Industry Volume K Tons Forecast, by Country 2020 & 2033
Frequently Asked Questions
1. What is the projected Compound Annual Growth Rate (CAGR) of the Wine Packaging Industry?
The projected CAGR is approximately 5.48%.
2. Which companies are prominent players in the Wine Packaging Industry?
Key companies in the market include Encore Glass, Ardagh Group, Tetra Laval International, Liqui-Box Corporation ( Dow Chemical Company), Saverglass SAS, Scholle Corporation, TricorBraun Incorporate, Ball Corporation, G3 Enterprises, Maverick Enterprises, Guala Closures, Owens-Illinois Group, International Paper.
3. What are the main segments of the Wine Packaging Industry?
The market segments include Material Type, Product Type.
4. Can you provide details about the market size?
The market size is estimated to be USD 5.69 USD Billion as of 2022.
5. What are some drivers contributing to market growth?
Innovative Packaging and Attractive Marketing.
6. What are the notable trends driving market growth?
Growing Consumption of Premium Wines.
7. Are there any restraints impacting market growth?
Stringent Government Regulations over Single-Use Plastic-based Packaging.
8. Can you provide examples of recent developments in the market?
December 2022: In the Wine Industry Impacts Awards (WIIA) announced in December 2022, presented by the Wine Industry Suppliers Association (WISA), Orora Glass took out the top prize in the Packaging & Design category for its lightweight sparkling wine bottle. It was described as a fantastic and sustainable packaging alternative for sparkling beverages, 100 grams lighter than the brand's standard sparkling bottle yet having the same diameter, height, and GV rating.
9. What pricing options are available for accessing the report?
Pricing options include single-user, multi-user, and enterprise licenses priced at USD 4750, USD 5250, and USD 8750 respectively.
10. Is the market size provided in terms of value or volume?
The market size is provided in terms of value, measured in USD Billion and volume, measured in K Tons.
11. Are there any specific market keywords associated with the report?
Yes, the market keyword associated with the report is "Wine Packaging Industry," which aids in identifying and referencing the specific market segment covered.
12. How do I determine which pricing option suits my needs best?
The pricing options vary based on user requirements and access needs. Individual users may opt for single-user licenses, while businesses requiring broader access may choose multi-user or enterprise licenses for cost-effective access to the report.
13. Are there any additional resources or data provided in the Wine Packaging Industry report?
While the report offers comprehensive insights, it's advisable to review the specific contents or supplementary materials provided to ascertain if additional resources or data are available.
14. How can I stay updated on further developments or reports in the Wine Packaging Industry?
To stay informed about further developments, trends, and reports in the Wine Packaging Industry, consider subscribing to industry newsletters, following relevant companies and organizations, or regularly checking reputable industry news sources and publications.
Methodology
Step 1 - Identification of Relevant Samples Size from Population Database


Step 2 - Approaches for Defining Global Market Size (Value, Volume* & Price*)

Note*: In applicable scenarios
Step 3 - Data Sources
Primary Research
- Web Analytics
- Survey Reports
- Research Institute
- Latest Research Reports
- Opinion Leaders
Secondary Research
- Annual Reports
- White Paper
- Latest Press Release
- Industry Association
- Paid Database
- Investor Presentations

Step 4 - Data Triangulation
Involves using different sources of information in order to increase the validity of a study
These sources are likely to be stakeholders in a program - participants, other researchers, program staff, other community members, and so on.
Then we put all data in single framework & apply various statistical tools to find out the dynamic on the market.
During the analysis stage, feedback from the stakeholder groups would be compared to determine areas of agreement as well as areas of divergence