
Key Insights
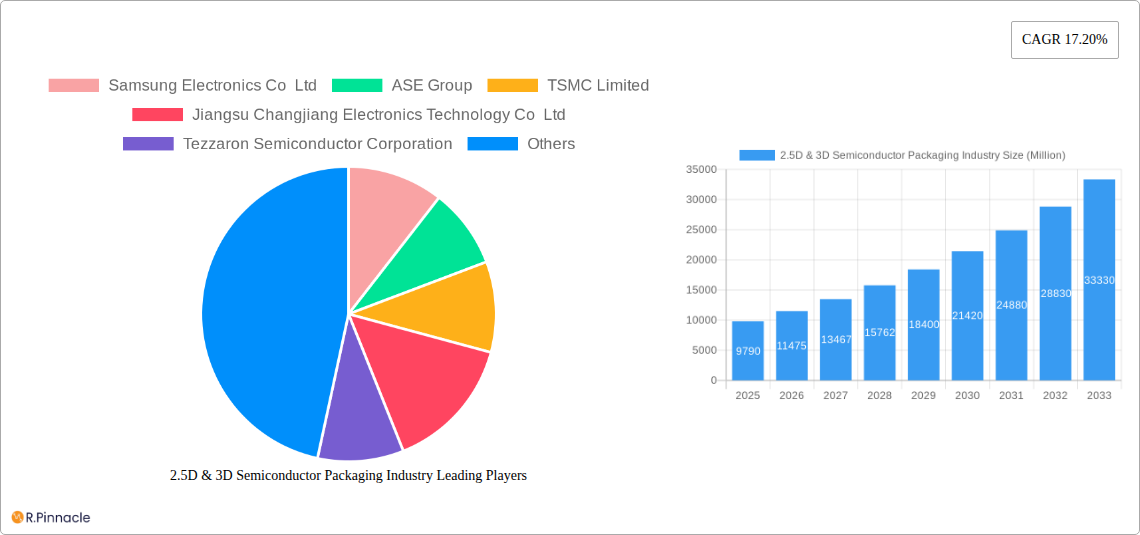
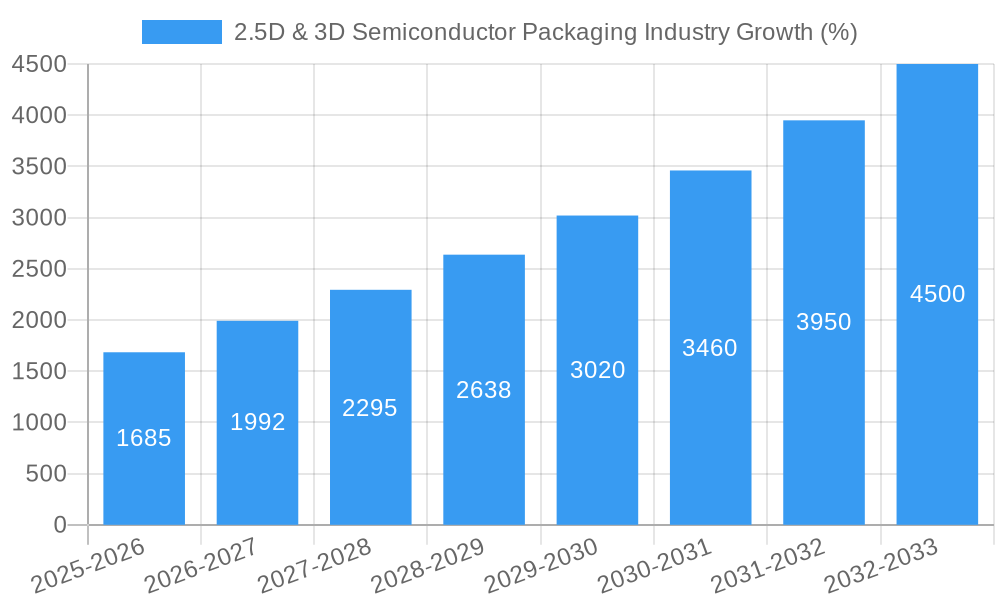
The 2.5D & 3D semiconductor packaging market is experiencing robust growth, projected to reach a market size of $9.79 billion in 2025 and exhibiting a Compound Annual Growth Rate (CAGR) of 17.20% from 2025 to 2033. This significant expansion is driven by the increasing demand for higher performance and miniaturization in various end-user industries. The proliferation of advanced mobile devices, the growth of the automotive electronics sector (with its increasing reliance on advanced driver-assistance systems and autonomous driving technologies), and the expanding medical device market (requiring smaller, more powerful, and reliable devices for implantable technologies and advanced diagnostic tools) are key factors fueling this growth. Furthermore, the continuous advancements in packaging technologies, such as 3D and 3D wafer-level chip-scale packaging (WLCSP), are enabling higher integration density, improved thermal management, and enhanced electrical performance, further boosting market adoption. Leading players like Samsung Electronics, TSMC, and ASE Technology are investing heavily in R&D and expanding their manufacturing capacities to meet the burgeoning demand. While supply chain challenges and potential material cost fluctuations pose some restraints, the long-term outlook for the 2.5D & 3D semiconductor packaging market remains highly positive, driven by the unrelenting need for smaller, faster, and more energy-efficient electronic devices.
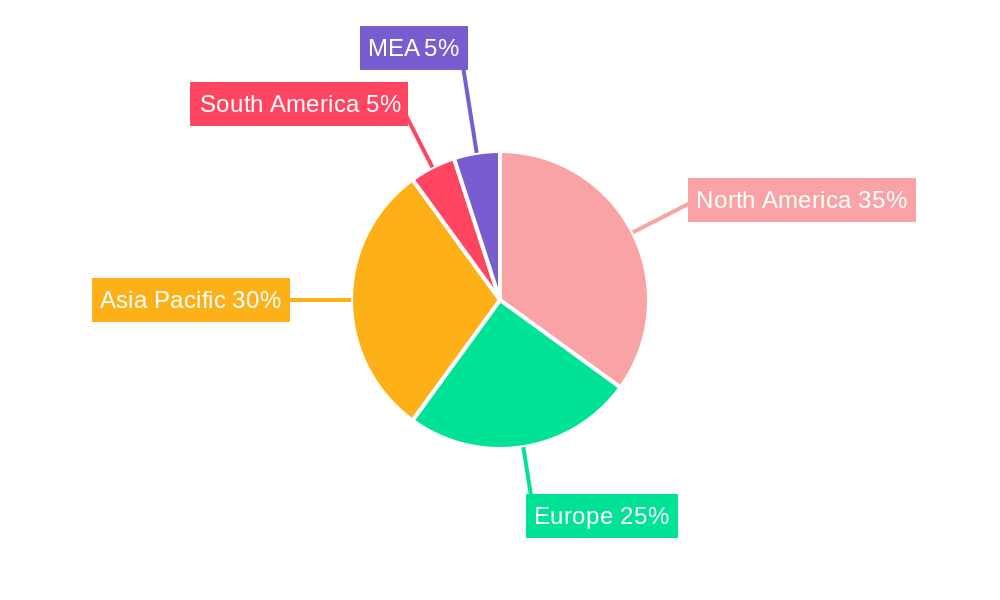
The geographical distribution of the market reveals strong growth across all regions, particularly in Asia Pacific, fueled by the significant presence of major semiconductor manufacturers and a rapidly expanding consumer electronics market in countries like China, South Korea, and India. North America and Europe also contribute significantly, driven by robust demand from the automotive, medical device, and communications sectors. Market segmentation analysis reveals a strong preference for advanced packaging technologies, with 3D and WLCSP witnessing substantial growth due to their superior performance capabilities. The competitive landscape is characterized by a mix of established industry giants and innovative emerging players, fostering continuous technological advancements and increased market competitiveness. The forecast period (2025-2033) is expected to witness substantial innovations in materials, designs, and manufacturing processes, which will likely further accelerate the growth and penetration of 2.5D and 3D packaging solutions across various applications.
2.5D & 3D Semiconductor Packaging Industry Report: 2019-2033
This comprehensive report provides an in-depth analysis of the 2.5D & 3D Semiconductor Packaging industry, offering invaluable insights for industry professionals, investors, and strategic decision-makers. With a study period spanning 2019-2033, a base year of 2025, and a forecast period of 2025-2033, this report leverages historical data (2019-2024) to project future market trends and growth. The report analyzes key market segments, dominant players, and emerging opportunities within this rapidly evolving sector. Expected market value in 2025 is estimated at $XX Million.
2.5D & 3D Semiconductor Packaging Industry Market Structure & Innovation Trends
The 2.5D & 3D semiconductor packaging market is characterized by a moderately concentrated structure, with key players like Samsung Electronics Co Ltd, TSMC Limited, and Intel Corporation holding significant market share. However, the emergence of innovative players like Tezzaron Semiconductor Corporation and strong regional players such as Jiangsu Changjiang Electronics Technology Co Ltd indicates a dynamic competitive landscape. Market share data for 2024 shows Samsung Electronics holding an estimated XX% share, followed by TSMC at XX%, and Intel at XX%. The remaining share is distributed among other key players listed in this report.
Innovation is a primary driver, fueled by the increasing demand for higher performance, power efficiency, and miniaturization in electronic devices. Key innovation drivers include advancements in packaging technologies (like 3D WLCSP and EMIB), the development of advanced materials, and the integration of AI capabilities into manufacturing processes. Regulatory frameworks, while generally supportive of technological advancement, often focus on environmental considerations and safety standards. Product substitutes are currently limited, although alternative packaging solutions might emerge in the future. M&A activity remains significant, with deal values in 2024 reaching an estimated $XX Million, driven by strategic acquisitions aimed at expanding product portfolios and gaining technological expertise.
- Market Concentration: Moderately concentrated, with top players holding significant shares.
- Innovation Drivers: Advancements in packaging technologies, materials, and AI-driven manufacturing.
- Regulatory Landscape: Focus on environmental and safety standards.
- M&A Activity: Significant activity with deal values in 2024 estimated at $XX Million.
2.5D & 3D Semiconductor Packaging Industry Market Dynamics & Trends
The 2.5D & 3D semiconductor packaging market is experiencing robust growth, driven by several key factors. The increasing demand for high-performance computing (HPC), artificial intelligence (AI), and 5G communication technologies is a primary driver, necessitating advanced packaging solutions that can deliver improved power efficiency and performance. Technological disruptions, such as the development of new materials and packaging techniques, further contribute to market expansion. Consumer preferences for smaller, faster, and more energy-efficient electronic devices are also shaping market dynamics. Competitive dynamics are characterized by both cooperation and rivalry among key players, with ongoing investments in R&D, strategic partnerships, and M&A activity shaping the industry landscape. The CAGR for the forecast period (2025-2033) is projected to be XX%, with market penetration expected to increase significantly across various end-user industries.
Dominant Regions & Segments in 2.5D & 3D Semiconductor Packaging Industry
Asia, particularly Taiwan, South Korea, and China, holds the dominant position in the 2.5D & 3D semiconductor packaging market. This dominance stems from several factors:
- Established Manufacturing Infrastructure: Extensive semiconductor manufacturing capabilities and a well-developed supply chain.
- Government Support: Favorable government policies and incentives for the semiconductor industry.
- Skilled Workforce: Availability of a large pool of skilled engineers and technicians.
Within the segment analysis:
- By Packaging Technology: 3D packaging is projected to witness faster growth than 3D WLCSP due to its ability to integrate more functionalities. The qualitative analysis of 3D WLCSP highlights its cost-effectiveness for certain applications.
- By End-user Industry: The consumer electronics segment currently holds the largest market share, driven by the proliferation of smartphones, tablets, and other consumer devices. However, the automotive and medical device segments are expected to exhibit significant growth in the coming years, driven by the increasing demand for advanced driver-assistance systems (ADAS) and medical imaging technologies.
Further analysis of each segment includes detailed market size projections, competitive dynamics, and growth drivers specific to each sector.
2.5D & 3D Semiconductor Packaging Industry Product Innovations
Recent product developments focus on enhancing performance, reducing power consumption, and improving reliability. This includes the integration of advanced materials, the development of new packaging techniques, and the use of AI-driven design tools. These innovations cater to the increasing demands of high-performance computing, AI, and 5G applications. Companies are focusing on differentiated offerings to gain competitive advantages, emphasizing higher integration density, improved thermal management, and smaller form factors.
Report Scope & Segmentation Analysis
This report segments the 2.5D & 3D semiconductor packaging market by packaging technology (3D, 3D WLCSP) and end-user industry (Consumer Electronics, Medical Devices, Communications and Telecom, Automotive, Other End-user Industries). Each segment's analysis includes detailed growth projections, market sizes (in Millions), and competitive dynamics for the forecast period (2025-2033). The 3D segment is projected to witness faster growth than 3D WLCSP, driven by its superior performance capabilities. The consumer electronics segment currently holds the largest market share, while the automotive and medical segments are expected to see accelerated growth in the future.
Key Drivers of 2.5D & 3D Semiconductor Packaging Industry Growth
The industry's growth is propelled by several key factors: the rising demand for higher performance computing, driven by AI and 5G; advancements in packaging technologies allowing for miniaturization and improved power efficiency; increasing adoption of these technologies in diverse end-user industries such as automotive, medical, and consumer electronics; and favorable government policies and incentives supporting technological innovation.
Challenges in the 2.5D & 3D Semiconductor Packaging Industry Sector
Challenges include maintaining a stable supply chain amidst geopolitical uncertainties, managing the complexity of advanced packaging processes, and navigating stringent regulatory compliance requirements. High R&D costs and intense competition also pose significant challenges to profitability.
Emerging Opportunities in 2.5D & 3D Semiconductor Packaging Industry
Emerging opportunities lie in the expanding applications of AI, 5G, and other advanced technologies. Growth is anticipated in specialized packaging solutions for high-performance computing, automotive electronics, and medical devices. New materials and process innovations will continue to open new market avenues.
Leading Players in the 2.5D & 3D Semiconductor Packaging Industry Market
- Samsung Electronics Co Ltd
- ASE Group
- TSMC Limited
- Jiangsu Changjiang Electronics Technology Co Ltd
- Tezzaron Semiconductor Corporation
- Powertech Technology Inc
- Siliconware Precision Industries Co Ltd (SPIL)
- Amkor Technology Inc
- Intel Corporation
- GlobalFoundries Inc
Key Developments in 2.5D & 3D Semiconductor Packaging Industry Industry
- November 2023: Samsung Electronics announced its new advanced 3D chip packaging technology, SAINT, aiming to challenge TSMC's market dominance. This development significantly impacts market competition and innovation.
- February 2024: The partnership between Ansys and Intel Foundry to provide multiphysics signoff solutions for Intel's advanced 2.5D chip assembly technology using EMIB underscores the increasing importance of advanced simulation tools in improving efficiency and reliability.
Future Outlook for 2.5D & 3D Semiconductor Packaging Industry Market
The future outlook for the 2.5D & 3D semiconductor packaging market is extremely positive. Continued advancements in packaging technologies, coupled with increasing demand from various end-user sectors, will drive substantial market growth. Strategic partnerships and investments in R&D will further accelerate innovation, leading to more efficient, reliable, and higher-performing packaging solutions. The market is poised for significant expansion, presenting lucrative opportunities for industry players.
2.5D & 3D Semiconductor Packaging Industry Segmentation
-
1. Packaging Technology
- 1.1. 3D
- 1.2. 2.5D
- 1.3. 3D Wafer
-
2. End-user Industry
- 2.1. Consumer Electronics
- 2.2. Medical Devices
- 2.3. Communications and Telecom
- 2.4. Automotive
- 2.5. Other End-user Industries
2.5D & 3D Semiconductor Packaging Industry Segmentation By Geography
- 1. United States
- 2. China
- 3. Taiwan
- 4. South Korea
- 5. Japan
- 6. Europe
- 7. Latin America
- 8. Middle East
2.5D & 3D Semiconductor Packaging Industry REPORT HIGHLIGHTS
| Aspects | Details |
|---|---|
| Study Period | 2019-2033 |
| Base Year | 2024 |
| Estimated Year | 2025 |
| Forecast Period | 2025-2033 |
| Historical Period | 2019-2024 |
| Growth Rate | CAGR of 17.20% from 2019-2033 |
| Segmentation |
|
Table of Contents
- 1. Introduction
- 1.1. Research Scope
- 1.2. Market Segmentation
- 1.3. Research Methodology
- 1.4. Definitions and Assumptions
- 2. Executive Summary
- 2.1. Introduction
- 3. Market Dynamics
- 3.1. Introduction
- 3.2. Market Drivers
- 3.2.1 Growing Consumption of Semiconductor Devices Across Several Industries; Increasing Demand for Compact
- 3.2.2 High Functionality Electronic Devices
- 3.3. Market Restrains
- 3.3.1. High Initial Investment and Increasing Complexity of Semiconductor IC Designs
- 3.4. Market Trends
- 3.4.1. Communications and Telecom End-user Industry is Expected to Hold Significant Market Share
- 4. Market Factor Analysis
- 4.1. Porters Five Forces
- 4.2. Supply/Value Chain
- 4.3. PESTEL analysis
- 4.4. Market Entropy
- 4.5. Patent/Trademark Analysis
- 5. Global 2.5D & 3D Semiconductor Packaging Industry Analysis, Insights and Forecast, 2019-2031
- 5.1. Market Analysis, Insights and Forecast - by Packaging Technology
- 5.1.1. 3D
- 5.1.2. 2.5D
- 5.1.3. 3D Wafer
- 5.2. Market Analysis, Insights and Forecast - by End-user Industry
- 5.2.1. Consumer Electronics
- 5.2.2. Medical Devices
- 5.2.3. Communications and Telecom
- 5.2.4. Automotive
- 5.2.5. Other End-user Industries
- 5.3. Market Analysis, Insights and Forecast - by Region
- 5.3.1. United States
- 5.3.2. China
- 5.3.3. Taiwan
- 5.3.4. South Korea
- 5.3.5. Japan
- 5.3.6. Europe
- 5.3.7. Latin America
- 5.3.8. Middle East
- 5.1. Market Analysis, Insights and Forecast - by Packaging Technology
- 6. United States 2.5D & 3D Semiconductor Packaging Industry Analysis, Insights and Forecast, 2019-2031
- 6.1. Market Analysis, Insights and Forecast - by Packaging Technology
- 6.1.1. 3D
- 6.1.2. 2.5D
- 6.1.3. 3D Wafer
- 6.2. Market Analysis, Insights and Forecast - by End-user Industry
- 6.2.1. Consumer Electronics
- 6.2.2. Medical Devices
- 6.2.3. Communications and Telecom
- 6.2.4. Automotive
- 6.2.5. Other End-user Industries
- 6.1. Market Analysis, Insights and Forecast - by Packaging Technology
- 7. China 2.5D & 3D Semiconductor Packaging Industry Analysis, Insights and Forecast, 2019-2031
- 7.1. Market Analysis, Insights and Forecast - by Packaging Technology
- 7.1.1. 3D
- 7.1.2. 2.5D
- 7.1.3. 3D Wafer
- 7.2. Market Analysis, Insights and Forecast - by End-user Industry
- 7.2.1. Consumer Electronics
- 7.2.2. Medical Devices
- 7.2.3. Communications and Telecom
- 7.2.4. Automotive
- 7.2.5. Other End-user Industries
- 7.1. Market Analysis, Insights and Forecast - by Packaging Technology
- 8. Taiwan 2.5D & 3D Semiconductor Packaging Industry Analysis, Insights and Forecast, 2019-2031
- 8.1. Market Analysis, Insights and Forecast - by Packaging Technology
- 8.1.1. 3D
- 8.1.2. 2.5D
- 8.1.3. 3D Wafer
- 8.2. Market Analysis, Insights and Forecast - by End-user Industry
- 8.2.1. Consumer Electronics
- 8.2.2. Medical Devices
- 8.2.3. Communications and Telecom
- 8.2.4. Automotive
- 8.2.5. Other End-user Industries
- 8.1. Market Analysis, Insights and Forecast - by Packaging Technology
- 9. South Korea 2.5D & 3D Semiconductor Packaging Industry Analysis, Insights and Forecast, 2019-2031
- 9.1. Market Analysis, Insights and Forecast - by Packaging Technology
- 9.1.1. 3D
- 9.1.2. 2.5D
- 9.1.3. 3D Wafer
- 9.2. Market Analysis, Insights and Forecast - by End-user Industry
- 9.2.1. Consumer Electronics
- 9.2.2. Medical Devices
- 9.2.3. Communications and Telecom
- 9.2.4. Automotive
- 9.2.5. Other End-user Industries
- 9.1. Market Analysis, Insights and Forecast - by Packaging Technology
- 10. Japan 2.5D & 3D Semiconductor Packaging Industry Analysis, Insights and Forecast, 2019-2031
- 10.1. Market Analysis, Insights and Forecast - by Packaging Technology
- 10.1.1. 3D
- 10.1.2. 2.5D
- 10.1.3. 3D Wafer
- 10.2. Market Analysis, Insights and Forecast - by End-user Industry
- 10.2.1. Consumer Electronics
- 10.2.2. Medical Devices
- 10.2.3. Communications and Telecom
- 10.2.4. Automotive
- 10.2.5. Other End-user Industries
- 10.1. Market Analysis, Insights and Forecast - by Packaging Technology
- 11. Europe 2.5D & 3D Semiconductor Packaging Industry Analysis, Insights and Forecast, 2019-2031
- 11.1. Market Analysis, Insights and Forecast - by Packaging Technology
- 11.1.1. 3D
- 11.1.2. 2.5D
- 11.1.3. 3D Wafer
- 11.2. Market Analysis, Insights and Forecast - by End-user Industry
- 11.2.1. Consumer Electronics
- 11.2.2. Medical Devices
- 11.2.3. Communications and Telecom
- 11.2.4. Automotive
- 11.2.5. Other End-user Industries
- 11.1. Market Analysis, Insights and Forecast - by Packaging Technology
- 12. Latin America 2.5D & 3D Semiconductor Packaging Industry Analysis, Insights and Forecast, 2019-2031
- 12.1. Market Analysis, Insights and Forecast - by Packaging Technology
- 12.1.1. 3D
- 12.1.2. 2.5D
- 12.1.3. 3D Wafer
- 12.2. Market Analysis, Insights and Forecast - by End-user Industry
- 12.2.1. Consumer Electronics
- 12.2.2. Medical Devices
- 12.2.3. Communications and Telecom
- 12.2.4. Automotive
- 12.2.5. Other End-user Industries
- 12.1. Market Analysis, Insights and Forecast - by Packaging Technology
- 13. Middle East 2.5D & 3D Semiconductor Packaging Industry Analysis, Insights and Forecast, 2019-2031
- 13.1. Market Analysis, Insights and Forecast - by Packaging Technology
- 13.1.1. 3D
- 13.1.2. 2.5D
- 13.1.3. 3D Wafer
- 13.2. Market Analysis, Insights and Forecast - by End-user Industry
- 13.2.1. Consumer Electronics
- 13.2.2. Medical Devices
- 13.2.3. Communications and Telecom
- 13.2.4. Automotive
- 13.2.5. Other End-user Industries
- 13.1. Market Analysis, Insights and Forecast - by Packaging Technology
- 14. North America 2.5D & 3D Semiconductor Packaging Industry Analysis, Insights and Forecast, 2019-2031
- 14.1. Market Analysis, Insights and Forecast - By Country/Sub-region
- 14.1.1 United States
- 14.1.2 Canada
- 14.1.3 Mexico
- 15. Europe 2.5D & 3D Semiconductor Packaging Industry Analysis, Insights and Forecast, 2019-2031
- 15.1. Market Analysis, Insights and Forecast - By Country/Sub-region
- 15.1.1 Germany
- 15.1.2 United Kingdom
- 15.1.3 France
- 15.1.4 Spain
- 15.1.5 Italy
- 15.1.6 Spain
- 15.1.7 Belgium
- 15.1.8 Netherland
- 15.1.9 Nordics
- 15.1.10 Rest of Europe
- 16. Asia Pacific 2.5D & 3D Semiconductor Packaging Industry Analysis, Insights and Forecast, 2019-2031
- 16.1. Market Analysis, Insights and Forecast - By Country/Sub-region
- 16.1.1 China
- 16.1.2 Japan
- 16.1.3 India
- 16.1.4 South Korea
- 16.1.5 Southeast Asia
- 16.1.6 Australia
- 16.1.7 Indonesia
- 16.1.8 Phillipes
- 16.1.9 Singapore
- 16.1.10 Thailandc
- 16.1.11 Rest of Asia Pacific
- 17. South America 2.5D & 3D Semiconductor Packaging Industry Analysis, Insights and Forecast, 2019-2031
- 17.1. Market Analysis, Insights and Forecast - By Country/Sub-region
- 17.1.1 Brazil
- 17.1.2 Argentina
- 17.1.3 Peru
- 17.1.4 Chile
- 17.1.5 Colombia
- 17.1.6 Ecuador
- 17.1.7 Venezuela
- 17.1.8 Rest of South America
- 18. North America 2.5D & 3D Semiconductor Packaging Industry Analysis, Insights and Forecast, 2019-2031
- 18.1. Market Analysis, Insights and Forecast - By Country/Sub-region
- 18.1.1 United States
- 18.1.2 Canada
- 18.1.3 Mexico
- 19. MEA 2.5D & 3D Semiconductor Packaging Industry Analysis, Insights and Forecast, 2019-2031
- 19.1. Market Analysis, Insights and Forecast - By Country/Sub-region
- 19.1.1 United Arab Emirates
- 19.1.2 Saudi Arabia
- 19.1.3 South Africa
- 19.1.4 Rest of Middle East and Africa
- 20. Competitive Analysis
- 20.1. Global Market Share Analysis 2024
- 20.2. Company Profiles
- 20.2.1 Samsung Electronics Co Ltd
- 20.2.1.1. Overview
- 20.2.1.2. Products
- 20.2.1.3. SWOT Analysis
- 20.2.1.4. Recent Developments
- 20.2.1.5. Financials (Based on Availability)
- 20.2.2 ASE Group
- 20.2.2.1. Overview
- 20.2.2.2. Products
- 20.2.2.3. SWOT Analysis
- 20.2.2.4. Recent Developments
- 20.2.2.5. Financials (Based on Availability)
- 20.2.3 TSMC Limited
- 20.2.3.1. Overview
- 20.2.3.2. Products
- 20.2.3.3. SWOT Analysis
- 20.2.3.4. Recent Developments
- 20.2.3.5. Financials (Based on Availability)
- 20.2.4 Jiangsu Changjiang Electronics Technology Co Ltd
- 20.2.4.1. Overview
- 20.2.4.2. Products
- 20.2.4.3. SWOT Analysis
- 20.2.4.4. Recent Developments
- 20.2.4.5. Financials (Based on Availability)
- 20.2.5 Tezzaron Semiconductor Corporation
- 20.2.5.1. Overview
- 20.2.5.2. Products
- 20.2.5.3. SWOT Analysis
- 20.2.5.4. Recent Developments
- 20.2.5.5. Financials (Based on Availability)
- 20.2.6 Powertech Technology Inc
- 20.2.6.1. Overview
- 20.2.6.2. Products
- 20.2.6.3. SWOT Analysis
- 20.2.6.4. Recent Developments
- 20.2.6.5. Financials (Based on Availability)
- 20.2.7 Siliconware Precision Industries Co Ltd (SPIL)
- 20.2.7.1. Overview
- 20.2.7.2. Products
- 20.2.7.3. SWOT Analysis
- 20.2.7.4. Recent Developments
- 20.2.7.5. Financials (Based on Availability)
- 20.2.8 Amkor Technology Inc
- 20.2.8.1. Overview
- 20.2.8.2. Products
- 20.2.8.3. SWOT Analysis
- 20.2.8.4. Recent Developments
- 20.2.8.5. Financials (Based on Availability)
- 20.2.9 Intel Corporation
- 20.2.9.1. Overview
- 20.2.9.2. Products
- 20.2.9.3. SWOT Analysis
- 20.2.9.4. Recent Developments
- 20.2.9.5. Financials (Based on Availability)
- 20.2.10 GlobalFoundries Inc
- 20.2.10.1. Overview
- 20.2.10.2. Products
- 20.2.10.3. SWOT Analysis
- 20.2.10.4. Recent Developments
- 20.2.10.5. Financials (Based on Availability)
- 20.2.1 Samsung Electronics Co Ltd
List of Figures
- Figure 1: Global 2.5D & 3D Semiconductor Packaging Industry Revenue Breakdown (Million, %) by Region 2024 & 2032
- Figure 2: Global 2.5D & 3D Semiconductor Packaging Industry Volume Breakdown (K Unit, %) by Region 2024 & 2032
- Figure 3: North America 2.5D & 3D Semiconductor Packaging Industry Revenue (Million), by Country 2024 & 2032
- Figure 4: North America 2.5D & 3D Semiconductor Packaging Industry Volume (K Unit), by Country 2024 & 2032
- Figure 5: North America 2.5D & 3D Semiconductor Packaging Industry Revenue Share (%), by Country 2024 & 2032
- Figure 6: North America 2.5D & 3D Semiconductor Packaging Industry Volume Share (%), by Country 2024 & 2032
- Figure 7: Europe 2.5D & 3D Semiconductor Packaging Industry Revenue (Million), by Country 2024 & 2032
- Figure 8: Europe 2.5D & 3D Semiconductor Packaging Industry Volume (K Unit), by Country 2024 & 2032
- Figure 9: Europe 2.5D & 3D Semiconductor Packaging Industry Revenue Share (%), by Country 2024 & 2032
- Figure 10: Europe 2.5D & 3D Semiconductor Packaging Industry Volume Share (%), by Country 2024 & 2032
- Figure 11: Asia Pacific 2.5D & 3D Semiconductor Packaging Industry Revenue (Million), by Country 2024 & 2032
- Figure 12: Asia Pacific 2.5D & 3D Semiconductor Packaging Industry Volume (K Unit), by Country 2024 & 2032
- Figure 13: Asia Pacific 2.5D & 3D Semiconductor Packaging Industry Revenue Share (%), by Country 2024 & 2032
- Figure 14: Asia Pacific 2.5D & 3D Semiconductor Packaging Industry Volume Share (%), by Country 2024 & 2032
- Figure 15: South America 2.5D & 3D Semiconductor Packaging Industry Revenue (Million), by Country 2024 & 2032
- Figure 16: South America 2.5D & 3D Semiconductor Packaging Industry Volume (K Unit), by Country 2024 & 2032
- Figure 17: South America 2.5D & 3D Semiconductor Packaging Industry Revenue Share (%), by Country 2024 & 2032
- Figure 18: South America 2.5D & 3D Semiconductor Packaging Industry Volume Share (%), by Country 2024 & 2032
- Figure 19: North America 2.5D & 3D Semiconductor Packaging Industry Revenue (Million), by Country 2024 & 2032
- Figure 20: North America 2.5D & 3D Semiconductor Packaging Industry Volume (K Unit), by Country 2024 & 2032
- Figure 21: North America 2.5D & 3D Semiconductor Packaging Industry Revenue Share (%), by Country 2024 & 2032
- Figure 22: North America 2.5D & 3D Semiconductor Packaging Industry Volume Share (%), by Country 2024 & 2032
- Figure 23: MEA 2.5D & 3D Semiconductor Packaging Industry Revenue (Million), by Country 2024 & 2032
- Figure 24: MEA 2.5D & 3D Semiconductor Packaging Industry Volume (K Unit), by Country 2024 & 2032
- Figure 25: MEA 2.5D & 3D Semiconductor Packaging Industry Revenue Share (%), by Country 2024 & 2032
- Figure 26: MEA 2.5D & 3D Semiconductor Packaging Industry Volume Share (%), by Country 2024 & 2032
- Figure 27: United States 2.5D & 3D Semiconductor Packaging Industry Revenue (Million), by Packaging Technology 2024 & 2032
- Figure 28: United States 2.5D & 3D Semiconductor Packaging Industry Volume (K Unit), by Packaging Technology 2024 & 2032
- Figure 29: United States 2.5D & 3D Semiconductor Packaging Industry Revenue Share (%), by Packaging Technology 2024 & 2032
- Figure 30: United States 2.5D & 3D Semiconductor Packaging Industry Volume Share (%), by Packaging Technology 2024 & 2032
- Figure 31: United States 2.5D & 3D Semiconductor Packaging Industry Revenue (Million), by End-user Industry 2024 & 2032
- Figure 32: United States 2.5D & 3D Semiconductor Packaging Industry Volume (K Unit), by End-user Industry 2024 & 2032
- Figure 33: United States 2.5D & 3D Semiconductor Packaging Industry Revenue Share (%), by End-user Industry 2024 & 2032
- Figure 34: United States 2.5D & 3D Semiconductor Packaging Industry Volume Share (%), by End-user Industry 2024 & 2032
- Figure 35: United States 2.5D & 3D Semiconductor Packaging Industry Revenue (Million), by Country 2024 & 2032
- Figure 36: United States 2.5D & 3D Semiconductor Packaging Industry Volume (K Unit), by Country 2024 & 2032
- Figure 37: United States 2.5D & 3D Semiconductor Packaging Industry Revenue Share (%), by Country 2024 & 2032
- Figure 38: United States 2.5D & 3D Semiconductor Packaging Industry Volume Share (%), by Country 2024 & 2032
- Figure 39: China 2.5D & 3D Semiconductor Packaging Industry Revenue (Million), by Packaging Technology 2024 & 2032
- Figure 40: China 2.5D & 3D Semiconductor Packaging Industry Volume (K Unit), by Packaging Technology 2024 & 2032
- Figure 41: China 2.5D & 3D Semiconductor Packaging Industry Revenue Share (%), by Packaging Technology 2024 & 2032
- Figure 42: China 2.5D & 3D Semiconductor Packaging Industry Volume Share (%), by Packaging Technology 2024 & 2032
- Figure 43: China 2.5D & 3D Semiconductor Packaging Industry Revenue (Million), by End-user Industry 2024 & 2032
- Figure 44: China 2.5D & 3D Semiconductor Packaging Industry Volume (K Unit), by End-user Industry 2024 & 2032
- Figure 45: China 2.5D & 3D Semiconductor Packaging Industry Revenue Share (%), by End-user Industry 2024 & 2032
- Figure 46: China 2.5D & 3D Semiconductor Packaging Industry Volume Share (%), by End-user Industry 2024 & 2032
- Figure 47: China 2.5D & 3D Semiconductor Packaging Industry Revenue (Million), by Country 2024 & 2032
- Figure 48: China 2.5D & 3D Semiconductor Packaging Industry Volume (K Unit), by Country 2024 & 2032
- Figure 49: China 2.5D & 3D Semiconductor Packaging Industry Revenue Share (%), by Country 2024 & 2032
- Figure 50: China 2.5D & 3D Semiconductor Packaging Industry Volume Share (%), by Country 2024 & 2032
- Figure 51: Taiwan 2.5D & 3D Semiconductor Packaging Industry Revenue (Million), by Packaging Technology 2024 & 2032
- Figure 52: Taiwan 2.5D & 3D Semiconductor Packaging Industry Volume (K Unit), by Packaging Technology 2024 & 2032
- Figure 53: Taiwan 2.5D & 3D Semiconductor Packaging Industry Revenue Share (%), by Packaging Technology 2024 & 2032
- Figure 54: Taiwan 2.5D & 3D Semiconductor Packaging Industry Volume Share (%), by Packaging Technology 2024 & 2032
- Figure 55: Taiwan 2.5D & 3D Semiconductor Packaging Industry Revenue (Million), by End-user Industry 2024 & 2032
- Figure 56: Taiwan 2.5D & 3D Semiconductor Packaging Industry Volume (K Unit), by End-user Industry 2024 & 2032
- Figure 57: Taiwan 2.5D & 3D Semiconductor Packaging Industry Revenue Share (%), by End-user Industry 2024 & 2032
- Figure 58: Taiwan 2.5D & 3D Semiconductor Packaging Industry Volume Share (%), by End-user Industry 2024 & 2032
- Figure 59: Taiwan 2.5D & 3D Semiconductor Packaging Industry Revenue (Million), by Country 2024 & 2032
- Figure 60: Taiwan 2.5D & 3D Semiconductor Packaging Industry Volume (K Unit), by Country 2024 & 2032
- Figure 61: Taiwan 2.5D & 3D Semiconductor Packaging Industry Revenue Share (%), by Country 2024 & 2032
- Figure 62: Taiwan 2.5D & 3D Semiconductor Packaging Industry Volume Share (%), by Country 2024 & 2032
- Figure 63: South Korea 2.5D & 3D Semiconductor Packaging Industry Revenue (Million), by Packaging Technology 2024 & 2032
- Figure 64: South Korea 2.5D & 3D Semiconductor Packaging Industry Volume (K Unit), by Packaging Technology 2024 & 2032
- Figure 65: South Korea 2.5D & 3D Semiconductor Packaging Industry Revenue Share (%), by Packaging Technology 2024 & 2032
- Figure 66: South Korea 2.5D & 3D Semiconductor Packaging Industry Volume Share (%), by Packaging Technology 2024 & 2032
- Figure 67: South Korea 2.5D & 3D Semiconductor Packaging Industry Revenue (Million), by End-user Industry 2024 & 2032
- Figure 68: South Korea 2.5D & 3D Semiconductor Packaging Industry Volume (K Unit), by End-user Industry 2024 & 2032
- Figure 69: South Korea 2.5D & 3D Semiconductor Packaging Industry Revenue Share (%), by End-user Industry 2024 & 2032
- Figure 70: South Korea 2.5D & 3D Semiconductor Packaging Industry Volume Share (%), by End-user Industry 2024 & 2032
- Figure 71: South Korea 2.5D & 3D Semiconductor Packaging Industry Revenue (Million), by Country 2024 & 2032
- Figure 72: South Korea 2.5D & 3D Semiconductor Packaging Industry Volume (K Unit), by Country 2024 & 2032
- Figure 73: South Korea 2.5D & 3D Semiconductor Packaging Industry Revenue Share (%), by Country 2024 & 2032
- Figure 74: South Korea 2.5D & 3D Semiconductor Packaging Industry Volume Share (%), by Country 2024 & 2032
- Figure 75: Japan 2.5D & 3D Semiconductor Packaging Industry Revenue (Million), by Packaging Technology 2024 & 2032
- Figure 76: Japan 2.5D & 3D Semiconductor Packaging Industry Volume (K Unit), by Packaging Technology 2024 & 2032
- Figure 77: Japan 2.5D & 3D Semiconductor Packaging Industry Revenue Share (%), by Packaging Technology 2024 & 2032
- Figure 78: Japan 2.5D & 3D Semiconductor Packaging Industry Volume Share (%), by Packaging Technology 2024 & 2032
- Figure 79: Japan 2.5D & 3D Semiconductor Packaging Industry Revenue (Million), by End-user Industry 2024 & 2032
- Figure 80: Japan 2.5D & 3D Semiconductor Packaging Industry Volume (K Unit), by End-user Industry 2024 & 2032
- Figure 81: Japan 2.5D & 3D Semiconductor Packaging Industry Revenue Share (%), by End-user Industry 2024 & 2032
- Figure 82: Japan 2.5D & 3D Semiconductor Packaging Industry Volume Share (%), by End-user Industry 2024 & 2032
- Figure 83: Japan 2.5D & 3D Semiconductor Packaging Industry Revenue (Million), by Country 2024 & 2032
- Figure 84: Japan 2.5D & 3D Semiconductor Packaging Industry Volume (K Unit), by Country 2024 & 2032
- Figure 85: Japan 2.5D & 3D Semiconductor Packaging Industry Revenue Share (%), by Country 2024 & 2032
- Figure 86: Japan 2.5D & 3D Semiconductor Packaging Industry Volume Share (%), by Country 2024 & 2032
- Figure 87: Europe 2.5D & 3D Semiconductor Packaging Industry Revenue (Million), by Packaging Technology 2024 & 2032
- Figure 88: Europe 2.5D & 3D Semiconductor Packaging Industry Volume (K Unit), by Packaging Technology 2024 & 2032
- Figure 89: Europe 2.5D & 3D Semiconductor Packaging Industry Revenue Share (%), by Packaging Technology 2024 & 2032
- Figure 90: Europe 2.5D & 3D Semiconductor Packaging Industry Volume Share (%), by Packaging Technology 2024 & 2032
- Figure 91: Europe 2.5D & 3D Semiconductor Packaging Industry Revenue (Million), by End-user Industry 2024 & 2032
- Figure 92: Europe 2.5D & 3D Semiconductor Packaging Industry Volume (K Unit), by End-user Industry 2024 & 2032
- Figure 93: Europe 2.5D & 3D Semiconductor Packaging Industry Revenue Share (%), by End-user Industry 2024 & 2032
- Figure 94: Europe 2.5D & 3D Semiconductor Packaging Industry Volume Share (%), by End-user Industry 2024 & 2032
- Figure 95: Europe 2.5D & 3D Semiconductor Packaging Industry Revenue (Million), by Country 2024 & 2032
- Figure 96: Europe 2.5D & 3D Semiconductor Packaging Industry Volume (K Unit), by Country 2024 & 2032
- Figure 97: Europe 2.5D & 3D Semiconductor Packaging Industry Revenue Share (%), by Country 2024 & 2032
- Figure 98: Europe 2.5D & 3D Semiconductor Packaging Industry Volume Share (%), by Country 2024 & 2032
- Figure 99: Latin America 2.5D & 3D Semiconductor Packaging Industry Revenue (Million), by Packaging Technology 2024 & 2032
- Figure 100: Latin America 2.5D & 3D Semiconductor Packaging Industry Volume (K Unit), by Packaging Technology 2024 & 2032
- Figure 101: Latin America 2.5D & 3D Semiconductor Packaging Industry Revenue Share (%), by Packaging Technology 2024 & 2032
- Figure 102: Latin America 2.5D & 3D Semiconductor Packaging Industry Volume Share (%), by Packaging Technology 2024 & 2032
- Figure 103: Latin America 2.5D & 3D Semiconductor Packaging Industry Revenue (Million), by End-user Industry 2024 & 2032
- Figure 104: Latin America 2.5D & 3D Semiconductor Packaging Industry Volume (K Unit), by End-user Industry 2024 & 2032
- Figure 105: Latin America 2.5D & 3D Semiconductor Packaging Industry Revenue Share (%), by End-user Industry 2024 & 2032
- Figure 106: Latin America 2.5D & 3D Semiconductor Packaging Industry Volume Share (%), by End-user Industry 2024 & 2032
- Figure 107: Latin America 2.5D & 3D Semiconductor Packaging Industry Revenue (Million), by Country 2024 & 2032
- Figure 108: Latin America 2.5D & 3D Semiconductor Packaging Industry Volume (K Unit), by Country 2024 & 2032
- Figure 109: Latin America 2.5D & 3D Semiconductor Packaging Industry Revenue Share (%), by Country 2024 & 2032
- Figure 110: Latin America 2.5D & 3D Semiconductor Packaging Industry Volume Share (%), by Country 2024 & 2032
- Figure 111: Middle East 2.5D & 3D Semiconductor Packaging Industry Revenue (Million), by Packaging Technology 2024 & 2032
- Figure 112: Middle East 2.5D & 3D Semiconductor Packaging Industry Volume (K Unit), by Packaging Technology 2024 & 2032
- Figure 113: Middle East 2.5D & 3D Semiconductor Packaging Industry Revenue Share (%), by Packaging Technology 2024 & 2032
- Figure 114: Middle East 2.5D & 3D Semiconductor Packaging Industry Volume Share (%), by Packaging Technology 2024 & 2032
- Figure 115: Middle East 2.5D & 3D Semiconductor Packaging Industry Revenue (Million), by End-user Industry 2024 & 2032
- Figure 116: Middle East 2.5D & 3D Semiconductor Packaging Industry Volume (K Unit), by End-user Industry 2024 & 2032
- Figure 117: Middle East 2.5D & 3D Semiconductor Packaging Industry Revenue Share (%), by End-user Industry 2024 & 2032
- Figure 118: Middle East 2.5D & 3D Semiconductor Packaging Industry Volume Share (%), by End-user Industry 2024 & 2032
- Figure 119: Middle East 2.5D & 3D Semiconductor Packaging Industry Revenue (Million), by Country 2024 & 2032
- Figure 120: Middle East 2.5D & 3D Semiconductor Packaging Industry Volume (K Unit), by Country 2024 & 2032
- Figure 121: Middle East 2.5D & 3D Semiconductor Packaging Industry Revenue Share (%), by Country 2024 & 2032
- Figure 122: Middle East 2.5D & 3D Semiconductor Packaging Industry Volume Share (%), by Country 2024 & 2032
List of Tables
- Table 1: Global 2.5D & 3D Semiconductor Packaging Industry Revenue Million Forecast, by Region 2019 & 2032
- Table 2: Global 2.5D & 3D Semiconductor Packaging Industry Volume K Unit Forecast, by Region 2019 & 2032
- Table 3: Global 2.5D & 3D Semiconductor Packaging Industry Revenue Million Forecast, by Packaging Technology 2019 & 2032
- Table 4: Global 2.5D & 3D Semiconductor Packaging Industry Volume K Unit Forecast, by Packaging Technology 2019 & 2032
- Table 5: Global 2.5D & 3D Semiconductor Packaging Industry Revenue Million Forecast, by End-user Industry 2019 & 2032
- Table 6: Global 2.5D & 3D Semiconductor Packaging Industry Volume K Unit Forecast, by End-user Industry 2019 & 2032
- Table 7: Global 2.5D & 3D Semiconductor Packaging Industry Revenue Million Forecast, by Region 2019 & 2032
- Table 8: Global 2.5D & 3D Semiconductor Packaging Industry Volume K Unit Forecast, by Region 2019 & 2032
- Table 9: Global 2.5D & 3D Semiconductor Packaging Industry Revenue Million Forecast, by Country 2019 & 2032
- Table 10: Global 2.5D & 3D Semiconductor Packaging Industry Volume K Unit Forecast, by Country 2019 & 2032
- Table 11: United States 2.5D & 3D Semiconductor Packaging Industry Revenue (Million) Forecast, by Application 2019 & 2032
- Table 12: United States 2.5D & 3D Semiconductor Packaging Industry Volume (K Unit) Forecast, by Application 2019 & 2032
- Table 13: Canada 2.5D & 3D Semiconductor Packaging Industry Revenue (Million) Forecast, by Application 2019 & 2032
- Table 14: Canada 2.5D & 3D Semiconductor Packaging Industry Volume (K Unit) Forecast, by Application 2019 & 2032
- Table 15: Mexico 2.5D & 3D Semiconductor Packaging Industry Revenue (Million) Forecast, by Application 2019 & 2032
- Table 16: Mexico 2.5D & 3D Semiconductor Packaging Industry Volume (K Unit) Forecast, by Application 2019 & 2032
- Table 17: Global 2.5D & 3D Semiconductor Packaging Industry Revenue Million Forecast, by Country 2019 & 2032
- Table 18: Global 2.5D & 3D Semiconductor Packaging Industry Volume K Unit Forecast, by Country 2019 & 2032
- Table 19: Germany 2.5D & 3D Semiconductor Packaging Industry Revenue (Million) Forecast, by Application 2019 & 2032
- Table 20: Germany 2.5D & 3D Semiconductor Packaging Industry Volume (K Unit) Forecast, by Application 2019 & 2032
- Table 21: United Kingdom 2.5D & 3D Semiconductor Packaging Industry Revenue (Million) Forecast, by Application 2019 & 2032
- Table 22: United Kingdom 2.5D & 3D Semiconductor Packaging Industry Volume (K Unit) Forecast, by Application 2019 & 2032
- Table 23: France 2.5D & 3D Semiconductor Packaging Industry Revenue (Million) Forecast, by Application 2019 & 2032
- Table 24: France 2.5D & 3D Semiconductor Packaging Industry Volume (K Unit) Forecast, by Application 2019 & 2032
- Table 25: Spain 2.5D & 3D Semiconductor Packaging Industry Revenue (Million) Forecast, by Application 2019 & 2032
- Table 26: Spain 2.5D & 3D Semiconductor Packaging Industry Volume (K Unit) Forecast, by Application 2019 & 2032
- Table 27: Italy 2.5D & 3D Semiconductor Packaging Industry Revenue (Million) Forecast, by Application 2019 & 2032
- Table 28: Italy 2.5D & 3D Semiconductor Packaging Industry Volume (K Unit) Forecast, by Application 2019 & 2032
- Table 29: Spain 2.5D & 3D Semiconductor Packaging Industry Revenue (Million) Forecast, by Application 2019 & 2032
- Table 30: Spain 2.5D & 3D Semiconductor Packaging Industry Volume (K Unit) Forecast, by Application 2019 & 2032
- Table 31: Belgium 2.5D & 3D Semiconductor Packaging Industry Revenue (Million) Forecast, by Application 2019 & 2032
- Table 32: Belgium 2.5D & 3D Semiconductor Packaging Industry Volume (K Unit) Forecast, by Application 2019 & 2032
- Table 33: Netherland 2.5D & 3D Semiconductor Packaging Industry Revenue (Million) Forecast, by Application 2019 & 2032
- Table 34: Netherland 2.5D & 3D Semiconductor Packaging Industry Volume (K Unit) Forecast, by Application 2019 & 2032
- Table 35: Nordics 2.5D & 3D Semiconductor Packaging Industry Revenue (Million) Forecast, by Application 2019 & 2032
- Table 36: Nordics 2.5D & 3D Semiconductor Packaging Industry Volume (K Unit) Forecast, by Application 2019 & 2032
- Table 37: Rest of Europe 2.5D & 3D Semiconductor Packaging Industry Revenue (Million) Forecast, by Application 2019 & 2032
- Table 38: Rest of Europe 2.5D & 3D Semiconductor Packaging Industry Volume (K Unit) Forecast, by Application 2019 & 2032
- Table 39: Global 2.5D & 3D Semiconductor Packaging Industry Revenue Million Forecast, by Country 2019 & 2032
- Table 40: Global 2.5D & 3D Semiconductor Packaging Industry Volume K Unit Forecast, by Country 2019 & 2032
- Table 41: China 2.5D & 3D Semiconductor Packaging Industry Revenue (Million) Forecast, by Application 2019 & 2032
- Table 42: China 2.5D & 3D Semiconductor Packaging Industry Volume (K Unit) Forecast, by Application 2019 & 2032
- Table 43: Japan 2.5D & 3D Semiconductor Packaging Industry Revenue (Million) Forecast, by Application 2019 & 2032
- Table 44: Japan 2.5D & 3D Semiconductor Packaging Industry Volume (K Unit) Forecast, by Application 2019 & 2032
- Table 45: India 2.5D & 3D Semiconductor Packaging Industry Revenue (Million) Forecast, by Application 2019 & 2032
- Table 46: India 2.5D & 3D Semiconductor Packaging Industry Volume (K Unit) Forecast, by Application 2019 & 2032
- Table 47: South Korea 2.5D & 3D Semiconductor Packaging Industry Revenue (Million) Forecast, by Application 2019 & 2032
- Table 48: South Korea 2.5D & 3D Semiconductor Packaging Industry Volume (K Unit) Forecast, by Application 2019 & 2032
- Table 49: Southeast Asia 2.5D & 3D Semiconductor Packaging Industry Revenue (Million) Forecast, by Application 2019 & 2032
- Table 50: Southeast Asia 2.5D & 3D Semiconductor Packaging Industry Volume (K Unit) Forecast, by Application 2019 & 2032
- Table 51: Australia 2.5D & 3D Semiconductor Packaging Industry Revenue (Million) Forecast, by Application 2019 & 2032
- Table 52: Australia 2.5D & 3D Semiconductor Packaging Industry Volume (K Unit) Forecast, by Application 2019 & 2032
- Table 53: Indonesia 2.5D & 3D Semiconductor Packaging Industry Revenue (Million) Forecast, by Application 2019 & 2032
- Table 54: Indonesia 2.5D & 3D Semiconductor Packaging Industry Volume (K Unit) Forecast, by Application 2019 & 2032
- Table 55: Phillipes 2.5D & 3D Semiconductor Packaging Industry Revenue (Million) Forecast, by Application 2019 & 2032
- Table 56: Phillipes 2.5D & 3D Semiconductor Packaging Industry Volume (K Unit) Forecast, by Application 2019 & 2032
- Table 57: Singapore 2.5D & 3D Semiconductor Packaging Industry Revenue (Million) Forecast, by Application 2019 & 2032
- Table 58: Singapore 2.5D & 3D Semiconductor Packaging Industry Volume (K Unit) Forecast, by Application 2019 & 2032
- Table 59: Thailandc 2.5D & 3D Semiconductor Packaging Industry Revenue (Million) Forecast, by Application 2019 & 2032
- Table 60: Thailandc 2.5D & 3D Semiconductor Packaging Industry Volume (K Unit) Forecast, by Application 2019 & 2032
- Table 61: Rest of Asia Pacific 2.5D & 3D Semiconductor Packaging Industry Revenue (Million) Forecast, by Application 2019 & 2032
- Table 62: Rest of Asia Pacific 2.5D & 3D Semiconductor Packaging Industry Volume (K Unit) Forecast, by Application 2019 & 2032
- Table 63: Global 2.5D & 3D Semiconductor Packaging Industry Revenue Million Forecast, by Country 2019 & 2032
- Table 64: Global 2.5D & 3D Semiconductor Packaging Industry Volume K Unit Forecast, by Country 2019 & 2032
- Table 65: Brazil 2.5D & 3D Semiconductor Packaging Industry Revenue (Million) Forecast, by Application 2019 & 2032
- Table 66: Brazil 2.5D & 3D Semiconductor Packaging Industry Volume (K Unit) Forecast, by Application 2019 & 2032
- Table 67: Argentina 2.5D & 3D Semiconductor Packaging Industry Revenue (Million) Forecast, by Application 2019 & 2032
- Table 68: Argentina 2.5D & 3D Semiconductor Packaging Industry Volume (K Unit) Forecast, by Application 2019 & 2032
- Table 69: Peru 2.5D & 3D Semiconductor Packaging Industry Revenue (Million) Forecast, by Application 2019 & 2032
- Table 70: Peru 2.5D & 3D Semiconductor Packaging Industry Volume (K Unit) Forecast, by Application 2019 & 2032
- Table 71: Chile 2.5D & 3D Semiconductor Packaging Industry Revenue (Million) Forecast, by Application 2019 & 2032
- Table 72: Chile 2.5D & 3D Semiconductor Packaging Industry Volume (K Unit) Forecast, by Application 2019 & 2032
- Table 73: Colombia 2.5D & 3D Semiconductor Packaging Industry Revenue (Million) Forecast, by Application 2019 & 2032
- Table 74: Colombia 2.5D & 3D Semiconductor Packaging Industry Volume (K Unit) Forecast, by Application 2019 & 2032
- Table 75: Ecuador 2.5D & 3D Semiconductor Packaging Industry Revenue (Million) Forecast, by Application 2019 & 2032
- Table 76: Ecuador 2.5D & 3D Semiconductor Packaging Industry Volume (K Unit) Forecast, by Application 2019 & 2032
- Table 77: Venezuela 2.5D & 3D Semiconductor Packaging Industry Revenue (Million) Forecast, by Application 2019 & 2032
- Table 78: Venezuela 2.5D & 3D Semiconductor Packaging Industry Volume (K Unit) Forecast, by Application 2019 & 2032
- Table 79: Rest of South America 2.5D & 3D Semiconductor Packaging Industry Revenue (Million) Forecast, by Application 2019 & 2032
- Table 80: Rest of South America 2.5D & 3D Semiconductor Packaging Industry Volume (K Unit) Forecast, by Application 2019 & 2032
- Table 81: Global 2.5D & 3D Semiconductor Packaging Industry Revenue Million Forecast, by Country 2019 & 2032
- Table 82: Global 2.5D & 3D Semiconductor Packaging Industry Volume K Unit Forecast, by Country 2019 & 2032
- Table 83: United States 2.5D & 3D Semiconductor Packaging Industry Revenue (Million) Forecast, by Application 2019 & 2032
- Table 84: United States 2.5D & 3D Semiconductor Packaging Industry Volume (K Unit) Forecast, by Application 2019 & 2032
- Table 85: Canada 2.5D & 3D Semiconductor Packaging Industry Revenue (Million) Forecast, by Application 2019 & 2032
- Table 86: Canada 2.5D & 3D Semiconductor Packaging Industry Volume (K Unit) Forecast, by Application 2019 & 2032
- Table 87: Mexico 2.5D & 3D Semiconductor Packaging Industry Revenue (Million) Forecast, by Application 2019 & 2032
- Table 88: Mexico 2.5D & 3D Semiconductor Packaging Industry Volume (K Unit) Forecast, by Application 2019 & 2032
- Table 89: Global 2.5D & 3D Semiconductor Packaging Industry Revenue Million Forecast, by Country 2019 & 2032
- Table 90: Global 2.5D & 3D Semiconductor Packaging Industry Volume K Unit Forecast, by Country 2019 & 2032
- Table 91: United Arab Emirates 2.5D & 3D Semiconductor Packaging Industry Revenue (Million) Forecast, by Application 2019 & 2032
- Table 92: United Arab Emirates 2.5D & 3D Semiconductor Packaging Industry Volume (K Unit) Forecast, by Application 2019 & 2032
- Table 93: Saudi Arabia 2.5D & 3D Semiconductor Packaging Industry Revenue (Million) Forecast, by Application 2019 & 2032
- Table 94: Saudi Arabia 2.5D & 3D Semiconductor Packaging Industry Volume (K Unit) Forecast, by Application 2019 & 2032
- Table 95: South Africa 2.5D & 3D Semiconductor Packaging Industry Revenue (Million) Forecast, by Application 2019 & 2032
- Table 96: South Africa 2.5D & 3D Semiconductor Packaging Industry Volume (K Unit) Forecast, by Application 2019 & 2032
- Table 97: Rest of Middle East and Africa 2.5D & 3D Semiconductor Packaging Industry Revenue (Million) Forecast, by Application 2019 & 2032
- Table 98: Rest of Middle East and Africa 2.5D & 3D Semiconductor Packaging Industry Volume (K Unit) Forecast, by Application 2019 & 2032
- Table 99: Global 2.5D & 3D Semiconductor Packaging Industry Revenue Million Forecast, by Packaging Technology 2019 & 2032
- Table 100: Global 2.5D & 3D Semiconductor Packaging Industry Volume K Unit Forecast, by Packaging Technology 2019 & 2032
- Table 101: Global 2.5D & 3D Semiconductor Packaging Industry Revenue Million Forecast, by End-user Industry 2019 & 2032
- Table 102: Global 2.5D & 3D Semiconductor Packaging Industry Volume K Unit Forecast, by End-user Industry 2019 & 2032
- Table 103: Global 2.5D & 3D Semiconductor Packaging Industry Revenue Million Forecast, by Country 2019 & 2032
- Table 104: Global 2.5D & 3D Semiconductor Packaging Industry Volume K Unit Forecast, by Country 2019 & 2032
- Table 105: Global 2.5D & 3D Semiconductor Packaging Industry Revenue Million Forecast, by Packaging Technology 2019 & 2032
- Table 106: Global 2.5D & 3D Semiconductor Packaging Industry Volume K Unit Forecast, by Packaging Technology 2019 & 2032
- Table 107: Global 2.5D & 3D Semiconductor Packaging Industry Revenue Million Forecast, by End-user Industry 2019 & 2032
- Table 108: Global 2.5D & 3D Semiconductor Packaging Industry Volume K Unit Forecast, by End-user Industry 2019 & 2032
- Table 109: Global 2.5D & 3D Semiconductor Packaging Industry Revenue Million Forecast, by Country 2019 & 2032
- Table 110: Global 2.5D & 3D Semiconductor Packaging Industry Volume K Unit Forecast, by Country 2019 & 2032
- Table 111: Global 2.5D & 3D Semiconductor Packaging Industry Revenue Million Forecast, by Packaging Technology 2019 & 2032
- Table 112: Global 2.5D & 3D Semiconductor Packaging Industry Volume K Unit Forecast, by Packaging Technology 2019 & 2032
- Table 113: Global 2.5D & 3D Semiconductor Packaging Industry Revenue Million Forecast, by End-user Industry 2019 & 2032
- Table 114: Global 2.5D & 3D Semiconductor Packaging Industry Volume K Unit Forecast, by End-user Industry 2019 & 2032
- Table 115: Global 2.5D & 3D Semiconductor Packaging Industry Revenue Million Forecast, by Country 2019 & 2032
- Table 116: Global 2.5D & 3D Semiconductor Packaging Industry Volume K Unit Forecast, by Country 2019 & 2032
- Table 117: Global 2.5D & 3D Semiconductor Packaging Industry Revenue Million Forecast, by Packaging Technology 2019 & 2032
- Table 118: Global 2.5D & 3D Semiconductor Packaging Industry Volume K Unit Forecast, by Packaging Technology 2019 & 2032
- Table 119: Global 2.5D & 3D Semiconductor Packaging Industry Revenue Million Forecast, by End-user Industry 2019 & 2032
- Table 120: Global 2.5D & 3D Semiconductor Packaging Industry Volume K Unit Forecast, by End-user Industry 2019 & 2032
- Table 121: Global 2.5D & 3D Semiconductor Packaging Industry Revenue Million Forecast, by Country 2019 & 2032
- Table 122: Global 2.5D & 3D Semiconductor Packaging Industry Volume K Unit Forecast, by Country 2019 & 2032
- Table 123: Global 2.5D & 3D Semiconductor Packaging Industry Revenue Million Forecast, by Packaging Technology 2019 & 2032
- Table 124: Global 2.5D & 3D Semiconductor Packaging Industry Volume K Unit Forecast, by Packaging Technology 2019 & 2032
- Table 125: Global 2.5D & 3D Semiconductor Packaging Industry Revenue Million Forecast, by End-user Industry 2019 & 2032
- Table 126: Global 2.5D & 3D Semiconductor Packaging Industry Volume K Unit Forecast, by End-user Industry 2019 & 2032
- Table 127: Global 2.5D & 3D Semiconductor Packaging Industry Revenue Million Forecast, by Country 2019 & 2032
- Table 128: Global 2.5D & 3D Semiconductor Packaging Industry Volume K Unit Forecast, by Country 2019 & 2032
- Table 129: Global 2.5D & 3D Semiconductor Packaging Industry Revenue Million Forecast, by Packaging Technology 2019 & 2032
- Table 130: Global 2.5D & 3D Semiconductor Packaging Industry Volume K Unit Forecast, by Packaging Technology 2019 & 2032
- Table 131: Global 2.5D & 3D Semiconductor Packaging Industry Revenue Million Forecast, by End-user Industry 2019 & 2032
- Table 132: Global 2.5D & 3D Semiconductor Packaging Industry Volume K Unit Forecast, by End-user Industry 2019 & 2032
- Table 133: Global 2.5D & 3D Semiconductor Packaging Industry Revenue Million Forecast, by Country 2019 & 2032
- Table 134: Global 2.5D & 3D Semiconductor Packaging Industry Volume K Unit Forecast, by Country 2019 & 2032
- Table 135: Global 2.5D & 3D Semiconductor Packaging Industry Revenue Million Forecast, by Packaging Technology 2019 & 2032
- Table 136: Global 2.5D & 3D Semiconductor Packaging Industry Volume K Unit Forecast, by Packaging Technology 2019 & 2032
- Table 137: Global 2.5D & 3D Semiconductor Packaging Industry Revenue Million Forecast, by End-user Industry 2019 & 2032
- Table 138: Global 2.5D & 3D Semiconductor Packaging Industry Volume K Unit Forecast, by End-user Industry 2019 & 2032
- Table 139: Global 2.5D & 3D Semiconductor Packaging Industry Revenue Million Forecast, by Country 2019 & 2032
- Table 140: Global 2.5D & 3D Semiconductor Packaging Industry Volume K Unit Forecast, by Country 2019 & 2032
- Table 141: Global 2.5D & 3D Semiconductor Packaging Industry Revenue Million Forecast, by Packaging Technology 2019 & 2032
- Table 142: Global 2.5D & 3D Semiconductor Packaging Industry Volume K Unit Forecast, by Packaging Technology 2019 & 2032
- Table 143: Global 2.5D & 3D Semiconductor Packaging Industry Revenue Million Forecast, by End-user Industry 2019 & 2032
- Table 144: Global 2.5D & 3D Semiconductor Packaging Industry Volume K Unit Forecast, by End-user Industry 2019 & 2032
- Table 145: Global 2.5D & 3D Semiconductor Packaging Industry Revenue Million Forecast, by Country 2019 & 2032
- Table 146: Global 2.5D & 3D Semiconductor Packaging Industry Volume K Unit Forecast, by Country 2019 & 2032
Frequently Asked Questions
1. What is the projected Compound Annual Growth Rate (CAGR) of the 2.5D & 3D Semiconductor Packaging Industry?
The projected CAGR is approximately 17.20%.
2. Which companies are prominent players in the 2.5D & 3D Semiconductor Packaging Industry?
Key companies in the market include Samsung Electronics Co Ltd, ASE Group, TSMC Limited, Jiangsu Changjiang Electronics Technology Co Ltd, Tezzaron Semiconductor Corporation, Powertech Technology Inc, Siliconware Precision Industries Co Ltd (SPIL), Amkor Technology Inc, Intel Corporation, GlobalFoundries Inc.
3. What are the main segments of the 2.5D & 3D Semiconductor Packaging Industry?
The market segments include Packaging Technology, End-user Industry.
4. Can you provide details about the market size?
The market size is estimated to be USD 9.79 Million as of 2022.
5. What are some drivers contributing to market growth?
Growing Consumption of Semiconductor Devices Across Several Industries; Increasing Demand for Compact. High Functionality Electronic Devices.
6. What are the notable trends driving market growth?
Communications and Telecom End-user Industry is Expected to Hold Significant Market Share.
7. Are there any restraints impacting market growth?
High Initial Investment and Increasing Complexity of Semiconductor IC Designs.
8. Can you provide examples of recent developments in the market?
February 2024: Ansys and Intel Foundry partnered to offer Multiphysics signoff solutions for Intel's advanced 2.5D chip assembly technology. This technology utilizes EMIB technology to connect the die flexibly without using through-silicon via (TSVs). Ansys' precise simulation engines provide improved speeds, reduced power consumption, and increased reliability in sophisticated silicon systems for artificial intelligence (AI), high-performance computing, autonomous driving, and graphic processing.
9. What pricing options are available for accessing the report?
Pricing options include single-user, multi-user, and enterprise licenses priced at USD 4750, USD 5250, and USD 8750 respectively.
10. Is the market size provided in terms of value or volume?
The market size is provided in terms of value, measured in Million and volume, measured in K Unit.
11. Are there any specific market keywords associated with the report?
Yes, the market keyword associated with the report is "2.5D & 3D Semiconductor Packaging Industry," which aids in identifying and referencing the specific market segment covered.
12. How do I determine which pricing option suits my needs best?
The pricing options vary based on user requirements and access needs. Individual users may opt for single-user licenses, while businesses requiring broader access may choose multi-user or enterprise licenses for cost-effective access to the report.
13. Are there any additional resources or data provided in the 2.5D & 3D Semiconductor Packaging Industry report?
While the report offers comprehensive insights, it's advisable to review the specific contents or supplementary materials provided to ascertain if additional resources or data are available.
14. How can I stay updated on further developments or reports in the 2.5D & 3D Semiconductor Packaging Industry?
To stay informed about further developments, trends, and reports in the 2.5D & 3D Semiconductor Packaging Industry, consider subscribing to industry newsletters, following relevant companies and organizations, or regularly checking reputable industry news sources and publications.
Methodology
Step 1 - Identification of Relevant Samples Size from Population Database


Step 2 - Approaches for Defining Global Market Size (Value, Volume* & Price*)

Note*: In applicable scenarios
Step 3 - Data Sources
Primary Research
- Web Analytics
- Survey Reports
- Research Institute
- Latest Research Reports
- Opinion Leaders
Secondary Research
- Annual Reports
- White Paper
- Latest Press Release
- Industry Association
- Paid Database
- Investor Presentations

Step 4 - Data Triangulation
Involves using different sources of information in order to increase the validity of a study
These sources are likely to be stakeholders in a program - participants, other researchers, program staff, other community members, and so on.
Then we put all data in single framework & apply various statistical tools to find out the dynamic on the market.
During the analysis stage, feedback from the stakeholder groups would be compared to determine areas of agreement as well as areas of divergence


