

Key Insights
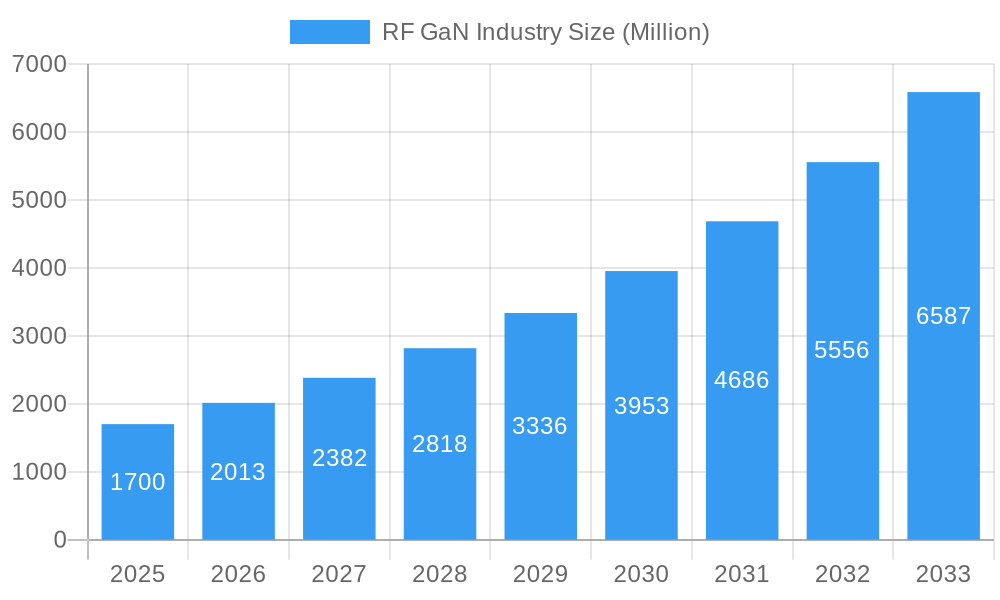
The RF GaN (Gallium Nitride) market is experiencing robust growth, projected to reach a substantial size with a Compound Annual Growth Rate (CAGR) of 18.76% from 2025 to 2033. This expansion is driven by several key factors. The increasing demand for higher power efficiency and improved performance in telecommunications infrastructure, particularly in 5G deployment (including backhaul, RRH, Massive MIMO, and small cells), is a significant catalyst. The burgeoning satellite communication sector, along with advancements in commercial radar and avionics applications, further fuels market growth. The adoption of GaN technology in military applications, known for its superior power density and switching speeds, also contributes significantly to market expansion. The market segmentation reveals a strong preference for GaN-on-Si substrates due to their cost-effectiveness, although GaN-on-SiC and other emerging materials are gaining traction for niche applications requiring enhanced performance characteristics. North America and Asia Pacific currently dominate the market, fueled by substantial investments in telecommunications infrastructure and defense budgets. However, the European and other regional markets are also poised for considerable growth in the coming years as 5G adoption accelerates globally.
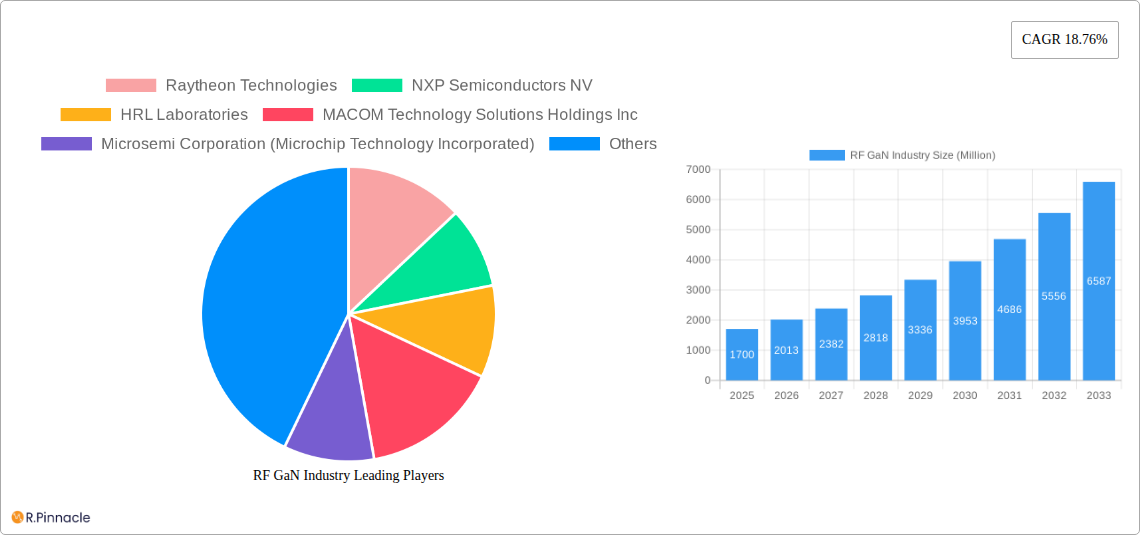
RF GaN Industry Market Size (In Billion)
The competitive landscape is characterized by a mix of established players and emerging companies. Key players like Raytheon Technologies, NXP Semiconductors, and Qorvo are leveraging their expertise in RF technology and manufacturing capabilities to capture significant market share. However, the market also sees growing participation from innovative companies developing specialized GaN solutions for specific applications. The ongoing research and development efforts focused on enhancing GaN material quality, improving manufacturing processes, and exploring new applications are likely to further accelerate market growth. The long-term outlook for the RF GaN market remains highly positive, driven by continuous technological advancements and a growing need for superior RF performance across diverse industries. This growth is expected to continue well into the forecast period (2025-2033).
RF GaN Industry Company Market Share
RF GaN Industry Market Report: 2019-2033
This comprehensive report provides an in-depth analysis of the RF GaN industry, offering valuable insights for industry professionals, investors, and strategists. Covering the period from 2019 to 2033, with a focus on 2025, this report analyzes market trends, key players, and future growth potential. The report projects a xx Million market size by 2033, representing a substantial CAGR of xx%.
RF GaN Industry Market Structure & Innovation Trends
The RF GaN market exhibits a moderately concentrated structure, with key players like Raytheon Technologies, NXP Semiconductors NV, and Qorvo Inc. holding significant market share. However, the presence of several smaller, specialized companies fosters innovation. Market share dynamics are influenced by factors such as R&D investments, product differentiation, and strategic partnerships. The industry is driven by ongoing innovation in GaN technology, focusing on improved efficiency, power density, and cost reduction. Regulatory frameworks, particularly concerning environmental regulations and spectrum allocation, play a significant role. Product substitutes, such as traditional silicon-based RF components, continue to compete, but GaN's superior performance in high-frequency applications is driving its adoption. M&A activity, while not as frequent as in some other semiconductor sectors, remains strategically important, with deal values averaging xx Million in recent years. Examples include collaborations such as the one between MaxLinear Inc. and RFHIC. End-user demographics are largely driven by the growing demand for 5G infrastructure, military applications, and advanced radar systems.
- Market Concentration: Moderately concentrated, with top players holding xx% market share in 2024.
- Innovation Drivers: Improved efficiency, power density, cost reduction.
- Regulatory Frameworks: Impacting environmental compliance and spectrum usage.
- M&A Activity: Average deal value xx Million, with strategic acquisitions shaping market dynamics.
RF GaN Industry Market Dynamics & Trends
The RF GaN market is experiencing robust growth fueled by the increasing demand for high-frequency, high-power applications across various sectors. The proliferation of 5G networks is a major driver, demanding high-efficiency power amplifiers and other components that GaN technology excels at providing. The transition towards smaller cell deployments and the rise of massive MIMO are further fueling growth in the telecom infrastructure segment. Technological disruptions, such as advancements in GaN-on-SiC and GaN-on-Diamond substrates, are continuously improving performance and reducing costs. Consumer preferences towards high-speed data and seamless connectivity are driving the demand for advanced wireless technologies, thereby boosting the demand for RF GaN components. Competitive dynamics are characterized by intense R&D efforts, strategic partnerships, and a focus on product differentiation, resulting in a dynamic and evolving market landscape. The market is expected to achieve a CAGR of xx% during the forecast period (2025-2033), with market penetration increasing in emerging markets.
Dominant Regions & Segments in RF GaN Industry
The North American region currently holds a dominant position in the RF GaN market, driven by strong government investment in defense and aerospace, as well as a robust semiconductor industry. Asia-Pacific is experiencing rapid growth, propelled by expanding 5G infrastructure deployments and a burgeoning electronics manufacturing sector.
- Leading Region: North America, due to strong demand in military and aerospace.
- Fastest Growing Region: Asia-Pacific, fueled by 5G infrastructure expansion.
By Application:
- Military: Strong and steady growth due to ongoing defense spending.
- Telecom Infrastructure: The fastest-growing segment, driven by 5G adoption (Backhaul and Massive MIMO showing particular strength).
- Satellite Communication: Moderate growth, with increasing adoption of GaN in satellite payloads.
- Wired Broadband: Niche application with steady but modest growth.
- Commercial Radar and Avionics: Significant growth driven by increasing demand for advanced radar systems.
- RF Energy: Emerging application with high potential for future growth.
By Material Type:
- GaN-on-Si: Currently the dominant material type due to cost-effectiveness.
- GaN-on-SiC: Growing rapidly due to its superior performance characteristics.
- Other Material Types (GaN-on-GaN, GaN-on-Diamond): Niche applications with potential for future growth.
Key drivers for specific segments include government investments (military), technological advancements (telecom infrastructure), and demand for high-bandwidth communication (satellite communication).
RF GaN Industry Product Innovations
Recent product innovations focus on enhancing power efficiency, improving thermal management, and expanding operating frequencies. These improvements are driven by the demands of advanced 5G networks, high-power radar systems, and defense applications. New GaN-based power amplifiers with higher output power and improved linearity are gaining traction. The market is witnessing a shift towards integrated modules, combining multiple components for improved performance and reduced complexity.
Report Scope & Segmentation Analysis
This report comprehensively analyzes the RF GaN market across various segments: by application (Military, Telecom Infrastructure, Satellite Communication, Wired Broadband, Commercial Radar and Avionics, RF Energy) and by material type (GaN-on-Si, GaN-on-SiC, Other Material Types). Each segment's growth projections, market sizes, and competitive dynamics are examined, providing a granular view of the industry's structure. The historical period covered is 2019–2024, the base year is 2025, and the forecast period extends to 2033.
Key Drivers of RF GaN Industry Growth
The RF GaN industry's growth is fueled by several key factors: the increasing demand for higher-frequency, higher-power applications driven by 5G deployment; technological advancements leading to enhanced performance and reduced costs; and government investments in defense and aerospace sectors. The rising adoption of GaN in commercial radar and avionics is also contributing to market expansion.
Challenges in the RF GaN Industry Sector
Despite the substantial growth potential, the RF GaN industry faces challenges including the high initial cost of GaN devices; supply chain constraints impacting material availability; and the intense competition from established silicon-based technologies. These factors affect market penetration and profitability.
Emerging Opportunities in RF GaN Industry
Emerging opportunities lie in the expansion of 5G infrastructure globally, growth in satellite communication, the development of advanced radar systems, and exploration of new applications in RF energy harvesting. The ongoing miniaturization and integration of GaN devices present further growth prospects.
Leading Players in the RF GaN Industry Market
- Raytheon Technologies
- NXP Semiconductors NV
- HRL Laboratories
- MACOM Technology Solutions Holdings Inc
- Microsemi Corporation (Microchip Technology Incorporated)
- Wolfspeed Inc (Cree Inc)
- Integra Technologies Inc
- Mitsubishi Electric Corporation
- STMicroelectronics NV
- Aethercomm Inc
- Mercury Systems Inc
- Qorvo Inc
- Analog Devices Inc
- Sumitomo Electric Device Innovations Inc
Key Developments in RF GaN Industry Industry
- September 2022: MaxLinear Inc. and RFHIC collaborated on a production-ready 400MHz Power Amplifier solution for 5G Macrocell radios, leveraging MaxLinear's MaxLIN Digital Predistortion technology. This collaboration enhances the efficiency and performance of 5G infrastructure.
- June 2022: Integra announced seven new 100 V RF GaN devices with power levels up to 5 kW, expanding its product portfolio for avionics, directed energy, electronic warfare, and radar applications. This expands Integra's presence in high-power applications.
Future Outlook for RF GaN Industry Market
The RF GaN market is poised for continued strong growth, driven by the ongoing expansion of 5G networks, increasing demand for high-power applications in defense and aerospace, and the emergence of new applications in areas like RF energy. Strategic partnerships, technological innovations, and expansion into new markets will be crucial for continued success in this dynamic sector.
RF GaN Industry Segmentation
-
1. Application
- 1.1. Military
- 1.2. Telecom
- 1.3. Satellite Communication
- 1.4. Wired Broadband
- 1.5. Commercial Radar and Avionics
- 1.6. RF Energy
-
2. Material Type
- 2.1. GaN-on-Si
- 2.2. GaN-on-SiC
- 2.3. Other Material Types (GaN-on-GaN, GaN-on-Diamond)
RF GaN Industry Segmentation By Geography
- 1. North America
- 2. Europe
- 3. Asia Pacific
- 4. Middle East and Africa
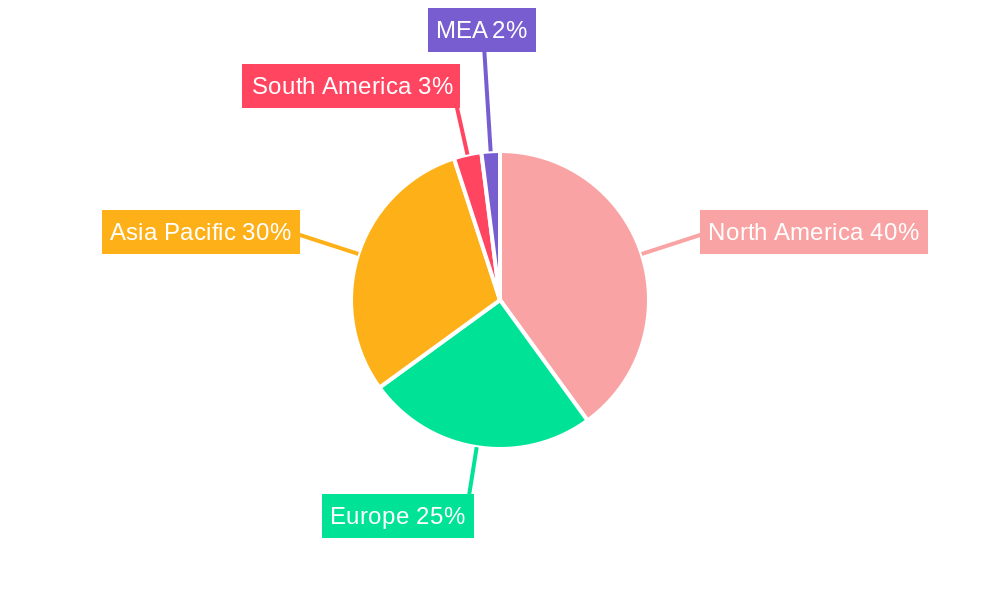
RF GaN Industry Regional Market Share
Geographic Coverage of RF GaN Industry
RF GaN Industry REPORT HIGHLIGHTS
| Aspects | Details |
|---|---|
| Study Period | 2020-2034 |
| Base Year | 2025 |
| Estimated Year | 2026 |
| Forecast Period | 2026-2034 |
| Historical Period | 2020-2025 |
| Growth Rate | CAGR of 18.76% from 2020-2034 |
| Segmentation |
|
Table of Contents
- 1. Introduction
- 1.1. Research Scope
- 1.2. Market Segmentation
- 1.3. Research Objective
- 1.4. Definitions and Assumptions
- 2. Executive Summary
- 2.1. Market Snapshot
- 3. Market Dynamics
- 3.1. Market Drivers
- 3.2. Market Restrains
- 3.3. Market Trends
- 3.4. Market Opportunities
- 4. Market Factor Analysis
- 4.1. Porters Five Forces
- 4.1.1. Bargaining Power of Suppliers
- 4.1.2. Bargaining Power of Buyers
- 4.1.3. Threat of New Entrants
- 4.1.4. Threat of Substitutes
- 4.1.5. Competitive Rivalry
- 4.2. PESTEL analysis
- 4.3. BCG Analysis
- 4.3.1. Stars (High Growth, High Market Share)
- 4.3.2. Cash Cows (Low Growth, High Market Share)
- 4.3.3. Question Mark (High Growth, Low Market Share)
- 4.3.4. Dogs (Low Growth, Low Market Share)
- 4.4. Ansoff Matrix Analysis
- 4.5. Supply Chain Analysis
- 4.6. Regulatory Landscape
- 4.7. Current Market Potential and Opportunity Assessment (TAM–SAM–SOM Framework)
- 4.8. PRI Analyst Note
- 4.1. Porters Five Forces
- 5. Market Analysis, Insights and Forecast 2021-2033
- 5.1. Market Analysis, Insights and Forecast - by Application
- 5.1.1. Military
- 5.1.2. Telecom
- 5.1.3. Satellite Communication
- 5.1.4. Wired Broadband
- 5.1.5. Commercial Radar and Avionics
- 5.1.6. RF Energy
- 5.2. Market Analysis, Insights and Forecast - by Material Type
- 5.2.1. GaN-on-Si
- 5.2.2. GaN-on-SiC
- 5.2.3. Other Material Types (GaN-on-GaN, GaN-on-Diamond)
- 5.3. Market Analysis, Insights and Forecast - by Region
- 5.3.1. North America
- 5.3.2. Europe
- 5.3.3. Asia Pacific
- 5.3.4. Middle East and Africa
- 5.1. Market Analysis, Insights and Forecast - by Application
- 6. Global RF GaN Industry Analysis, Insights and Forecast, 2021-2033
- 6.1. Market Analysis, Insights and Forecast - by Application
- 6.1.1. Military
- 6.1.2. Telecom
- 6.1.3. Satellite Communication
- 6.1.4. Wired Broadband
- 6.1.5. Commercial Radar and Avionics
- 6.1.6. RF Energy
- 6.2. Market Analysis, Insights and Forecast - by Material Type
- 6.2.1. GaN-on-Si
- 6.2.2. GaN-on-SiC
- 6.2.3. Other Material Types (GaN-on-GaN, GaN-on-Diamond)
- 6.1. Market Analysis, Insights and Forecast - by Application
- 7. North America RF GaN Industry Analysis, Insights and Forecast, 2020-2032
- 7.1. Market Analysis, Insights and Forecast - by Application
- 7.1.1. Military
- 7.1.2. Telecom
- 7.1.3. Satellite Communication
- 7.1.4. Wired Broadband
- 7.1.5. Commercial Radar and Avionics
- 7.1.6. RF Energy
- 7.2. Market Analysis, Insights and Forecast - by Material Type
- 7.2.1. GaN-on-Si
- 7.2.2. GaN-on-SiC
- 7.2.3. Other Material Types (GaN-on-GaN, GaN-on-Diamond)
- 7.1. Market Analysis, Insights and Forecast - by Application
- 8. Europe RF GaN Industry Analysis, Insights and Forecast, 2020-2032
- 8.1. Market Analysis, Insights and Forecast - by Application
- 8.1.1. Military
- 8.1.2. Telecom
- 8.1.3. Satellite Communication
- 8.1.4. Wired Broadband
- 8.1.5. Commercial Radar and Avionics
- 8.1.6. RF Energy
- 8.2. Market Analysis, Insights and Forecast - by Material Type
- 8.2.1. GaN-on-Si
- 8.2.2. GaN-on-SiC
- 8.2.3. Other Material Types (GaN-on-GaN, GaN-on-Diamond)
- 8.1. Market Analysis, Insights and Forecast - by Application
- 9. Asia Pacific RF GaN Industry Analysis, Insights and Forecast, 2020-2032
- 9.1. Market Analysis, Insights and Forecast - by Application
- 9.1.1. Military
- 9.1.2. Telecom
- 9.1.3. Satellite Communication
- 9.1.4. Wired Broadband
- 9.1.5. Commercial Radar and Avionics
- 9.1.6. RF Energy
- 9.2. Market Analysis, Insights and Forecast - by Material Type
- 9.2.1. GaN-on-Si
- 9.2.2. GaN-on-SiC
- 9.2.3. Other Material Types (GaN-on-GaN, GaN-on-Diamond)
- 9.1. Market Analysis, Insights and Forecast - by Application
- 10. Middle East and Africa RF GaN Industry Analysis, Insights and Forecast, 2020-2032
- 10.1. Market Analysis, Insights and Forecast - by Application
- 10.1.1. Military
- 10.1.2. Telecom
- 10.1.3. Satellite Communication
- 10.1.4. Wired Broadband
- 10.1.5. Commercial Radar and Avionics
- 10.1.6. RF Energy
- 10.2. Market Analysis, Insights and Forecast - by Material Type
- 10.2.1. GaN-on-Si
- 10.2.2. GaN-on-SiC
- 10.2.3. Other Material Types (GaN-on-GaN, GaN-on-Diamond)
- 10.1. Market Analysis, Insights and Forecast - by Application
- 11. Competitive Analysis
- 11.1. Company Profiles
- 11.1.1 Raytheon Technologies
- 11.1.1.1. Company Overview
- 11.1.1.2. Products
- 11.1.1.3. Company Financials
- 11.1.1.4. SWOT Analysis
- 11.1.2 NXP Semiconductors NV
- 11.1.2.1. Company Overview
- 11.1.2.2. Products
- 11.1.2.3. Company Financials
- 11.1.2.4. SWOT Analysis
- 11.1.3 HRL Laboratories
- 11.1.3.1. Company Overview
- 11.1.3.2. Products
- 11.1.3.3. Company Financials
- 11.1.3.4. SWOT Analysis
- 11.1.4 MACOM Technology Solutions Holdings Inc
- 11.1.4.1. Company Overview
- 11.1.4.2. Products
- 11.1.4.3. Company Financials
- 11.1.4.4. SWOT Analysis
- 11.1.5 Microsemi Corporation (Microchip Technology Incorporated)
- 11.1.5.1. Company Overview
- 11.1.5.2. Products
- 11.1.5.3. Company Financials
- 11.1.5.4. SWOT Analysis
- 11.1.6 Wolfspeed Inc (Cree Inc )
- 11.1.6.1. Company Overview
- 11.1.6.2. Products
- 11.1.6.3. Company Financials
- 11.1.6.4. SWOT Analysis
- 11.1.7 Integra Technologies Inc
- 11.1.7.1. Company Overview
- 11.1.7.2. Products
- 11.1.7.3. Company Financials
- 11.1.7.4. SWOT Analysis
- 11.1.8 Mitsubishi Electric Corporation
- 11.1.8.1. Company Overview
- 11.1.8.2. Products
- 11.1.8.3. Company Financials
- 11.1.8.4. SWOT Analysis
- 11.1.9 STMicroelectronics NV
- 11.1.9.1. Company Overview
- 11.1.9.2. Products
- 11.1.9.3. Company Financials
- 11.1.9.4. SWOT Analysis
- 11.1.10 Aethercomm Inc
- 11.1.10.1. Company Overview
- 11.1.10.2. Products
- 11.1.10.3. Company Financials
- 11.1.10.4. SWOT Analysis
- 11.1.11 Mercury Systems Inc
- 11.1.11.1. Company Overview
- 11.1.11.2. Products
- 11.1.11.3. Company Financials
- 11.1.11.4. SWOT Analysis
- 11.1.12 Qorvo Inc
- 11.1.12.1. Company Overview
- 11.1.12.2. Products
- 11.1.12.3. Company Financials
- 11.1.12.4. SWOT Analysis
- 11.1.13 Analog Devices Inc
- 11.1.13.1. Company Overview
- 11.1.13.2. Products
- 11.1.13.3. Company Financials
- 11.1.13.4. SWOT Analysis
- 11.1.14 Sumitomo Electric Device Innovations Inc
- 11.1.14.1. Company Overview
- 11.1.14.2. Products
- 11.1.14.3. Company Financials
- 11.1.14.4. SWOT Analysis
- 11.1.1 Raytheon Technologies
- 11.2. Market Entropy
- 11.2.1 Company's Key Areas Served
- 11.2.2 Recent Developments
- 11.3. Company Market Share Analysis 2025
- 11.3.1 Top 5 Companies Market Share Analysis
- 11.3.2 Top 3 Companies Market Share Analysis
- 11.4. List of Potential Customers
- 12. Research Methodology
List of Figures
- Figure 1: Global RF GaN Industry Revenue Breakdown (Million, %) by Region 2025 & 2033
- Figure 2: Global RF GaN Industry Volume Breakdown (K Unit, %) by Region 2025 & 2033
- Figure 3: North America RF GaN Industry Revenue (Million), by Application 2025 & 2033
- Figure 4: North America RF GaN Industry Volume (K Unit), by Application 2025 & 2033
- Figure 5: North America RF GaN Industry Revenue Share (%), by Application 2025 & 2033
- Figure 6: North America RF GaN Industry Volume Share (%), by Application 2025 & 2033
- Figure 7: North America RF GaN Industry Revenue (Million), by Material Type 2025 & 2033
- Figure 8: North America RF GaN Industry Volume (K Unit), by Material Type 2025 & 2033
- Figure 9: North America RF GaN Industry Revenue Share (%), by Material Type 2025 & 2033
- Figure 10: North America RF GaN Industry Volume Share (%), by Material Type 2025 & 2033
- Figure 11: North America RF GaN Industry Revenue (Million), by Country 2025 & 2033
- Figure 12: North America RF GaN Industry Volume (K Unit), by Country 2025 & 2033
- Figure 13: North America RF GaN Industry Revenue Share (%), by Country 2025 & 2033
- Figure 14: North America RF GaN Industry Volume Share (%), by Country 2025 & 2033
- Figure 15: Europe RF GaN Industry Revenue (Million), by Application 2025 & 2033
- Figure 16: Europe RF GaN Industry Volume (K Unit), by Application 2025 & 2033
- Figure 17: Europe RF GaN Industry Revenue Share (%), by Application 2025 & 2033
- Figure 18: Europe RF GaN Industry Volume Share (%), by Application 2025 & 2033
- Figure 19: Europe RF GaN Industry Revenue (Million), by Material Type 2025 & 2033
- Figure 20: Europe RF GaN Industry Volume (K Unit), by Material Type 2025 & 2033
- Figure 21: Europe RF GaN Industry Revenue Share (%), by Material Type 2025 & 2033
- Figure 22: Europe RF GaN Industry Volume Share (%), by Material Type 2025 & 2033
- Figure 23: Europe RF GaN Industry Revenue (Million), by Country 2025 & 2033
- Figure 24: Europe RF GaN Industry Volume (K Unit), by Country 2025 & 2033
- Figure 25: Europe RF GaN Industry Revenue Share (%), by Country 2025 & 2033
- Figure 26: Europe RF GaN Industry Volume Share (%), by Country 2025 & 2033
- Figure 27: Asia Pacific RF GaN Industry Revenue (Million), by Application 2025 & 2033
- Figure 28: Asia Pacific RF GaN Industry Volume (K Unit), by Application 2025 & 2033
- Figure 29: Asia Pacific RF GaN Industry Revenue Share (%), by Application 2025 & 2033
- Figure 30: Asia Pacific RF GaN Industry Volume Share (%), by Application 2025 & 2033
- Figure 31: Asia Pacific RF GaN Industry Revenue (Million), by Material Type 2025 & 2033
- Figure 32: Asia Pacific RF GaN Industry Volume (K Unit), by Material Type 2025 & 2033
- Figure 33: Asia Pacific RF GaN Industry Revenue Share (%), by Material Type 2025 & 2033
- Figure 34: Asia Pacific RF GaN Industry Volume Share (%), by Material Type 2025 & 2033
- Figure 35: Asia Pacific RF GaN Industry Revenue (Million), by Country 2025 & 2033
- Figure 36: Asia Pacific RF GaN Industry Volume (K Unit), by Country 2025 & 2033
- Figure 37: Asia Pacific RF GaN Industry Revenue Share (%), by Country 2025 & 2033
- Figure 38: Asia Pacific RF GaN Industry Volume Share (%), by Country 2025 & 2033
- Figure 39: Middle East and Africa RF GaN Industry Revenue (Million), by Application 2025 & 2033
- Figure 40: Middle East and Africa RF GaN Industry Volume (K Unit), by Application 2025 & 2033
- Figure 41: Middle East and Africa RF GaN Industry Revenue Share (%), by Application 2025 & 2033
- Figure 42: Middle East and Africa RF GaN Industry Volume Share (%), by Application 2025 & 2033
- Figure 43: Middle East and Africa RF GaN Industry Revenue (Million), by Material Type 2025 & 2033
- Figure 44: Middle East and Africa RF GaN Industry Volume (K Unit), by Material Type 2025 & 2033
- Figure 45: Middle East and Africa RF GaN Industry Revenue Share (%), by Material Type 2025 & 2033
- Figure 46: Middle East and Africa RF GaN Industry Volume Share (%), by Material Type 2025 & 2033
- Figure 47: Middle East and Africa RF GaN Industry Revenue (Million), by Country 2025 & 2033
- Figure 48: Middle East and Africa RF GaN Industry Volume (K Unit), by Country 2025 & 2033
- Figure 49: Middle East and Africa RF GaN Industry Revenue Share (%), by Country 2025 & 2033
- Figure 50: Middle East and Africa RF GaN Industry Volume Share (%), by Country 2025 & 2033
List of Tables
- Table 1: Global RF GaN Industry Revenue Million Forecast, by Application 2020 & 2033
- Table 2: Global RF GaN Industry Volume K Unit Forecast, by Application 2020 & 2033
- Table 3: Global RF GaN Industry Revenue Million Forecast, by Material Type 2020 & 2033
- Table 4: Global RF GaN Industry Volume K Unit Forecast, by Material Type 2020 & 2033
- Table 5: Global RF GaN Industry Revenue Million Forecast, by Region 2020 & 2033
- Table 6: Global RF GaN Industry Volume K Unit Forecast, by Region 2020 & 2033
- Table 7: Global RF GaN Industry Revenue Million Forecast, by Application 2020 & 2033
- Table 8: Global RF GaN Industry Volume K Unit Forecast, by Application 2020 & 2033
- Table 9: Global RF GaN Industry Revenue Million Forecast, by Material Type 2020 & 2033
- Table 10: Global RF GaN Industry Volume K Unit Forecast, by Material Type 2020 & 2033
- Table 11: Global RF GaN Industry Revenue Million Forecast, by Country 2020 & 2033
- Table 12: Global RF GaN Industry Volume K Unit Forecast, by Country 2020 & 2033
- Table 13: Global RF GaN Industry Revenue Million Forecast, by Application 2020 & 2033
- Table 14: Global RF GaN Industry Volume K Unit Forecast, by Application 2020 & 2033
- Table 15: Global RF GaN Industry Revenue Million Forecast, by Material Type 2020 & 2033
- Table 16: Global RF GaN Industry Volume K Unit Forecast, by Material Type 2020 & 2033
- Table 17: Global RF GaN Industry Revenue Million Forecast, by Country 2020 & 2033
- Table 18: Global RF GaN Industry Volume K Unit Forecast, by Country 2020 & 2033
- Table 19: Global RF GaN Industry Revenue Million Forecast, by Application 2020 & 2033
- Table 20: Global RF GaN Industry Volume K Unit Forecast, by Application 2020 & 2033
- Table 21: Global RF GaN Industry Revenue Million Forecast, by Material Type 2020 & 2033
- Table 22: Global RF GaN Industry Volume K Unit Forecast, by Material Type 2020 & 2033
- Table 23: Global RF GaN Industry Revenue Million Forecast, by Country 2020 & 2033
- Table 24: Global RF GaN Industry Volume K Unit Forecast, by Country 2020 & 2033
- Table 25: Global RF GaN Industry Revenue Million Forecast, by Application 2020 & 2033
- Table 26: Global RF GaN Industry Volume K Unit Forecast, by Application 2020 & 2033
- Table 27: Global RF GaN Industry Revenue Million Forecast, by Material Type 2020 & 2033
- Table 28: Global RF GaN Industry Volume K Unit Forecast, by Material Type 2020 & 2033
- Table 29: Global RF GaN Industry Revenue Million Forecast, by Country 2020 & 2033
- Table 30: Global RF GaN Industry Volume K Unit Forecast, by Country 2020 & 2033
Frequently Asked Questions
1. What is the projected Compound Annual Growth Rate (CAGR) of the RF GaN Industry?
The projected CAGR is approximately 18.76%.
2. Which companies are prominent players in the RF GaN Industry?
Key companies in the market include Raytheon Technologies, NXP Semiconductors NV, HRL Laboratories, MACOM Technology Solutions Holdings Inc, Microsemi Corporation (Microchip Technology Incorporated), Wolfspeed Inc (Cree Inc ), Integra Technologies Inc, Mitsubishi Electric Corporation, STMicroelectronics NV, Aethercomm Inc, Mercury Systems Inc, Qorvo Inc, Analog Devices Inc, Sumitomo Electric Device Innovations Inc.
3. What are the main segments of the RF GaN Industry?
The market segments include Application, Material Type.
4. Can you provide details about the market size?
The market size is estimated to be USD 1.70 Million as of 2022.
5. What are some drivers contributing to market growth?
Strong Demand from Telecom Infrastructure Segment Driven by Advancements in 5G Implementation; Favorable Attributes Such As High-performance and Small Form Factor to.
6. What are the notable trends driving market growth?
Strong Demand from Telecom Infrastructure Segment Driven by Advancements in 5G Implementation.
7. Are there any restraints impacting market growth?
Cost & Operational Challenges.
8. Can you provide examples of recent developments in the market?
September 2022: MaxLinear Inc. and RFHIC announced a collaboration to deliver a production-ready 400MHz Power Amplifier solution for 5G Macrocell radios, utilizing MaxLinear MaxLIN Digital Predistortion and Crest Factor Reduction technologies to optimize the performance of RFHIC's latest ID-400W series GaN RF Transistors. Combining RFHIC's dual-reverse GaN RF transistor ID41411DR with MaxLIN DPD and making it available as a pre-verified solution would allow Radio Access Network (RAN) product developers to quickly deliver ultra-wideband 400MHz Macro PAs for all global 5G mid-band deployments with high power efficiency and low emissions.
9. What pricing options are available for accessing the report?
Pricing options include single-user, multi-user, and enterprise licenses priced at USD 4750, USD 5250, and USD 8750 respectively.
10. Is the market size provided in terms of value or volume?
The market size is provided in terms of value, measured in Million and volume, measured in K Unit.
11. Are there any specific market keywords associated with the report?
Yes, the market keyword associated with the report is "RF GaN Industry," which aids in identifying and referencing the specific market segment covered.
12. How do I determine which pricing option suits my needs best?
The pricing options vary based on user requirements and access needs. Individual users may opt for single-user licenses, while businesses requiring broader access may choose multi-user or enterprise licenses for cost-effective access to the report.
13. Are there any additional resources or data provided in the RF GaN Industry report?
While the report offers comprehensive insights, it's advisable to review the specific contents or supplementary materials provided to ascertain if additional resources or data are available.
14. How can I stay updated on further developments or reports in the RF GaN Industry?
To stay informed about further developments, trends, and reports in the RF GaN Industry, consider subscribing to industry newsletters, following relevant companies and organizations, or regularly checking reputable industry news sources and publications.
Methodology
Step 1 - Identification of Relevant Samples Size from Population Database


Step 2 - Approaches for Defining Global Market Size (Value, Volume* & Price*)

Note*: In applicable scenarios
Step 3 - Data Sources
Primary Research
- Web Analytics
- Survey Reports
- Research Institute
- Latest Research Reports
- Opinion Leaders
Secondary Research
- Annual Reports
- White Paper
- Latest Press Release
- Industry Association
- Paid Database
- Investor Presentations

Step 4 - Data Triangulation
Involves using different sources of information in order to increase the validity of a study
These sources are likely to be stakeholders in a program - participants, other researchers, program staff, other community members, and so on.
Then we put all data in single framework & apply various statistical tools to find out the dynamic on the market.
During the analysis stage, feedback from the stakeholder groups would be compared to determine areas of agreement as well as areas of divergence