

Key Insights
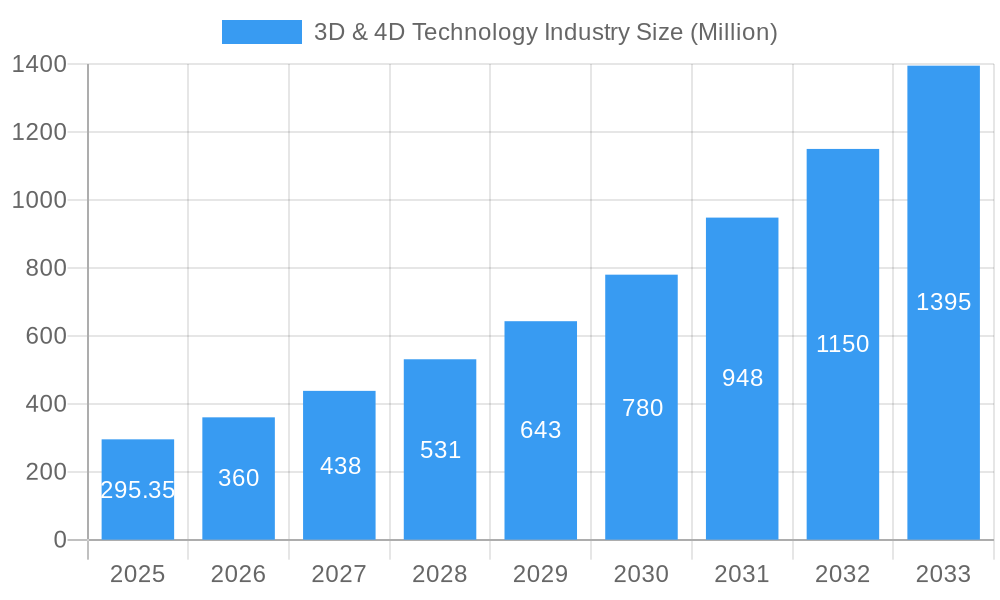
The 3D & 4D technology market is experiencing robust growth, projected to reach a substantial market size. The Compound Annual Growth Rate (CAGR) of 21.82% from 2019 to 2024 signifies significant investor interest and widespread adoption across diverse sectors. Key drivers include advancements in sensor technology, miniaturization of integrated circuits, and increasing demand for immersive experiences in gaming and entertainment. The healthcare industry is a major beneficiary, leveraging 3D printing for personalized prosthetics and surgical planning, while the entertainment and media sectors utilize 3D and 4D technologies for enhanced cinematic experiences and interactive gaming. However, high initial investment costs for advanced equipment and the need for specialized skills can act as restraints to broader market penetration, particularly in developing economies. Segmentation reveals a strong contribution from 3D sensors and integrated circuits, indicating a technology-driven market landscape. Leading companies like LG Electronics, Samsung, and Intel are strategically positioning themselves to capitalize on this expansion, driving innovation and competitive pricing. The Asia-Pacific region, fueled by increasing technological adoption and a growing consumer base, is expected to be a key growth engine in the coming years, followed closely by North America. Further analysis suggests that the market will continue its trajectory of expansion, driven by ongoing technological breakthroughs and increased integration across various sectors. Market diversification strategies and partnerships are crucial for companies to maintain competitiveness and explore untapped growth opportunities.
3D & 4D Technology Industry Market Size (In Million)
The forecast period (2025-2033) anticipates sustained growth, driven by several factors. The continued miniaturization of 3D components will lead to cost reductions and wider accessibility. Furthermore, emerging applications in fields like automotive design, architectural visualization, and advanced manufacturing will create new market segments. The integration of Artificial Intelligence (AI) and machine learning with 3D and 4D technologies will also propel innovation and market expansion. However, potential regulatory hurdles and data privacy concerns related to the increasing use of 3D scanning and biometric technologies need to be carefully navigated. Companies must prioritize cybersecurity measures and transparent data handling practices to maintain user trust and build confidence in this rapidly evolving market.
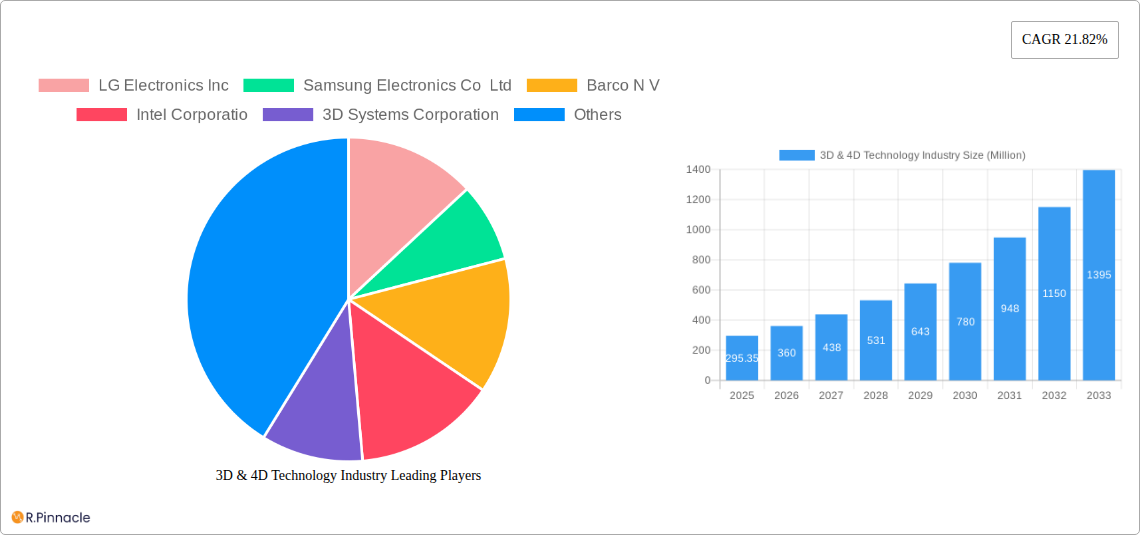
3D & 4D Technology Industry Company Market Share
3D & 4D Technology Industry Market Report: 2019-2033
This comprehensive report provides a detailed analysis of the 3D & 4D technology industry, projecting a market valued at $XX Million by 2033. It covers market structure, innovation trends, dynamics, dominant regions and segments, product innovations, key players, and future outlook. This in-depth analysis is crucial for industry professionals, investors, and strategists seeking to navigate this rapidly evolving landscape. The report leverages data from the historical period (2019-2024), base year (2025), and estimated year (2025) to forecast market trends from 2025-2033.
3D & 4D Technology Industry Market Structure & Innovation Trends
The 3D & 4D technology market exhibits a moderately concentrated structure, with key players like LG Electronics Inc, Samsung Electronics Co Ltd, Barco N V, Intel Corporation, 3D Systems Corporation, Autodesk Inc, Stratus's Inc, Dolby Laboratories Inc, Panasonic Corporation, and Sony Corporation holding significant market share. However, the market is also characterized by the presence of numerous smaller players, particularly in niche segments. Innovation is driven by advancements in materials science, computing power, and software algorithms. Regulatory frameworks, varying across geographical regions, play a significant role, impacting market access and product development. The industry witnesses continuous M&A activity, with deal values in the range of $XX Million annually in recent years, shaping market consolidation and technological integration. Product substitutes, including traditional manufacturing methods, pose ongoing competitive pressure. The end-user demographic is increasingly diverse, spanning healthcare, entertainment, education, and manufacturing, among others.
- Market Share (2024 Estimate): LG Electronics Inc (XX%), Samsung Electronics Co Ltd (XX%), Barco N V (XX%), Others (XX%)
- Average M&A Deal Value (2019-2024): $XX Million
- Key Innovation Drivers: Advancements in AI, improved sensor technology, miniaturization of components.
3D & 4D Technology Industry Market Dynamics & Trends
The 3D & 4D technology market is experiencing robust growth, driven by increasing demand across diverse sectors. The Compound Annual Growth Rate (CAGR) is projected at XX% from 2025 to 2033. Technological disruptions, such as the rise of artificial intelligence (AI) and machine learning (ML) in 3D modeling and printing, are reshaping the industry landscape. Consumer preferences are shifting towards personalized and customized products, fueling the demand for 3D printing and related services. Intense competitive dynamics are leading to product innovation, strategic partnerships, and pricing pressures. Market penetration is steadily increasing across various end-user industries, with significant potential for growth in emerging economies. Specific growth drivers include the increasing adoption of 3D printing in manufacturing, the rise of immersive gaming experiences, and the growing demand for personalized healthcare solutions.
Dominant Regions & Segments in 3D & 4D Technology Industry
North America currently holds the leading position in the 3D & 4D technology market, driven by robust technological advancements, strong R&D investments, and a large base of technology adopters. However, Asia-Pacific is poised for significant growth, fueled by increasing industrialization and government support for technological development.
Dominant Product Segment: 3D Printers (XX% market share in 2024)
Key Drivers in North America: Strong R&D infrastructure, early adoption of new technologies.
Key Drivers in Asia-Pacific: Rapid industrialization, government initiatives promoting technological advancements.
Dominant End-User Industry: Healthcare (XX% market share in 2024) due to growing demand for personalized medical devices and prosthetics.
3D Sensors: Key applications are expanding in automotive and robotics.
3D Integrated Circuits: Driving miniaturization and performance in electronics.
3D Transistors: Essential for higher density and improved efficiency in semiconductor chips.
3D Printer: Growth is driven by advancements in materials and applications across various industries.
3D Gaming: Continuous innovation in game development and hardware is boosting market growth.
Other Products: This segment is expanding with new applications emerging in areas like construction and aerospace.
3D & 4D Technology Industry Product Innovations
Recent advancements in 3D & 4D printing technologies have led to the development of new materials with enhanced properties, improved printing speeds and resolutions, and wider applications across multiple sectors. Integration of AI and ML is enhancing design automation, material selection, and quality control. The market is witnessing a growing trend towards multi-material printing, enabling the creation of highly complex and functional objects. These technological trends are improving product designs and expanding the market's applicability.
Report Scope & Segmentation Analysis
This report segments the 3D & 4D technology market by product type (3D Sensors, 3D Integrated Circuits, 3D Transistors, 3D Printer, 3D Gaming, Other Products) and end-user industry (Healthcare, Entertainment & Media, Education, Other End-user Industries). Each segment's growth is projected based on historical data, current trends, and future predictions. Competitive dynamics within each segment are analyzed, considering factors like market share, innovation capabilities, and strategic partnerships.
Key Drivers of 3D & 4D Technology Industry Growth
The growth of the 3D & 4D technology industry is propelled by several factors: increasing demand for customized products, advancements in materials science and additive manufacturing, rising adoption in healthcare and manufacturing, government initiatives promoting technological innovation, and the development of new applications across diverse sectors. The decreasing cost of 3D printers is also making the technology more accessible to a wider range of users.
Challenges in the 3D & 4D Technology Industry Sector
The 3D & 4D technology industry faces challenges such as the high initial investment costs of equipment, limited availability of skilled labor, stringent regulatory requirements in certain sectors, potential supply chain disruptions, and intense competition among established players and emerging startups. These factors can impact market growth and profitability. The industry also faces challenges in achieving widespread standardization across different platforms and technologies.
Emerging Opportunities in 3D & 4D Technology Industry
Emerging opportunities lie in the development of bioprinting technologies for regenerative medicine, personalized medicine applications, the creation of smart materials with embedded sensors, the integration of 3D printing with IoT (Internet of Things) devices, and expansion into new markets such as construction, aerospace, and consumer electronics. The integration of AI and machine learning in design and manufacturing processes presents significant growth potential.
Leading Players in the 3D & 4D Technology Industry Market
Key Developments in 3D & 4D Technology Industry Industry
- June 2023: Epic Games and LVMH partnered to create immersive product experiences, including virtual fitting rooms and augmented reality applications, impacting the retail and fashion sectors.
- May 2023: Formlabs and Hawk Ridge Systems' partnership expanded access to digital manufacturing technologies in North America, accelerating product development cycles and boosting in-house 3D printing adoption.
Future Outlook for 3D & 4D Technology Industry Market
The future of the 3D & 4D technology market appears bright, driven by continuous technological innovation, expanding applications across various industries, and increasing investments in R&D. Strategic partnerships, mergers, and acquisitions will continue to shape the market landscape. The convergence of 3D printing with other technologies like AI, IoT, and nanotechnology will unlock new possibilities and accelerate market growth. The industry is poised for significant expansion across diverse sectors, creating opportunities for both established players and new entrants.
3D & 4D Technology Industry Segmentation
-
1. Products
- 1.1. 3D Sensors
- 1.2. 3D Integrated Circuits
- 1.3. 3D Transistors
- 1.4. 3D Printer
- 1.5. 3D Gaming
- 1.6. Other Products
-
2. End-User Industry
- 2.1. Healthcare
- 2.2. Entertainment & Media
- 2.3. Education
- 2.4. Other End-user Industries
3D & 4D Technology Industry Segmentation By Geography
- 1. North America
- 2. Europe
- 3. Asia
- 4. Australia and New Zealand
- 5. Latin America
- 6. Middle East and Africa
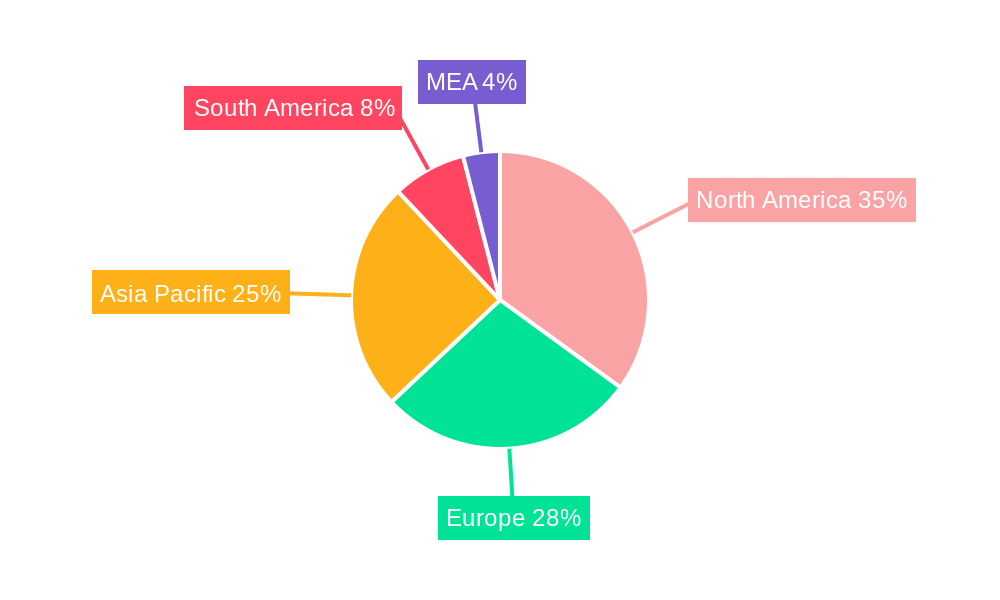
3D & 4D Technology Industry Regional Market Share
Geographic Coverage of 3D & 4D Technology Industry
3D & 4D Technology Industry REPORT HIGHLIGHTS
| Aspects | Details |
|---|---|
| Study Period | 2020-2034 |
| Base Year | 2025 |
| Estimated Year | 2026 |
| Forecast Period | 2026-2034 |
| Historical Period | 2020-2025 |
| Growth Rate | CAGR of 21.82% from 2020-2034 |
| Segmentation |
|
Table of Contents
- 1. Introduction
- 1.1. Research Scope
- 1.2. Market Segmentation
- 1.3. Research Objective
- 1.4. Definitions and Assumptions
- 2. Executive Summary
- 2.1. Market Snapshot
- 3. Market Dynamics
- 3.1. Market Drivers
- 3.2. Market Restrains
- 3.3. Market Trends
- 3.4. Market Opportunities
- 4. Market Factor Analysis
- 4.1. Porters Five Forces
- 4.1.1. Bargaining Power of Suppliers
- 4.1.2. Bargaining Power of Buyers
- 4.1.3. Threat of New Entrants
- 4.1.4. Threat of Substitutes
- 4.1.5. Competitive Rivalry
- 4.2. PESTEL analysis
- 4.3. BCG Analysis
- 4.3.1. Stars (High Growth, High Market Share)
- 4.3.2. Cash Cows (Low Growth, High Market Share)
- 4.3.3. Question Mark (High Growth, Low Market Share)
- 4.3.4. Dogs (Low Growth, Low Market Share)
- 4.4. Ansoff Matrix Analysis
- 4.5. Supply Chain Analysis
- 4.6. Regulatory Landscape
- 4.7. Current Market Potential and Opportunity Assessment (TAM–SAM–SOM Framework)
- 4.8. PRI Analyst Note
- 4.1. Porters Five Forces
- 5. Market Analysis, Insights and Forecast 2021-2033
- 5.1. Market Analysis, Insights and Forecast - by Products
- 5.1.1. 3D Sensors
- 5.1.2. 3D Integrated Circuits
- 5.1.3. 3D Transistors
- 5.1.4. 3D Printer
- 5.1.5. 3D Gaming
- 5.1.6. Other Products
- 5.2. Market Analysis, Insights and Forecast - by End-User Industry
- 5.2.1. Healthcare
- 5.2.2. Entertainment & Media
- 5.2.3. Education
- 5.2.4. Other End-user Industries
- 5.3. Market Analysis, Insights and Forecast - by Region
- 5.3.1. North America
- 5.3.2. Europe
- 5.3.3. Asia
- 5.3.4. Australia and New Zealand
- 5.3.5. Latin America
- 5.3.6. Middle East and Africa
- 5.1. Market Analysis, Insights and Forecast - by Products
- 6. Global 3D & 4D Technology Industry Analysis, Insights and Forecast, 2021-2033
- 6.1. Market Analysis, Insights and Forecast - by Products
- 6.1.1. 3D Sensors
- 6.1.2. 3D Integrated Circuits
- 6.1.3. 3D Transistors
- 6.1.4. 3D Printer
- 6.1.5. 3D Gaming
- 6.1.6. Other Products
- 6.2. Market Analysis, Insights and Forecast - by End-User Industry
- 6.2.1. Healthcare
- 6.2.2. Entertainment & Media
- 6.2.3. Education
- 6.2.4. Other End-user Industries
- 6.1. Market Analysis, Insights and Forecast - by Products
- 7. North America 3D & 4D Technology Industry Analysis, Insights and Forecast, 2020-2032
- 7.1. Market Analysis, Insights and Forecast - by Products
- 7.1.1. 3D Sensors
- 7.1.2. 3D Integrated Circuits
- 7.1.3. 3D Transistors
- 7.1.4. 3D Printer
- 7.1.5. 3D Gaming
- 7.1.6. Other Products
- 7.2. Market Analysis, Insights and Forecast - by End-User Industry
- 7.2.1. Healthcare
- 7.2.2. Entertainment & Media
- 7.2.3. Education
- 7.2.4. Other End-user Industries
- 7.1. Market Analysis, Insights and Forecast - by Products
- 8. Europe 3D & 4D Technology Industry Analysis, Insights and Forecast, 2020-2032
- 8.1. Market Analysis, Insights and Forecast - by Products
- 8.1.1. 3D Sensors
- 8.1.2. 3D Integrated Circuits
- 8.1.3. 3D Transistors
- 8.1.4. 3D Printer
- 8.1.5. 3D Gaming
- 8.1.6. Other Products
- 8.2. Market Analysis, Insights and Forecast - by End-User Industry
- 8.2.1. Healthcare
- 8.2.2. Entertainment & Media
- 8.2.3. Education
- 8.2.4. Other End-user Industries
- 8.1. Market Analysis, Insights and Forecast - by Products
- 9. Asia 3D & 4D Technology Industry Analysis, Insights and Forecast, 2020-2032
- 9.1. Market Analysis, Insights and Forecast - by Products
- 9.1.1. 3D Sensors
- 9.1.2. 3D Integrated Circuits
- 9.1.3. 3D Transistors
- 9.1.4. 3D Printer
- 9.1.5. 3D Gaming
- 9.1.6. Other Products
- 9.2. Market Analysis, Insights and Forecast - by End-User Industry
- 9.2.1. Healthcare
- 9.2.2. Entertainment & Media
- 9.2.3. Education
- 9.2.4. Other End-user Industries
- 9.1. Market Analysis, Insights and Forecast - by Products
- 10. Australia and New Zealand 3D & 4D Technology Industry Analysis, Insights and Forecast, 2020-2032
- 10.1. Market Analysis, Insights and Forecast - by Products
- 10.1.1. 3D Sensors
- 10.1.2. 3D Integrated Circuits
- 10.1.3. 3D Transistors
- 10.1.4. 3D Printer
- 10.1.5. 3D Gaming
- 10.1.6. Other Products
- 10.2. Market Analysis, Insights and Forecast - by End-User Industry
- 10.2.1. Healthcare
- 10.2.2. Entertainment & Media
- 10.2.3. Education
- 10.2.4. Other End-user Industries
- 10.1. Market Analysis, Insights and Forecast - by Products
- 11. Latin America 3D & 4D Technology Industry Analysis, Insights and Forecast, 2020-2032
- 11.1. Market Analysis, Insights and Forecast - by Products
- 11.1.1. 3D Sensors
- 11.1.2. 3D Integrated Circuits
- 11.1.3. 3D Transistors
- 11.1.4. 3D Printer
- 11.1.5. 3D Gaming
- 11.1.6. Other Products
- 11.2. Market Analysis, Insights and Forecast - by End-User Industry
- 11.2.1. Healthcare
- 11.2.2. Entertainment & Media
- 11.2.3. Education
- 11.2.4. Other End-user Industries
- 11.1. Market Analysis, Insights and Forecast - by Products
- 12. Middle East and Africa 3D & 4D Technology Industry Analysis, Insights and Forecast, 2020-2032
- 12.1. Market Analysis, Insights and Forecast - by Products
- 12.1.1. 3D Sensors
- 12.1.2. 3D Integrated Circuits
- 12.1.3. 3D Transistors
- 12.1.4. 3D Printer
- 12.1.5. 3D Gaming
- 12.1.6. Other Products
- 12.2. Market Analysis, Insights and Forecast - by End-User Industry
- 12.2.1. Healthcare
- 12.2.2. Entertainment & Media
- 12.2.3. Education
- 12.2.4. Other End-user Industries
- 12.1. Market Analysis, Insights and Forecast - by Products
- 13. Competitive Analysis
- 13.1. Company Profiles
- 13.1.1 LG Electronics Inc
- 13.1.1.1. Company Overview
- 13.1.1.2. Products
- 13.1.1.3. Company Financials
- 13.1.1.4. SWOT Analysis
- 13.1.2 Samsung Electronics Co Ltd
- 13.1.2.1. Company Overview
- 13.1.2.2. Products
- 13.1.2.3. Company Financials
- 13.1.2.4. SWOT Analysis
- 13.1.3 Barco N V
- 13.1.3.1. Company Overview
- 13.1.3.2. Products
- 13.1.3.3. Company Financials
- 13.1.3.4. SWOT Analysis
- 13.1.4 Intel Corporatio
- 13.1.4.1. Company Overview
- 13.1.4.2. Products
- 13.1.4.3. Company Financials
- 13.1.4.4. SWOT Analysis
- 13.1.5 3D Systems Corporation
- 13.1.5.1. Company Overview
- 13.1.5.2. Products
- 13.1.5.3. Company Financials
- 13.1.5.4. SWOT Analysis
- 13.1.6 Autodesk Inc
- 13.1.6.1. Company Overview
- 13.1.6.2. Products
- 13.1.6.3. Company Financials
- 13.1.6.4. SWOT Analysis
- 13.1.7 Stratus's Inc
- 13.1.7.1. Company Overview
- 13.1.7.2. Products
- 13.1.7.3. Company Financials
- 13.1.7.4. SWOT Analysis
- 13.1.8 Dolby Laboratories Inc
- 13.1.8.1. Company Overview
- 13.1.8.2. Products
- 13.1.8.3. Company Financials
- 13.1.8.4. SWOT Analysis
- 13.1.9 Panasonic Corporation
- 13.1.9.1. Company Overview
- 13.1.9.2. Products
- 13.1.9.3. Company Financials
- 13.1.9.4. SWOT Analysis
- 13.1.10 Sony Corporation
- 13.1.10.1. Company Overview
- 13.1.10.2. Products
- 13.1.10.3. Company Financials
- 13.1.10.4. SWOT Analysis
- 13.1.1 LG Electronics Inc
- 13.2. Market Entropy
- 13.2.1 Company's Key Areas Served
- 13.2.2 Recent Developments
- 13.3. Company Market Share Analysis 2025
- 13.3.1 Top 5 Companies Market Share Analysis
- 13.3.2 Top 3 Companies Market Share Analysis
- 13.4. List of Potential Customers
- 14. Research Methodology
List of Figures
- Figure 1: Global 3D & 4D Technology Industry Revenue Breakdown (Million, %) by Region 2025 & 2033
- Figure 2: North America 3D & 4D Technology Industry Revenue (Million), by Products 2025 & 2033
- Figure 3: North America 3D & 4D Technology Industry Revenue Share (%), by Products 2025 & 2033
- Figure 4: North America 3D & 4D Technology Industry Revenue (Million), by End-User Industry 2025 & 2033
- Figure 5: North America 3D & 4D Technology Industry Revenue Share (%), by End-User Industry 2025 & 2033
- Figure 6: North America 3D & 4D Technology Industry Revenue (Million), by Country 2025 & 2033
- Figure 7: North America 3D & 4D Technology Industry Revenue Share (%), by Country 2025 & 2033
- Figure 8: Europe 3D & 4D Technology Industry Revenue (Million), by Products 2025 & 2033
- Figure 9: Europe 3D & 4D Technology Industry Revenue Share (%), by Products 2025 & 2033
- Figure 10: Europe 3D & 4D Technology Industry Revenue (Million), by End-User Industry 2025 & 2033
- Figure 11: Europe 3D & 4D Technology Industry Revenue Share (%), by End-User Industry 2025 & 2033
- Figure 12: Europe 3D & 4D Technology Industry Revenue (Million), by Country 2025 & 2033
- Figure 13: Europe 3D & 4D Technology Industry Revenue Share (%), by Country 2025 & 2033
- Figure 14: Asia 3D & 4D Technology Industry Revenue (Million), by Products 2025 & 2033
- Figure 15: Asia 3D & 4D Technology Industry Revenue Share (%), by Products 2025 & 2033
- Figure 16: Asia 3D & 4D Technology Industry Revenue (Million), by End-User Industry 2025 & 2033
- Figure 17: Asia 3D & 4D Technology Industry Revenue Share (%), by End-User Industry 2025 & 2033
- Figure 18: Asia 3D & 4D Technology Industry Revenue (Million), by Country 2025 & 2033
- Figure 19: Asia 3D & 4D Technology Industry Revenue Share (%), by Country 2025 & 2033
- Figure 20: Australia and New Zealand 3D & 4D Technology Industry Revenue (Million), by Products 2025 & 2033
- Figure 21: Australia and New Zealand 3D & 4D Technology Industry Revenue Share (%), by Products 2025 & 2033
- Figure 22: Australia and New Zealand 3D & 4D Technology Industry Revenue (Million), by End-User Industry 2025 & 2033
- Figure 23: Australia and New Zealand 3D & 4D Technology Industry Revenue Share (%), by End-User Industry 2025 & 2033
- Figure 24: Australia and New Zealand 3D & 4D Technology Industry Revenue (Million), by Country 2025 & 2033
- Figure 25: Australia and New Zealand 3D & 4D Technology Industry Revenue Share (%), by Country 2025 & 2033
- Figure 26: Latin America 3D & 4D Technology Industry Revenue (Million), by Products 2025 & 2033
- Figure 27: Latin America 3D & 4D Technology Industry Revenue Share (%), by Products 2025 & 2033
- Figure 28: Latin America 3D & 4D Technology Industry Revenue (Million), by End-User Industry 2025 & 2033
- Figure 29: Latin America 3D & 4D Technology Industry Revenue Share (%), by End-User Industry 2025 & 2033
- Figure 30: Latin America 3D & 4D Technology Industry Revenue (Million), by Country 2025 & 2033
- Figure 31: Latin America 3D & 4D Technology Industry Revenue Share (%), by Country 2025 & 2033
- Figure 32: Middle East and Africa 3D & 4D Technology Industry Revenue (Million), by Products 2025 & 2033
- Figure 33: Middle East and Africa 3D & 4D Technology Industry Revenue Share (%), by Products 2025 & 2033
- Figure 34: Middle East and Africa 3D & 4D Technology Industry Revenue (Million), by End-User Industry 2025 & 2033
- Figure 35: Middle East and Africa 3D & 4D Technology Industry Revenue Share (%), by End-User Industry 2025 & 2033
- Figure 36: Middle East and Africa 3D & 4D Technology Industry Revenue (Million), by Country 2025 & 2033
- Figure 37: Middle East and Africa 3D & 4D Technology Industry Revenue Share (%), by Country 2025 & 2033
List of Tables
- Table 1: Global 3D & 4D Technology Industry Revenue Million Forecast, by Products 2020 & 2033
- Table 2: Global 3D & 4D Technology Industry Revenue Million Forecast, by End-User Industry 2020 & 2033
- Table 3: Global 3D & 4D Technology Industry Revenue Million Forecast, by Region 2020 & 2033
- Table 4: Global 3D & 4D Technology Industry Revenue Million Forecast, by Products 2020 & 2033
- Table 5: Global 3D & 4D Technology Industry Revenue Million Forecast, by End-User Industry 2020 & 2033
- Table 6: Global 3D & 4D Technology Industry Revenue Million Forecast, by Country 2020 & 2033
- Table 7: Global 3D & 4D Technology Industry Revenue Million Forecast, by Products 2020 & 2033
- Table 8: Global 3D & 4D Technology Industry Revenue Million Forecast, by End-User Industry 2020 & 2033
- Table 9: Global 3D & 4D Technology Industry Revenue Million Forecast, by Country 2020 & 2033
- Table 10: Global 3D & 4D Technology Industry Revenue Million Forecast, by Products 2020 & 2033
- Table 11: Global 3D & 4D Technology Industry Revenue Million Forecast, by End-User Industry 2020 & 2033
- Table 12: Global 3D & 4D Technology Industry Revenue Million Forecast, by Country 2020 & 2033
- Table 13: Global 3D & 4D Technology Industry Revenue Million Forecast, by Products 2020 & 2033
- Table 14: Global 3D & 4D Technology Industry Revenue Million Forecast, by End-User Industry 2020 & 2033
- Table 15: Global 3D & 4D Technology Industry Revenue Million Forecast, by Country 2020 & 2033
- Table 16: Global 3D & 4D Technology Industry Revenue Million Forecast, by Products 2020 & 2033
- Table 17: Global 3D & 4D Technology Industry Revenue Million Forecast, by End-User Industry 2020 & 2033
- Table 18: Global 3D & 4D Technology Industry Revenue Million Forecast, by Country 2020 & 2033
- Table 19: Global 3D & 4D Technology Industry Revenue Million Forecast, by Products 2020 & 2033
- Table 20: Global 3D & 4D Technology Industry Revenue Million Forecast, by End-User Industry 2020 & 2033
- Table 21: Global 3D & 4D Technology Industry Revenue Million Forecast, by Country 2020 & 2033
Frequently Asked Questions
1. What is the projected Compound Annual Growth Rate (CAGR) of the 3D & 4D Technology Industry?
The projected CAGR is approximately 21.82%.
2. Which companies are prominent players in the 3D & 4D Technology Industry?
Key companies in the market include LG Electronics Inc, Samsung Electronics Co Ltd, Barco N V, Intel Corporatio, 3D Systems Corporation, Autodesk Inc, Stratus's Inc, Dolby Laboratories Inc, Panasonic Corporation, Sony Corporation.
3. What are the main segments of the 3D & 4D Technology Industry?
The market segments include Products, End-User Industry.
4. Can you provide details about the market size?
The market size is estimated to be USD 295.35 Million as of 2022.
5. What are some drivers contributing to market growth?
Increasing Applications of 3D Technology Across Various End-User Industries; Increasing Demand for 3D Technology in the Entertainment Industry; Increased Investment in R&D to Drive Development of Cost-Effective 3D Technology.
6. What are the notable trends driving market growth?
Increasing Applications of 3D Printing Across Various End-user Industries.
7. Are there any restraints impacting market growth?
High Product Associated Costs and Availability of 3D Printing Materials.
8. Can you provide examples of recent developments in the market?
June 2023: Epic Games, the creators of Fortnite and Unreal Engine, and LVMH, a France-based luxury goods conglomerate, partnered to modernize the Group's creative process and offer clients new immersive product discovery experiences. Due to this strategic partnership with Epic, LVMH and its brands will be able to provide experiences like virtual fitting rooms and fashion shows, 360-degree product carousels, augmented reality, the development of digital twins, and more.
9. What pricing options are available for accessing the report?
Pricing options include single-user, multi-user, and enterprise licenses priced at USD 4750, USD 5250, and USD 8750 respectively.
10. Is the market size provided in terms of value or volume?
The market size is provided in terms of value, measured in Million.
11. Are there any specific market keywords associated with the report?
Yes, the market keyword associated with the report is "3D & 4D Technology Industry," which aids in identifying and referencing the specific market segment covered.
12. How do I determine which pricing option suits my needs best?
The pricing options vary based on user requirements and access needs. Individual users may opt for single-user licenses, while businesses requiring broader access may choose multi-user or enterprise licenses for cost-effective access to the report.
13. Are there any additional resources or data provided in the 3D & 4D Technology Industry report?
While the report offers comprehensive insights, it's advisable to review the specific contents or supplementary materials provided to ascertain if additional resources or data are available.
14. How can I stay updated on further developments or reports in the 3D & 4D Technology Industry?
To stay informed about further developments, trends, and reports in the 3D & 4D Technology Industry, consider subscribing to industry newsletters, following relevant companies and organizations, or regularly checking reputable industry news sources and publications.
Methodology
Step 1 - Identification of Relevant Samples Size from Population Database


Step 2 - Approaches for Defining Global Market Size (Value, Volume* & Price*)

Note*: In applicable scenarios
Step 3 - Data Sources
Primary Research
- Web Analytics
- Survey Reports
- Research Institute
- Latest Research Reports
- Opinion Leaders
Secondary Research
- Annual Reports
- White Paper
- Latest Press Release
- Industry Association
- Paid Database
- Investor Presentations

Step 4 - Data Triangulation
Involves using different sources of information in order to increase the validity of a study
These sources are likely to be stakeholders in a program - participants, other researchers, program staff, other community members, and so on.
Then we put all data in single framework & apply various statistical tools to find out the dynamic on the market.
During the analysis stage, feedback from the stakeholder groups would be compared to determine areas of agreement as well as areas of divergence