
Key Insights
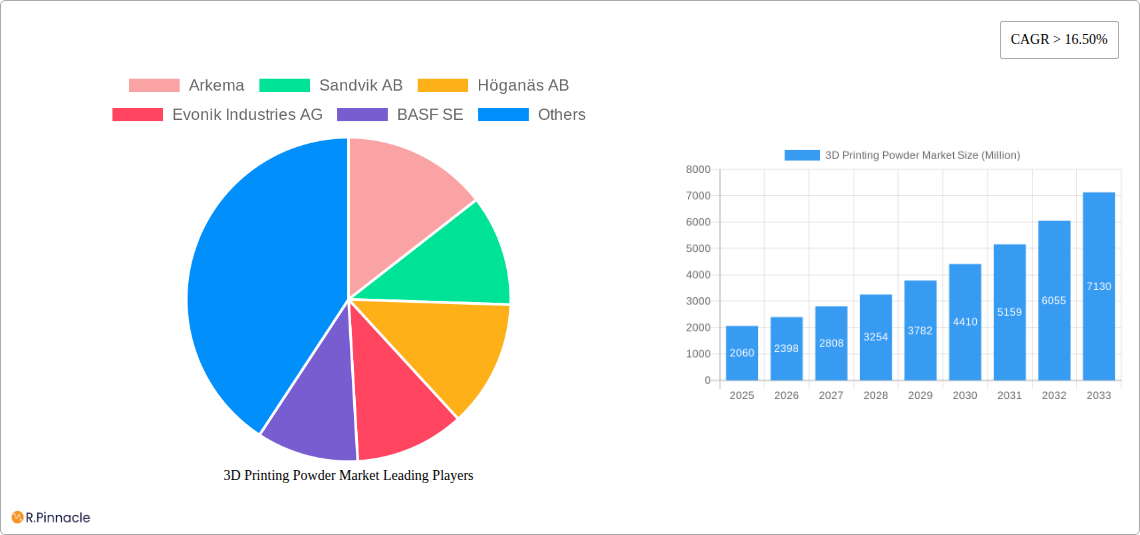
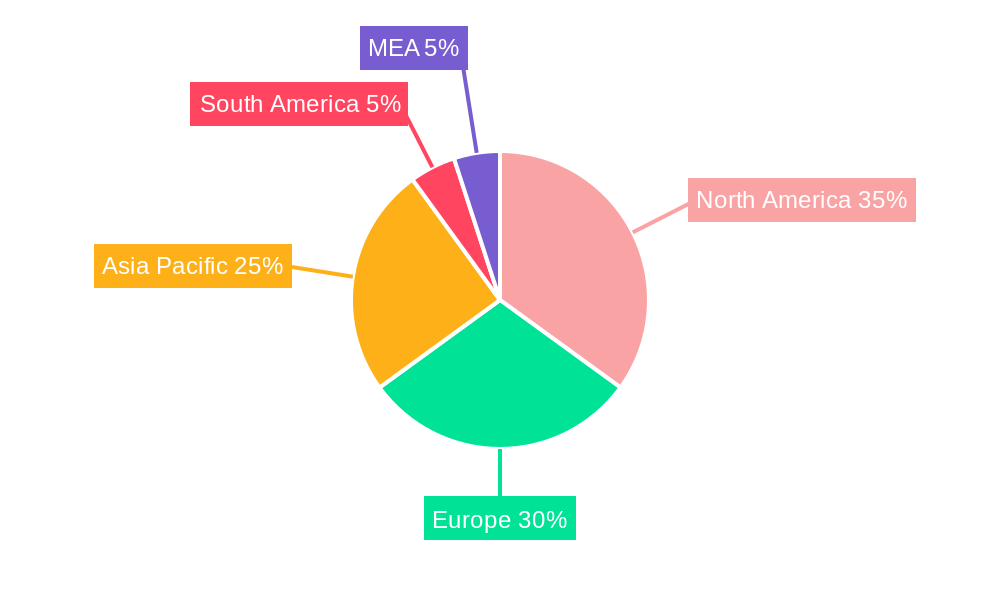
The 3D printing powder market, valued at $2.06 billion in 2025, is experiencing robust growth, projected to expand at a Compound Annual Growth Rate (CAGR) exceeding 16.50% from 2025 to 2033. This surge is driven by the increasing adoption of additive manufacturing across diverse sectors, including automotive, aerospace, medical, and architecture. The demand for lightweight, high-strength components, coupled with the need for design flexibility and customization, fuels the market's expansion. Specifically, the automotive industry's push for lightweighting vehicles and the aerospace sector's need for complex, high-performance parts are significant contributors. Furthermore, advancements in powder materials, such as the development of biocompatible powders for medical implants and high-temperature resistant powders for aerospace applications, are creating new avenues for growth. The market segmentation reveals a strong preference for plastic powders, followed by metal powders, due to their versatility and cost-effectiveness in various applications. However, growing demand for high-performance materials is driving the growth of metal and ceramic powders. Competition among major players like Arkema, Sandvik AB, and BASF SE is intense, fostering innovation and driving down costs. Geographic analysis indicates a strong presence in North America and Europe, driven by established manufacturing bases and technological advancements. However, rapidly developing economies in Asia-Pacific are emerging as significant growth regions, fueled by increasing manufacturing activity and government support for additive manufacturing initiatives.
The continued expansion of the 3D printing powder market hinges on overcoming several challenges. The relatively high cost of 3D printing powder compared to traditional manufacturing methods remains a significant barrier, particularly for smaller businesses. Moreover, the need for specialized equipment and skilled personnel to operate 3D printing systems presents an adoption hurdle. Further research and development into cost-effective powder production techniques and user-friendly equipment are crucial for broader market penetration. Addressing environmental concerns related to powder handling and disposal is also paramount for sustainable growth. However, ongoing technological advancements, such as the development of more efficient printing processes and improved powder material properties, are expected to mitigate these challenges and further propel market growth in the coming years.
3D Printing Powder Market: A Comprehensive Report (2019-2033)
This comprehensive report provides a detailed analysis of the 3D printing powder market, offering invaluable insights for industry professionals, investors, and researchers. Covering the period from 2019 to 2033, with a focus on 2025, this report meticulously examines market dynamics, segmentation, key players, and future trends, providing a clear roadmap for navigating this rapidly evolving sector. The market is projected to reach xx Million by 2033, exhibiting a CAGR of xx% during the forecast period (2025-2033).
3D Printing Powder Market Structure & Innovation Trends
This section analyzes the competitive landscape of the 3D printing powder market, focusing on market concentration, innovation drivers, regulatory frameworks, and mergers and acquisitions (M&A) activities. The market exhibits a moderately concentrated structure, with key players like Arkema, Sandvik AB, Höganäs AB, Evonik Industries AG, and BASF SE holding significant market share. The combined market share of the top five players is estimated to be around xx% in 2025.
Innovation is a key driver, with continuous advancements in powder materials (e.g., high-strength alloys, biocompatible polymers) and 3D printing technologies. Regulatory frameworks, such as those concerning material safety and environmental impact, play a crucial role. Product substitutes, such as traditional manufacturing methods, pose a competitive challenge, although the unique advantages of 3D printing are gradually expanding its market penetration.
M&A activities have been relatively frequent, with deal values totaling xx Million in the historical period (2019-2024). These activities reflect the strategic importance of securing market share and accessing advanced technologies. End-user demographics show a growing demand across various sectors, driving market growth.
- Market Concentration: Moderately concentrated, with top 5 players holding xx% market share (2025).
- Innovation Drivers: Advancements in powder materials and 3D printing technologies.
- Regulatory Frameworks: Influence material safety and environmental aspects.
- M&A Activity: Total deal value of xx Million (2019-2024).
3D Printing Powder Market Dynamics & Trends
The 3D printing powder market is experiencing robust growth, propelled by several key factors. Increasing adoption of additive manufacturing across various industries, particularly in prototyping and customized production, is a major driver. Technological advancements, such as the development of new powder materials with enhanced properties and improved printing processes, are further fueling market expansion. The rising demand for lightweight and high-strength components in industries like aerospace and automotive is also significantly contributing to market growth. Consumer preferences for personalized products and on-demand manufacturing are also playing a key role. Competitive dynamics are characterized by intense innovation, strategic partnerships, and mergers and acquisitions.
The market is expected to maintain a strong growth trajectory, with the CAGR projected to be xx% during the forecast period. Market penetration is increasing across various end-user industries, indicating substantial growth potential in the coming years.
Dominant Regions & Segments in 3D Printing Powder Market
The 3D printing powder market exhibits regional variations in growth, with North America and Europe currently leading the market. However, Asia-Pacific is anticipated to experience rapid growth in the coming years, driven by increasing industrialization and government support for additive manufacturing technologies.
Dominant Segments:
- Powder Type: Metal powders currently dominate the market due to their widespread application in various industries. However, plastic powders are also experiencing significant growth.
- End-user Industry: The automotive and aerospace & defense sectors are the largest consumers of 3D printing powders due to the high demand for customized parts and components.
Key Drivers:
- North America & Europe: Established additive manufacturing infrastructure and high technology adoption rates.
- Asia-Pacific: Rapid industrialization, growing government support for advanced manufacturing, and cost advantages.
Dominance Analysis: Metal powder segment dominates due to its use in high-value applications. The automotive and aerospace sectors are key drivers of growth due to the high demand for lightweight and high-performance components.
3D Printing Powder Market Product Innovations
Recent product innovations focus on developing powders with enhanced properties, such as improved strength, durability, and biocompatibility. New materials, including high-performance alloys and bio-resorbable polymers, are expanding application possibilities. These innovations enhance the capabilities of 3D printing technologies, enabling the creation of complex and highly functional parts. The market is witnessing the emergence of specialized powders tailored to specific applications, leading to increased efficiency and reduced production costs. This trend is expected to further drive market growth and adoption.
Report Scope & Segmentation Analysis
This report provides a detailed segmentation of the 3D printing powder market based on powder type and end-user industry.
Powder Type: The market is segmented into plastic powder, metal powder, ceramic powder, glass powder, and other types (composite powders, etc.). Each segment's growth projection, market size, and competitive dynamics are analyzed.
End-user Industry: The market is further segmented based on end-user industry, including automotive, aerospace and defense, medical, architecture, and other end-user industries (consumer goods, industrial, etc.). The report provides detailed growth projections and market size for each segment, analyzing the competitive landscape within each.
Key Drivers of 3D Printing Powder Market Growth
Several factors are driving the growth of the 3D printing powder market. The increasing adoption of additive manufacturing across various industries, technological advancements leading to improved powder materials and printing processes, and the rising demand for customized and lightweight components are key drivers. Government initiatives and investments in advanced manufacturing are further accelerating market growth.
Challenges in the 3D Printing Powder Market Sector
The 3D printing powder market faces certain challenges, including the high cost of 3D printing equipment and materials, potential health and safety concerns related to powder handling, and the need for skilled operators. Competition from traditional manufacturing methods and the complexity of supply chains also pose challenges. Furthermore, regulatory hurdles related to material safety and environmental impact can influence market growth.
Emerging Opportunities in 3D Printing Powder Market
Emerging opportunities include the development of new and advanced powder materials with enhanced properties, the expansion of 3D printing applications into new industries, and the growth of on-demand manufacturing. The increasing adoption of 3D printing in personalized medicine and customized healthcare solutions presents significant growth potential. Furthermore, the development of sustainable and environmentally friendly powder materials presents a major opportunity.
Leading Players in the 3D Printing Powder Market Market
- Arkema
- Sandvik AB
- Höganäs AB
- Evonik Industries AG
- BASF SE
- Metalysis
- ERASTEEL
- GKN Powder Metallurgy
- ExOne
Key Developments in 3D Printing Powder Market Industry
- 2023-Q3: Arkema launched a new range of high-performance plastic powders for 3D printing.
- 2022-Q4: Sandvik AB announced a strategic partnership with a leading 3D printing company.
- 2021-Q2: Evonik Industries AG invested in a new facility for the production of metal powders.
- (Further key developments will be included in the full report)
Future Outlook for 3D Printing Powder Market Market
The future outlook for the 3D printing powder market is positive, with continued growth driven by technological advancements, increasing adoption across various industries, and the expansion of applications into new areas. The development of new materials and processes will further enhance the capabilities of 3D printing, leading to broader adoption and market expansion. Strategic partnerships and collaborations among key players will play a crucial role in shaping the future of this dynamic market.
3D Printing Powder Market Segmentation
-
1. Powder Type
- 1.1. Plastic Powder
- 1.2. Metal Powder
- 1.3. Ceramic Powder
- 1.4. Glass Powder
- 1.5. Other Types (Composite Powder, etc.)
-
2. End-user Industry
- 2.1. Automotive
- 2.2. Aerospace and Defense
- 2.3. Medical
- 2.4. Architecture
- 2.5. Other En
3D Printing Powder Market Segmentation By Geography
-
1. Asia Pacific
- 1.1. China
- 1.2. India
- 1.3. Japan
- 1.4. South Korea
- 1.5. Rest of Asia Pacific
-
2. North America
- 2.1. United States
- 2.2. Canada
- 2.3. Mexico
-
3. Europe
- 3.1. Germany
- 3.2. United Kingdom
- 3.3. France
- 3.4. Italy
- 3.5. Rest of Europe
-
4. South America
- 4.1. Brazil
- 4.2. Argentina
- 4.3. Rest of South America
-
5. Middle East and Africa
- 5.1. Saudi Arabia
- 5.2. South Africa
- 5.3. Rest of Middle East and Africa
3D Printing Powder Market REPORT HIGHLIGHTS
| Aspects | Details |
|---|---|
| Study Period | 2019-2033 |
| Base Year | 2024 |
| Estimated Year | 2025 |
| Forecast Period | 2025-2033 |
| Historical Period | 2019-2024 |
| Growth Rate | CAGR of > 16.50% from 2019-2033 |
| Segmentation |
|
Table of Contents
- 1. Introduction
- 1.1. Research Scope
- 1.2. Market Segmentation
- 1.3. Research Methodology
- 1.4. Definitions and Assumptions
- 2. Executive Summary
- 2.1. Introduction
- 3. Market Dynamics
- 3.1. Introduction
- 3.2. Market Drivers
- 3.2.1. Increasing Applications in Aerospace and Automobile Industries; Growing Demand from Medical Sector; Other Drivers
- 3.3. Market Restrains
- 3.3.1. HIgh Material and Post Processing Cost; Hazardous in Nature
- 3.4. Market Trends
- 3.4.1. Growing Demand from Automobile Sector
- 4. Market Factor Analysis
- 4.1. Porters Five Forces
- 4.2. Supply/Value Chain
- 4.3. PESTEL analysis
- 4.4. Market Entropy
- 4.5. Patent/Trademark Analysis
- 5. Global 3D Printing Powder Market Analysis, Insights and Forecast, 2019-2031
- 5.1. Market Analysis, Insights and Forecast - by Powder Type
- 5.1.1. Plastic Powder
- 5.1.2. Metal Powder
- 5.1.3. Ceramic Powder
- 5.1.4. Glass Powder
- 5.1.5. Other Types (Composite Powder, etc.)
- 5.2. Market Analysis, Insights and Forecast - by End-user Industry
- 5.2.1. Automotive
- 5.2.2. Aerospace and Defense
- 5.2.3. Medical
- 5.2.4. Architecture
- 5.2.5. Other En
- 5.3. Market Analysis, Insights and Forecast - by Region
- 5.3.1. Asia Pacific
- 5.3.2. North America
- 5.3.3. Europe
- 5.3.4. South America
- 5.3.5. Middle East and Africa
- 5.1. Market Analysis, Insights and Forecast - by Powder Type
- 6. Asia Pacific 3D Printing Powder Market Analysis, Insights and Forecast, 2019-2031
- 6.1. Market Analysis, Insights and Forecast - by Powder Type
- 6.1.1. Plastic Powder
- 6.1.2. Metal Powder
- 6.1.3. Ceramic Powder
- 6.1.4. Glass Powder
- 6.1.5. Other Types (Composite Powder, etc.)
- 6.2. Market Analysis, Insights and Forecast - by End-user Industry
- 6.2.1. Automotive
- 6.2.2. Aerospace and Defense
- 6.2.3. Medical
- 6.2.4. Architecture
- 6.2.5. Other En
- 6.1. Market Analysis, Insights and Forecast - by Powder Type
- 7. North America 3D Printing Powder Market Analysis, Insights and Forecast, 2019-2031
- 7.1. Market Analysis, Insights and Forecast - by Powder Type
- 7.1.1. Plastic Powder
- 7.1.2. Metal Powder
- 7.1.3. Ceramic Powder
- 7.1.4. Glass Powder
- 7.1.5. Other Types (Composite Powder, etc.)
- 7.2. Market Analysis, Insights and Forecast - by End-user Industry
- 7.2.1. Automotive
- 7.2.2. Aerospace and Defense
- 7.2.3. Medical
- 7.2.4. Architecture
- 7.2.5. Other En
- 7.1. Market Analysis, Insights and Forecast - by Powder Type
- 8. Europe 3D Printing Powder Market Analysis, Insights and Forecast, 2019-2031
- 8.1. Market Analysis, Insights and Forecast - by Powder Type
- 8.1.1. Plastic Powder
- 8.1.2. Metal Powder
- 8.1.3. Ceramic Powder
- 8.1.4. Glass Powder
- 8.1.5. Other Types (Composite Powder, etc.)
- 8.2. Market Analysis, Insights and Forecast - by End-user Industry
- 8.2.1. Automotive
- 8.2.2. Aerospace and Defense
- 8.2.3. Medical
- 8.2.4. Architecture
- 8.2.5. Other En
- 8.1. Market Analysis, Insights and Forecast - by Powder Type
- 9. South America 3D Printing Powder Market Analysis, Insights and Forecast, 2019-2031
- 9.1. Market Analysis, Insights and Forecast - by Powder Type
- 9.1.1. Plastic Powder
- 9.1.2. Metal Powder
- 9.1.3. Ceramic Powder
- 9.1.4. Glass Powder
- 9.1.5. Other Types (Composite Powder, etc.)
- 9.2. Market Analysis, Insights and Forecast - by End-user Industry
- 9.2.1. Automotive
- 9.2.2. Aerospace and Defense
- 9.2.3. Medical
- 9.2.4. Architecture
- 9.2.5. Other En
- 9.1. Market Analysis, Insights and Forecast - by Powder Type
- 10. Middle East and Africa 3D Printing Powder Market Analysis, Insights and Forecast, 2019-2031
- 10.1. Market Analysis, Insights and Forecast - by Powder Type
- 10.1.1. Plastic Powder
- 10.1.2. Metal Powder
- 10.1.3. Ceramic Powder
- 10.1.4. Glass Powder
- 10.1.5. Other Types (Composite Powder, etc.)
- 10.2. Market Analysis, Insights and Forecast - by End-user Industry
- 10.2.1. Automotive
- 10.2.2. Aerospace and Defense
- 10.2.3. Medical
- 10.2.4. Architecture
- 10.2.5. Other En
- 10.1. Market Analysis, Insights and Forecast - by Powder Type
- 11. North America 3D Printing Powder Market Analysis, Insights and Forecast, 2019-2031
- 11.1. Market Analysis, Insights and Forecast - By Country/Sub-region
- 11.1.1 United States
- 11.1.2 Canada
- 11.1.3 Mexico
- 12. Europe 3D Printing Powder Market Analysis, Insights and Forecast, 2019-2031
- 12.1. Market Analysis, Insights and Forecast - By Country/Sub-region
- 12.1.1 Germany
- 12.1.2 France
- 12.1.3 Italy
- 12.1.4 United Kingdom
- 12.1.5 Netherlands
- 12.1.6 Rest of Europe
- 13. Asia Pacific 3D Printing Powder Market Analysis, Insights and Forecast, 2019-2031
- 13.1. Market Analysis, Insights and Forecast - By Country/Sub-region
- 13.1.1 China
- 13.1.2 Japan
- 13.1.3 India
- 13.1.4 South Korea
- 13.1.5 Taiwan
- 13.1.6 Australia
- 13.1.7 Rest of Asia-Pacific
- 14. South America 3D Printing Powder Market Analysis, Insights and Forecast, 2019-2031
- 14.1. Market Analysis, Insights and Forecast - By Country/Sub-region
- 14.1.1 Brazil
- 14.1.2 Argentina
- 14.1.3 Rest of South America
- 15. MEA 3D Printing Powder Market Analysis, Insights and Forecast, 2019-2031
- 15.1. Market Analysis, Insights and Forecast - By Country/Sub-region
- 15.1.1 Middle East
- 15.1.2 Africa
- 16. Competitive Analysis
- 16.1. Global Market Share Analysis 2024
- 16.2. Company Profiles
- 16.2.1 Arkema
- 16.2.1.1. Overview
- 16.2.1.2. Products
- 16.2.1.3. SWOT Analysis
- 16.2.1.4. Recent Developments
- 16.2.1.5. Financials (Based on Availability)
- 16.2.2 Sandvik AB
- 16.2.2.1. Overview
- 16.2.2.2. Products
- 16.2.2.3. SWOT Analysis
- 16.2.2.4. Recent Developments
- 16.2.2.5. Financials (Based on Availability)
- 16.2.3 Höganäs AB
- 16.2.3.1. Overview
- 16.2.3.2. Products
- 16.2.3.3. SWOT Analysis
- 16.2.3.4. Recent Developments
- 16.2.3.5. Financials (Based on Availability)
- 16.2.4 Evonik Industries AG
- 16.2.4.1. Overview
- 16.2.4.2. Products
- 16.2.4.3. SWOT Analysis
- 16.2.4.4. Recent Developments
- 16.2.4.5. Financials (Based on Availability)
- 16.2.5 BASF SE
- 16.2.5.1. Overview
- 16.2.5.2. Products
- 16.2.5.3. SWOT Analysis
- 16.2.5.4. Recent Developments
- 16.2.5.5. Financials (Based on Availability)
- 16.2.6 Metalysis
- 16.2.6.1. Overview
- 16.2.6.2. Products
- 16.2.6.3. SWOT Analysis
- 16.2.6.4. Recent Developments
- 16.2.6.5. Financials (Based on Availability)
- 16.2.7 ERASTEEL
- 16.2.7.1. Overview
- 16.2.7.2. Products
- 16.2.7.3. SWOT Analysis
- 16.2.7.4. Recent Developments
- 16.2.7.5. Financials (Based on Availability)
- 16.2.8 GKN Powder Metallurgy
- 16.2.8.1. Overview
- 16.2.8.2. Products
- 16.2.8.3. SWOT Analysis
- 16.2.8.4. Recent Developments
- 16.2.8.5. Financials (Based on Availability)
- 16.2.9 ExOne
- 16.2.9.1. Overview
- 16.2.9.2. Products
- 16.2.9.3. SWOT Analysis
- 16.2.9.4. Recent Developments
- 16.2.9.5. Financials (Based on Availability)
- 16.2.1 Arkema
List of Figures
- Figure 1: Global 3D Printing Powder Market Revenue Breakdown (Million, %) by Region 2024 & 2032
- Figure 2: Global 3D Printing Powder Market Volume Breakdown (K Tons, %) by Region 2024 & 2032
- Figure 3: North America 3D Printing Powder Market Revenue (Million), by Country 2024 & 2032
- Figure 4: North America 3D Printing Powder Market Volume (K Tons), by Country 2024 & 2032
- Figure 5: North America 3D Printing Powder Market Revenue Share (%), by Country 2024 & 2032
- Figure 6: North America 3D Printing Powder Market Volume Share (%), by Country 2024 & 2032
- Figure 7: Europe 3D Printing Powder Market Revenue (Million), by Country 2024 & 2032
- Figure 8: Europe 3D Printing Powder Market Volume (K Tons), by Country 2024 & 2032
- Figure 9: Europe 3D Printing Powder Market Revenue Share (%), by Country 2024 & 2032
- Figure 10: Europe 3D Printing Powder Market Volume Share (%), by Country 2024 & 2032
- Figure 11: Asia Pacific 3D Printing Powder Market Revenue (Million), by Country 2024 & 2032
- Figure 12: Asia Pacific 3D Printing Powder Market Volume (K Tons), by Country 2024 & 2032
- Figure 13: Asia Pacific 3D Printing Powder Market Revenue Share (%), by Country 2024 & 2032
- Figure 14: Asia Pacific 3D Printing Powder Market Volume Share (%), by Country 2024 & 2032
- Figure 15: South America 3D Printing Powder Market Revenue (Million), by Country 2024 & 2032
- Figure 16: South America 3D Printing Powder Market Volume (K Tons), by Country 2024 & 2032
- Figure 17: South America 3D Printing Powder Market Revenue Share (%), by Country 2024 & 2032
- Figure 18: South America 3D Printing Powder Market Volume Share (%), by Country 2024 & 2032
- Figure 19: MEA 3D Printing Powder Market Revenue (Million), by Country 2024 & 2032
- Figure 20: MEA 3D Printing Powder Market Volume (K Tons), by Country 2024 & 2032
- Figure 21: MEA 3D Printing Powder Market Revenue Share (%), by Country 2024 & 2032
- Figure 22: MEA 3D Printing Powder Market Volume Share (%), by Country 2024 & 2032
- Figure 23: Asia Pacific 3D Printing Powder Market Revenue (Million), by Powder Type 2024 & 2032
- Figure 24: Asia Pacific 3D Printing Powder Market Volume (K Tons), by Powder Type 2024 & 2032
- Figure 25: Asia Pacific 3D Printing Powder Market Revenue Share (%), by Powder Type 2024 & 2032
- Figure 26: Asia Pacific 3D Printing Powder Market Volume Share (%), by Powder Type 2024 & 2032
- Figure 27: Asia Pacific 3D Printing Powder Market Revenue (Million), by End-user Industry 2024 & 2032
- Figure 28: Asia Pacific 3D Printing Powder Market Volume (K Tons), by End-user Industry 2024 & 2032
- Figure 29: Asia Pacific 3D Printing Powder Market Revenue Share (%), by End-user Industry 2024 & 2032
- Figure 30: Asia Pacific 3D Printing Powder Market Volume Share (%), by End-user Industry 2024 & 2032
- Figure 31: Asia Pacific 3D Printing Powder Market Revenue (Million), by Country 2024 & 2032
- Figure 32: Asia Pacific 3D Printing Powder Market Volume (K Tons), by Country 2024 & 2032
- Figure 33: Asia Pacific 3D Printing Powder Market Revenue Share (%), by Country 2024 & 2032
- Figure 34: Asia Pacific 3D Printing Powder Market Volume Share (%), by Country 2024 & 2032
- Figure 35: North America 3D Printing Powder Market Revenue (Million), by Powder Type 2024 & 2032
- Figure 36: North America 3D Printing Powder Market Volume (K Tons), by Powder Type 2024 & 2032
- Figure 37: North America 3D Printing Powder Market Revenue Share (%), by Powder Type 2024 & 2032
- Figure 38: North America 3D Printing Powder Market Volume Share (%), by Powder Type 2024 & 2032
- Figure 39: North America 3D Printing Powder Market Revenue (Million), by End-user Industry 2024 & 2032
- Figure 40: North America 3D Printing Powder Market Volume (K Tons), by End-user Industry 2024 & 2032
- Figure 41: North America 3D Printing Powder Market Revenue Share (%), by End-user Industry 2024 & 2032
- Figure 42: North America 3D Printing Powder Market Volume Share (%), by End-user Industry 2024 & 2032
- Figure 43: North America 3D Printing Powder Market Revenue (Million), by Country 2024 & 2032
- Figure 44: North America 3D Printing Powder Market Volume (K Tons), by Country 2024 & 2032
- Figure 45: North America 3D Printing Powder Market Revenue Share (%), by Country 2024 & 2032
- Figure 46: North America 3D Printing Powder Market Volume Share (%), by Country 2024 & 2032
- Figure 47: Europe 3D Printing Powder Market Revenue (Million), by Powder Type 2024 & 2032
- Figure 48: Europe 3D Printing Powder Market Volume (K Tons), by Powder Type 2024 & 2032
- Figure 49: Europe 3D Printing Powder Market Revenue Share (%), by Powder Type 2024 & 2032
- Figure 50: Europe 3D Printing Powder Market Volume Share (%), by Powder Type 2024 & 2032
- Figure 51: Europe 3D Printing Powder Market Revenue (Million), by End-user Industry 2024 & 2032
- Figure 52: Europe 3D Printing Powder Market Volume (K Tons), by End-user Industry 2024 & 2032
- Figure 53: Europe 3D Printing Powder Market Revenue Share (%), by End-user Industry 2024 & 2032
- Figure 54: Europe 3D Printing Powder Market Volume Share (%), by End-user Industry 2024 & 2032
- Figure 55: Europe 3D Printing Powder Market Revenue (Million), by Country 2024 & 2032
- Figure 56: Europe 3D Printing Powder Market Volume (K Tons), by Country 2024 & 2032
- Figure 57: Europe 3D Printing Powder Market Revenue Share (%), by Country 2024 & 2032
- Figure 58: Europe 3D Printing Powder Market Volume Share (%), by Country 2024 & 2032
- Figure 59: South America 3D Printing Powder Market Revenue (Million), by Powder Type 2024 & 2032
- Figure 60: South America 3D Printing Powder Market Volume (K Tons), by Powder Type 2024 & 2032
- Figure 61: South America 3D Printing Powder Market Revenue Share (%), by Powder Type 2024 & 2032
- Figure 62: South America 3D Printing Powder Market Volume Share (%), by Powder Type 2024 & 2032
- Figure 63: South America 3D Printing Powder Market Revenue (Million), by End-user Industry 2024 & 2032
- Figure 64: South America 3D Printing Powder Market Volume (K Tons), by End-user Industry 2024 & 2032
- Figure 65: South America 3D Printing Powder Market Revenue Share (%), by End-user Industry 2024 & 2032
- Figure 66: South America 3D Printing Powder Market Volume Share (%), by End-user Industry 2024 & 2032
- Figure 67: South America 3D Printing Powder Market Revenue (Million), by Country 2024 & 2032
- Figure 68: South America 3D Printing Powder Market Volume (K Tons), by Country 2024 & 2032
- Figure 69: South America 3D Printing Powder Market Revenue Share (%), by Country 2024 & 2032
- Figure 70: South America 3D Printing Powder Market Volume Share (%), by Country 2024 & 2032
- Figure 71: Middle East and Africa 3D Printing Powder Market Revenue (Million), by Powder Type 2024 & 2032
- Figure 72: Middle East and Africa 3D Printing Powder Market Volume (K Tons), by Powder Type 2024 & 2032
- Figure 73: Middle East and Africa 3D Printing Powder Market Revenue Share (%), by Powder Type 2024 & 2032
- Figure 74: Middle East and Africa 3D Printing Powder Market Volume Share (%), by Powder Type 2024 & 2032
- Figure 75: Middle East and Africa 3D Printing Powder Market Revenue (Million), by End-user Industry 2024 & 2032
- Figure 76: Middle East and Africa 3D Printing Powder Market Volume (K Tons), by End-user Industry 2024 & 2032
- Figure 77: Middle East and Africa 3D Printing Powder Market Revenue Share (%), by End-user Industry 2024 & 2032
- Figure 78: Middle East and Africa 3D Printing Powder Market Volume Share (%), by End-user Industry 2024 & 2032
- Figure 79: Middle East and Africa 3D Printing Powder Market Revenue (Million), by Country 2024 & 2032
- Figure 80: Middle East and Africa 3D Printing Powder Market Volume (K Tons), by Country 2024 & 2032
- Figure 81: Middle East and Africa 3D Printing Powder Market Revenue Share (%), by Country 2024 & 2032
- Figure 82: Middle East and Africa 3D Printing Powder Market Volume Share (%), by Country 2024 & 2032
List of Tables
- Table 1: Global 3D Printing Powder Market Revenue Million Forecast, by Region 2019 & 2032
- Table 2: Global 3D Printing Powder Market Volume K Tons Forecast, by Region 2019 & 2032
- Table 3: Global 3D Printing Powder Market Revenue Million Forecast, by Powder Type 2019 & 2032
- Table 4: Global 3D Printing Powder Market Volume K Tons Forecast, by Powder Type 2019 & 2032
- Table 5: Global 3D Printing Powder Market Revenue Million Forecast, by End-user Industry 2019 & 2032
- Table 6: Global 3D Printing Powder Market Volume K Tons Forecast, by End-user Industry 2019 & 2032
- Table 7: Global 3D Printing Powder Market Revenue Million Forecast, by Region 2019 & 2032
- Table 8: Global 3D Printing Powder Market Volume K Tons Forecast, by Region 2019 & 2032
- Table 9: Global 3D Printing Powder Market Revenue Million Forecast, by Country 2019 & 2032
- Table 10: Global 3D Printing Powder Market Volume K Tons Forecast, by Country 2019 & 2032
- Table 11: United States 3D Printing Powder Market Revenue (Million) Forecast, by Application 2019 & 2032
- Table 12: United States 3D Printing Powder Market Volume (K Tons) Forecast, by Application 2019 & 2032
- Table 13: Canada 3D Printing Powder Market Revenue (Million) Forecast, by Application 2019 & 2032
- Table 14: Canada 3D Printing Powder Market Volume (K Tons) Forecast, by Application 2019 & 2032
- Table 15: Mexico 3D Printing Powder Market Revenue (Million) Forecast, by Application 2019 & 2032
- Table 16: Mexico 3D Printing Powder Market Volume (K Tons) Forecast, by Application 2019 & 2032
- Table 17: Global 3D Printing Powder Market Revenue Million Forecast, by Country 2019 & 2032
- Table 18: Global 3D Printing Powder Market Volume K Tons Forecast, by Country 2019 & 2032
- Table 19: Germany 3D Printing Powder Market Revenue (Million) Forecast, by Application 2019 & 2032
- Table 20: Germany 3D Printing Powder Market Volume (K Tons) Forecast, by Application 2019 & 2032
- Table 21: France 3D Printing Powder Market Revenue (Million) Forecast, by Application 2019 & 2032
- Table 22: France 3D Printing Powder Market Volume (K Tons) Forecast, by Application 2019 & 2032
- Table 23: Italy 3D Printing Powder Market Revenue (Million) Forecast, by Application 2019 & 2032
- Table 24: Italy 3D Printing Powder Market Volume (K Tons) Forecast, by Application 2019 & 2032
- Table 25: United Kingdom 3D Printing Powder Market Revenue (Million) Forecast, by Application 2019 & 2032
- Table 26: United Kingdom 3D Printing Powder Market Volume (K Tons) Forecast, by Application 2019 & 2032
- Table 27: Netherlands 3D Printing Powder Market Revenue (Million) Forecast, by Application 2019 & 2032
- Table 28: Netherlands 3D Printing Powder Market Volume (K Tons) Forecast, by Application 2019 & 2032
- Table 29: Rest of Europe 3D Printing Powder Market Revenue (Million) Forecast, by Application 2019 & 2032
- Table 30: Rest of Europe 3D Printing Powder Market Volume (K Tons) Forecast, by Application 2019 & 2032
- Table 31: Global 3D Printing Powder Market Revenue Million Forecast, by Country 2019 & 2032
- Table 32: Global 3D Printing Powder Market Volume K Tons Forecast, by Country 2019 & 2032
- Table 33: China 3D Printing Powder Market Revenue (Million) Forecast, by Application 2019 & 2032
- Table 34: China 3D Printing Powder Market Volume (K Tons) Forecast, by Application 2019 & 2032
- Table 35: Japan 3D Printing Powder Market Revenue (Million) Forecast, by Application 2019 & 2032
- Table 36: Japan 3D Printing Powder Market Volume (K Tons) Forecast, by Application 2019 & 2032
- Table 37: India 3D Printing Powder Market Revenue (Million) Forecast, by Application 2019 & 2032
- Table 38: India 3D Printing Powder Market Volume (K Tons) Forecast, by Application 2019 & 2032
- Table 39: South Korea 3D Printing Powder Market Revenue (Million) Forecast, by Application 2019 & 2032
- Table 40: South Korea 3D Printing Powder Market Volume (K Tons) Forecast, by Application 2019 & 2032
- Table 41: Taiwan 3D Printing Powder Market Revenue (Million) Forecast, by Application 2019 & 2032
- Table 42: Taiwan 3D Printing Powder Market Volume (K Tons) Forecast, by Application 2019 & 2032
- Table 43: Australia 3D Printing Powder Market Revenue (Million) Forecast, by Application 2019 & 2032
- Table 44: Australia 3D Printing Powder Market Volume (K Tons) Forecast, by Application 2019 & 2032
- Table 45: Rest of Asia-Pacific 3D Printing Powder Market Revenue (Million) Forecast, by Application 2019 & 2032
- Table 46: Rest of Asia-Pacific 3D Printing Powder Market Volume (K Tons) Forecast, by Application 2019 & 2032
- Table 47: Global 3D Printing Powder Market Revenue Million Forecast, by Country 2019 & 2032
- Table 48: Global 3D Printing Powder Market Volume K Tons Forecast, by Country 2019 & 2032
- Table 49: Brazil 3D Printing Powder Market Revenue (Million) Forecast, by Application 2019 & 2032
- Table 50: Brazil 3D Printing Powder Market Volume (K Tons) Forecast, by Application 2019 & 2032
- Table 51: Argentina 3D Printing Powder Market Revenue (Million) Forecast, by Application 2019 & 2032
- Table 52: Argentina 3D Printing Powder Market Volume (K Tons) Forecast, by Application 2019 & 2032
- Table 53: Rest of South America 3D Printing Powder Market Revenue (Million) Forecast, by Application 2019 & 2032
- Table 54: Rest of South America 3D Printing Powder Market Volume (K Tons) Forecast, by Application 2019 & 2032
- Table 55: Global 3D Printing Powder Market Revenue Million Forecast, by Country 2019 & 2032
- Table 56: Global 3D Printing Powder Market Volume K Tons Forecast, by Country 2019 & 2032
- Table 57: Middle East 3D Printing Powder Market Revenue (Million) Forecast, by Application 2019 & 2032
- Table 58: Middle East 3D Printing Powder Market Volume (K Tons) Forecast, by Application 2019 & 2032
- Table 59: Africa 3D Printing Powder Market Revenue (Million) Forecast, by Application 2019 & 2032
- Table 60: Africa 3D Printing Powder Market Volume (K Tons) Forecast, by Application 2019 & 2032
- Table 61: Global 3D Printing Powder Market Revenue Million Forecast, by Powder Type 2019 & 2032
- Table 62: Global 3D Printing Powder Market Volume K Tons Forecast, by Powder Type 2019 & 2032
- Table 63: Global 3D Printing Powder Market Revenue Million Forecast, by End-user Industry 2019 & 2032
- Table 64: Global 3D Printing Powder Market Volume K Tons Forecast, by End-user Industry 2019 & 2032
- Table 65: Global 3D Printing Powder Market Revenue Million Forecast, by Country 2019 & 2032
- Table 66: Global 3D Printing Powder Market Volume K Tons Forecast, by Country 2019 & 2032
- Table 67: China 3D Printing Powder Market Revenue (Million) Forecast, by Application 2019 & 2032
- Table 68: China 3D Printing Powder Market Volume (K Tons) Forecast, by Application 2019 & 2032
- Table 69: India 3D Printing Powder Market Revenue (Million) Forecast, by Application 2019 & 2032
- Table 70: India 3D Printing Powder Market Volume (K Tons) Forecast, by Application 2019 & 2032
- Table 71: Japan 3D Printing Powder Market Revenue (Million) Forecast, by Application 2019 & 2032
- Table 72: Japan 3D Printing Powder Market Volume (K Tons) Forecast, by Application 2019 & 2032
- Table 73: South Korea 3D Printing Powder Market Revenue (Million) Forecast, by Application 2019 & 2032
- Table 74: South Korea 3D Printing Powder Market Volume (K Tons) Forecast, by Application 2019 & 2032
- Table 75: Rest of Asia Pacific 3D Printing Powder Market Revenue (Million) Forecast, by Application 2019 & 2032
- Table 76: Rest of Asia Pacific 3D Printing Powder Market Volume (K Tons) Forecast, by Application 2019 & 2032
- Table 77: Global 3D Printing Powder Market Revenue Million Forecast, by Powder Type 2019 & 2032
- Table 78: Global 3D Printing Powder Market Volume K Tons Forecast, by Powder Type 2019 & 2032
- Table 79: Global 3D Printing Powder Market Revenue Million Forecast, by End-user Industry 2019 & 2032
- Table 80: Global 3D Printing Powder Market Volume K Tons Forecast, by End-user Industry 2019 & 2032
- Table 81: Global 3D Printing Powder Market Revenue Million Forecast, by Country 2019 & 2032
- Table 82: Global 3D Printing Powder Market Volume K Tons Forecast, by Country 2019 & 2032
- Table 83: United States 3D Printing Powder Market Revenue (Million) Forecast, by Application 2019 & 2032
- Table 84: United States 3D Printing Powder Market Volume (K Tons) Forecast, by Application 2019 & 2032
- Table 85: Canada 3D Printing Powder Market Revenue (Million) Forecast, by Application 2019 & 2032
- Table 86: Canada 3D Printing Powder Market Volume (K Tons) Forecast, by Application 2019 & 2032
- Table 87: Mexico 3D Printing Powder Market Revenue (Million) Forecast, by Application 2019 & 2032
- Table 88: Mexico 3D Printing Powder Market Volume (K Tons) Forecast, by Application 2019 & 2032
- Table 89: Global 3D Printing Powder Market Revenue Million Forecast, by Powder Type 2019 & 2032
- Table 90: Global 3D Printing Powder Market Volume K Tons Forecast, by Powder Type 2019 & 2032
- Table 91: Global 3D Printing Powder Market Revenue Million Forecast, by End-user Industry 2019 & 2032
- Table 92: Global 3D Printing Powder Market Volume K Tons Forecast, by End-user Industry 2019 & 2032
- Table 93: Global 3D Printing Powder Market Revenue Million Forecast, by Country 2019 & 2032
- Table 94: Global 3D Printing Powder Market Volume K Tons Forecast, by Country 2019 & 2032
- Table 95: Germany 3D Printing Powder Market Revenue (Million) Forecast, by Application 2019 & 2032
- Table 96: Germany 3D Printing Powder Market Volume (K Tons) Forecast, by Application 2019 & 2032
- Table 97: United Kingdom 3D Printing Powder Market Revenue (Million) Forecast, by Application 2019 & 2032
- Table 98: United Kingdom 3D Printing Powder Market Volume (K Tons) Forecast, by Application 2019 & 2032
- Table 99: France 3D Printing Powder Market Revenue (Million) Forecast, by Application 2019 & 2032
- Table 100: France 3D Printing Powder Market Volume (K Tons) Forecast, by Application 2019 & 2032
- Table 101: Italy 3D Printing Powder Market Revenue (Million) Forecast, by Application 2019 & 2032
- Table 102: Italy 3D Printing Powder Market Volume (K Tons) Forecast, by Application 2019 & 2032
- Table 103: Rest of Europe 3D Printing Powder Market Revenue (Million) Forecast, by Application 2019 & 2032
- Table 104: Rest of Europe 3D Printing Powder Market Volume (K Tons) Forecast, by Application 2019 & 2032
- Table 105: Global 3D Printing Powder Market Revenue Million Forecast, by Powder Type 2019 & 2032
- Table 106: Global 3D Printing Powder Market Volume K Tons Forecast, by Powder Type 2019 & 2032
- Table 107: Global 3D Printing Powder Market Revenue Million Forecast, by End-user Industry 2019 & 2032
- Table 108: Global 3D Printing Powder Market Volume K Tons Forecast, by End-user Industry 2019 & 2032
- Table 109: Global 3D Printing Powder Market Revenue Million Forecast, by Country 2019 & 2032
- Table 110: Global 3D Printing Powder Market Volume K Tons Forecast, by Country 2019 & 2032
- Table 111: Brazil 3D Printing Powder Market Revenue (Million) Forecast, by Application 2019 & 2032
- Table 112: Brazil 3D Printing Powder Market Volume (K Tons) Forecast, by Application 2019 & 2032
- Table 113: Argentina 3D Printing Powder Market Revenue (Million) Forecast, by Application 2019 & 2032
- Table 114: Argentina 3D Printing Powder Market Volume (K Tons) Forecast, by Application 2019 & 2032
- Table 115: Rest of South America 3D Printing Powder Market Revenue (Million) Forecast, by Application 2019 & 2032
- Table 116: Rest of South America 3D Printing Powder Market Volume (K Tons) Forecast, by Application 2019 & 2032
- Table 117: Global 3D Printing Powder Market Revenue Million Forecast, by Powder Type 2019 & 2032
- Table 118: Global 3D Printing Powder Market Volume K Tons Forecast, by Powder Type 2019 & 2032
- Table 119: Global 3D Printing Powder Market Revenue Million Forecast, by End-user Industry 2019 & 2032
- Table 120: Global 3D Printing Powder Market Volume K Tons Forecast, by End-user Industry 2019 & 2032
- Table 121: Global 3D Printing Powder Market Revenue Million Forecast, by Country 2019 & 2032
- Table 122: Global 3D Printing Powder Market Volume K Tons Forecast, by Country 2019 & 2032
- Table 123: Saudi Arabia 3D Printing Powder Market Revenue (Million) Forecast, by Application 2019 & 2032
- Table 124: Saudi Arabia 3D Printing Powder Market Volume (K Tons) Forecast, by Application 2019 & 2032
- Table 125: South Africa 3D Printing Powder Market Revenue (Million) Forecast, by Application 2019 & 2032
- Table 126: South Africa 3D Printing Powder Market Volume (K Tons) Forecast, by Application 2019 & 2032
- Table 127: Rest of Middle East and Africa 3D Printing Powder Market Revenue (Million) Forecast, by Application 2019 & 2032
- Table 128: Rest of Middle East and Africa 3D Printing Powder Market Volume (K Tons) Forecast, by Application 2019 & 2032
Frequently Asked Questions
1. What is the projected Compound Annual Growth Rate (CAGR) of the 3D Printing Powder Market?
The projected CAGR is approximately > 16.50%.
2. Which companies are prominent players in the 3D Printing Powder Market?
Key companies in the market include Arkema, Sandvik AB, Höganäs AB, Evonik Industries AG, BASF SE, Metalysis, ERASTEEL, GKN Powder Metallurgy, ExOne.
3. What are the main segments of the 3D Printing Powder Market?
The market segments include Powder Type, End-user Industry.
4. Can you provide details about the market size?
The market size is estimated to be USD 2.06 Million as of 2022.
5. What are some drivers contributing to market growth?
Increasing Applications in Aerospace and Automobile Industries; Growing Demand from Medical Sector; Other Drivers.
6. What are the notable trends driving market growth?
Growing Demand from Automobile Sector.
7. Are there any restraints impacting market growth?
HIgh Material and Post Processing Cost; Hazardous in Nature.
8. Can you provide examples of recent developments in the market?
N/A
9. What pricing options are available for accessing the report?
Pricing options include single-user, multi-user, and enterprise licenses priced at USD 4750, USD 5250, and USD 8750 respectively.
10. Is the market size provided in terms of value or volume?
The market size is provided in terms of value, measured in Million and volume, measured in K Tons.
11. Are there any specific market keywords associated with the report?
Yes, the market keyword associated with the report is "3D Printing Powder Market," which aids in identifying and referencing the specific market segment covered.
12. How do I determine which pricing option suits my needs best?
The pricing options vary based on user requirements and access needs. Individual users may opt for single-user licenses, while businesses requiring broader access may choose multi-user or enterprise licenses for cost-effective access to the report.
13. Are there any additional resources or data provided in the 3D Printing Powder Market report?
While the report offers comprehensive insights, it's advisable to review the specific contents or supplementary materials provided to ascertain if additional resources or data are available.
14. How can I stay updated on further developments or reports in the 3D Printing Powder Market?
To stay informed about further developments, trends, and reports in the 3D Printing Powder Market, consider subscribing to industry newsletters, following relevant companies and organizations, or regularly checking reputable industry news sources and publications.
Methodology
Step 1 - Identification of Relevant Samples Size from Population Database


Step 2 - Approaches for Defining Global Market Size (Value, Volume* & Price*)

Note*: In applicable scenarios
Step 3 - Data Sources
Primary Research
- Web Analytics
- Survey Reports
- Research Institute
- Latest Research Reports
- Opinion Leaders
Secondary Research
- Annual Reports
- White Paper
- Latest Press Release
- Industry Association
- Paid Database
- Investor Presentations

Step 4 - Data Triangulation
Involves using different sources of information in order to increase the validity of a study
These sources are likely to be stakeholders in a program - participants, other researchers, program staff, other community members, and so on.
Then we put all data in single framework & apply various statistical tools to find out the dynamic on the market.
During the analysis stage, feedback from the stakeholder groups would be compared to determine areas of agreement as well as areas of divergence


