Key Insights
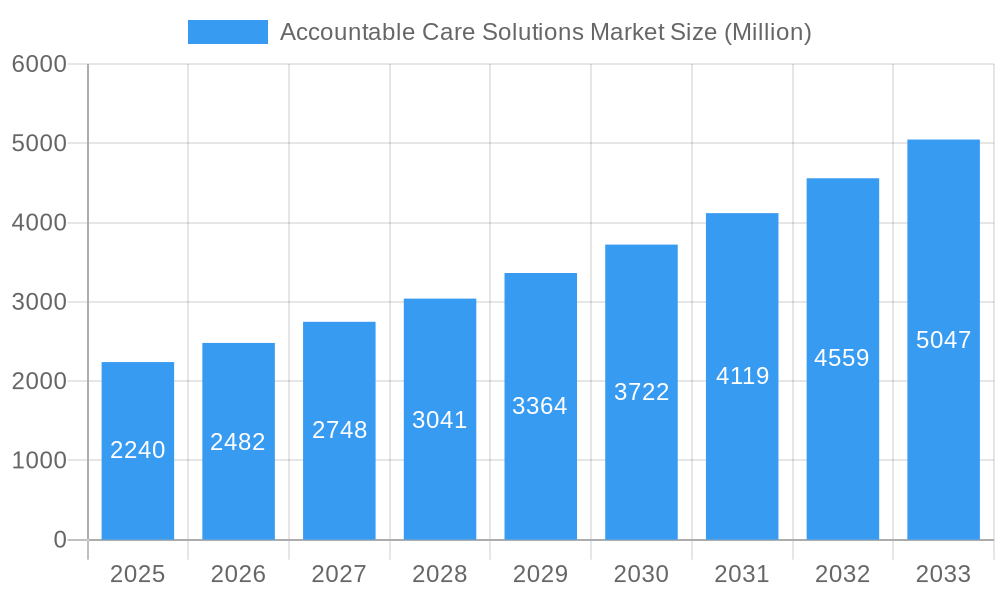
The Accountable Care Solutions (ACS) market, valued at $2.24 billion in 2025, is projected to experience robust growth, driven by a Compound Annual Growth Rate (CAGR) of 10.92% from 2025 to 2033. This expansion is fueled by several key factors. Increasing government initiatives promoting value-based care models are incentivizing healthcare providers to adopt ACS solutions for improved patient outcomes and cost efficiency. The rising prevalence of chronic diseases necessitates more coordinated and proactive care, which ACS effectively addresses. Furthermore, technological advancements in Electronic Health Records (EHRs), healthcare analytics, and cloud-based solutions are enhancing the efficiency and scalability of ACS platforms. The market's segmentation reveals significant opportunities across various product and service offerings, including Electronic Health/Medical Records (EHR/EMR), revenue cycle management (RCM), claims and payment management solutions, and support and maintenance services. Deployment models span on-premise, web, and cloud-based solutions, catering to diverse organizational preferences and technological infrastructure. Key players like McKesson, Allscripts, Epic Systems, and others are continuously innovating to meet the growing market demands, leading to a competitive yet dynamic landscape.
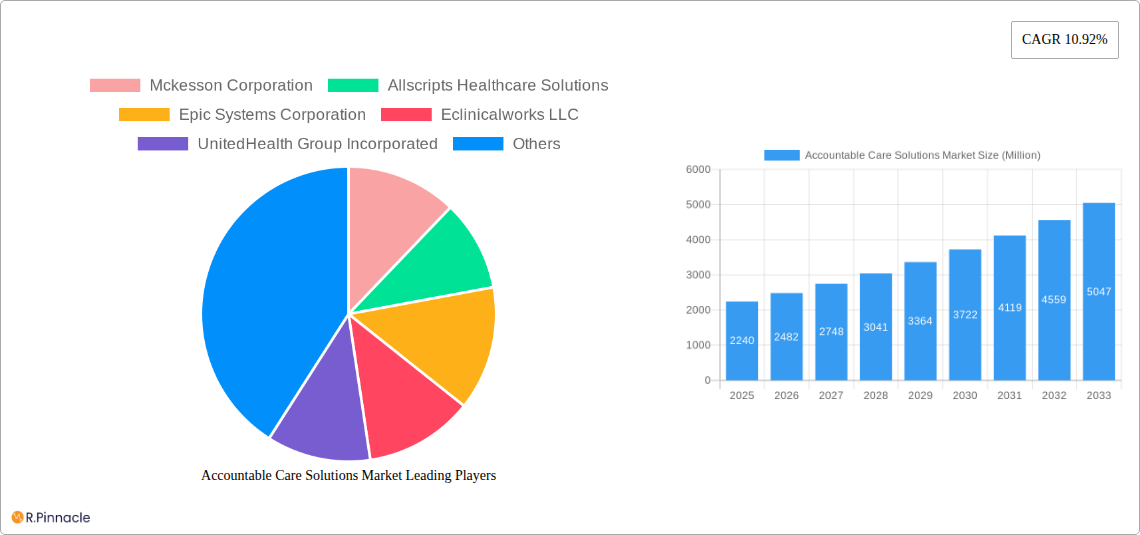
Accountable Care Solutions Market Market Size (In Billion)
The geographical distribution of the ACS market reflects a significant presence in North America, fueled by advanced healthcare infrastructure and strong government support for value-based care. Europe and Asia-Pacific are also witnessing considerable growth, driven by increasing healthcare expenditure and the adoption of digital health technologies. However, challenges remain, such as interoperability issues between different systems, data security concerns, and the high initial investment costs associated with implementing ACS solutions. Overcoming these hurdles will be crucial for sustaining the market's projected growth trajectory. The market's future success hinges on continuous advancements in technology, enhanced data analytics capabilities, and robust regulatory support to ensure seamless data exchange and patient privacy. The long-term outlook remains positive, with significant potential for expansion driven by the global shift towards value-based care and the increasing demand for efficient, integrated healthcare solutions.
Accountable Care Solutions Market Company Market Share
Accountable Care Solutions Market Report: 2019-2033
This comprehensive report provides a detailed analysis of the Accountable Care Solutions market, offering invaluable insights for industry professionals, investors, and strategic decision-makers. Covering the period from 2019 to 2033, with a focus on 2025, this report unveils market trends, growth drivers, challenges, and opportunities within this dynamic sector. The report is meticulously structured for easy navigation and actionable insights.
Accountable Care Solutions Market Structure & Innovation Trends
The Accountable Care Solutions (ACS) market exhibits a moderately concentrated structure, with key players like McKesson Corporation, Allscripts Healthcare Solutions, and Epic Systems Corporation holding significant market share. However, the market also accommodates a number of smaller, specialized players, fostering innovation and competition. The estimated market share of these top three players in 2025 is approximately 40%, indicating room for growth among smaller companies. The market is driven by increasing adoption of electronic health records (EHRs), growing demand for healthcare analytics, and the rising need for efficient revenue cycle management. Regulatory frameworks like HIPAA compliance and evolving reimbursement models significantly influence market dynamics. The increasing use of cloud-based solutions is a key trend, replacing traditional on-premise systems. Mergers and acquisitions (M&A) play a significant role in market consolidation. For example, in 2024, the combined M&A deal value in the ACS market reached approximately $xx Million, showcasing the dynamic nature of the market. Key innovation drivers include the development of AI-powered solutions for predictive analytics and personalized care, improving interoperability of health information systems and the rise of value-based care models. Product substitutes include legacy systems and inefficient manual processes. The end-user demographics are primarily healthcare providers and payers, with a notable shift toward greater adoption by smaller practices and rural hospitals.
Accountable Care Solutions Market Market Dynamics & Trends
The Accountable Care Solutions market is experiencing robust growth, driven by several factors. The global market is expected to reach $xx Million by 2033, exhibiting a Compound Annual Growth Rate (CAGR) of xx% during the forecast period (2025-2033). Market penetration for cloud-based solutions is steadily increasing, exceeding xx% in 2025. Technological disruptions, particularly the integration of artificial intelligence and machine learning into healthcare analytics, are significantly enhancing the capabilities of ACS. Consumer preferences are shifting toward personalized and proactive healthcare, requiring more sophisticated solutions. Competitive dynamics involve both organic growth through product innovation and inorganic growth through strategic acquisitions. The shift towards value-based care is a major driver, pushing providers and payers to adopt ACS to improve efficiency and manage costs effectively. This is further propelled by the growing emphasis on population health management and the increasing pressure to reduce healthcare expenditures.
Dominant Regions & Segments in Accountable Care Solutions Market
The North American market currently dominates the global Accountable Care Solutions market, driven by robust healthcare IT infrastructure, advanced technological adoption, and favorable regulatory environments. Within North America, the United States holds the largest market share.
Key Drivers in North America:
- Strong government support and funding for healthcare IT initiatives.
- High adoption of EHRs and other digital health technologies.
- Growing number of accountable care organizations (ACOs).
- Favorable reimbursement policies that incentivize value-based care.
Dominant Segments:
- Product & Services: Electronic Health/Medical Records (EHR) systems lead the segment due to their widespread adoption and regulatory mandates. Healthcare analytics and Revenue Cycle Management (RCM) solutions are also experiencing significant growth.
- Deployment: Web and cloud-based solutions are rapidly gaining traction over on-premise deployments due to scalability, cost-effectiveness, and accessibility.
- End User: Healthcare providers represent the dominant end-user segment, followed by healthcare payers, who are increasingly adopting ACS to optimize network performance and manage costs.
The European market is also exhibiting substantial growth, driven by increasing government investments in digital health initiatives and growing demand for improved healthcare efficiency. Asia-Pacific is projected to experience the fastest growth rate in the coming years, owing to expanding healthcare infrastructure and rising healthcare expenditure.
Accountable Care Solutions Market Product Innovations
Recent product innovations within the Accountable Care Solutions market include advancements in AI-powered predictive analytics, improved interoperability between healthcare systems, and the development of patient portals for enhanced engagement. These innovations aim to streamline workflow, enhance patient care, and reduce administrative burdens. The market is witnessing a convergence of healthcare IT and data analytics, leading to the development of more integrated and comprehensive solutions. The focus on value-based care is driving the creation of products that track and manage patient outcomes efficiently.
Report Scope & Segmentation Analysis
This report segments the Accountable Care Solutions market by product & services (Electronic Health/Medical Records, Healthcare Analytics, RCM, Claims Management, Payment Management, Support & Maintenance, Other), deployment (On-premise, Web & Cloud-Based), and end-user (Healthcare Providers, Healthcare Payers). Each segment's growth projection, market size (in Millions), and competitive dynamics are analyzed in detail. The market is expected to witness significant growth in all segments, particularly in cloud-based solutions and healthcare analytics.
Key Drivers of Accountable Care Solutions Market Growth
The Accountable Care Solutions market's growth is primarily driven by the increasing adoption of value-based care models, rising demand for improved healthcare efficiency, technological advancements in data analytics and AI, and government initiatives promoting the use of electronic health records and other digital health technologies. Stringent regulatory compliance requirements also accelerate the adoption of solutions designed for data security and interoperability.
Challenges in the Accountable Care Solutions Market Sector
Challenges in the Accountable Care Solutions market include high implementation costs, complexities associated with data integration and interoperability, concerns regarding data security and privacy, and the resistance to adopting new technologies by some healthcare providers. These challenges lead to delays in implementation and hinder market growth to some extent. The limited resources and technical expertise of smaller healthcare facilities also present a barrier to entry.
Emerging Opportunities in Accountable Care Solutions Market
Emerging opportunities include the growing demand for personalized medicine and preventative care, the expanding use of telemedicine and remote patient monitoring, and the increasing focus on population health management. These trends are creating new avenues for ACS providers to develop innovative solutions that address the evolving needs of the healthcare industry. Furthermore, expansion into underserved markets, both geographically and demographically, offers significant growth potential.
Leading Players in the Accountable Care Solutions Market Market
Key Developments in Accountable Care Solutions Market Industry
- March 2022: Collaborative Health Systems and Community Care Alliance entered a joint venture to expand accountable care services.
- March 2022: The Centers for Medicare & Medicaid Services (CMS) introduced the REACH model, replacing the GPDC model, impacting the market dynamics and incentivizing new approaches to value-based care.
Future Outlook for Accountable Care Solutions Market Market
The Accountable Care Solutions market is poised for continued strong growth, driven by sustained technological advancements, increasing demand for efficient and cost-effective healthcare solutions, and the ongoing transition to value-based care. Strategic partnerships and acquisitions will further shape the market landscape, enhancing capabilities and expanding market reach. The integration of AI and machine learning into ACS promises to revolutionize patient care and improve health outcomes, creating significant opportunities for growth in the coming years.
Accountable Care Solutions Market Segmentation
-
1. Product & Services
- 1.1. Electronic Health/Medical Records
- 1.2. Healthcare Analytics
- 1.3. Revenue Cycle Management Solutions (RCM)
- 1.4. Claims Management Solutions
- 1.5. Payment Management Solutions
- 1.6. Support and Maintenance Services
- 1.7. Other Products & Services
-
2. Deployment
- 2.1. On-premise
- 2.2. Web & Cloud-Based
-
3. End User
- 3.1. Healthcare Providers
- 3.2. Healthcare Payers
Accountable Care Solutions Market Segmentation By Geography
-
1. North America
- 1.1. United States
- 1.2. Canada
- 1.3. Mexico
-
2. Europe
- 2.1. Germany
- 2.2. United Kingdom
- 2.3. France
- 2.4. Italy
- 2.5. Spain
- 2.6. Rest of Europe
-
3. Asia Pacific
- 3.1. China
- 3.2. Japan
- 3.3. India
- 3.4. Australia
- 3.5. South Korea
- 3.6. Rest of Asia Pacific
-
4. Middle East and Africa
- 4.1. GCC
- 4.2. South Africa
- 4.3. Rest of Middle East and Africa
-
5. South America
- 5.1. Brazil
- 5.2. Argentina
- 5.3. Rest of South America
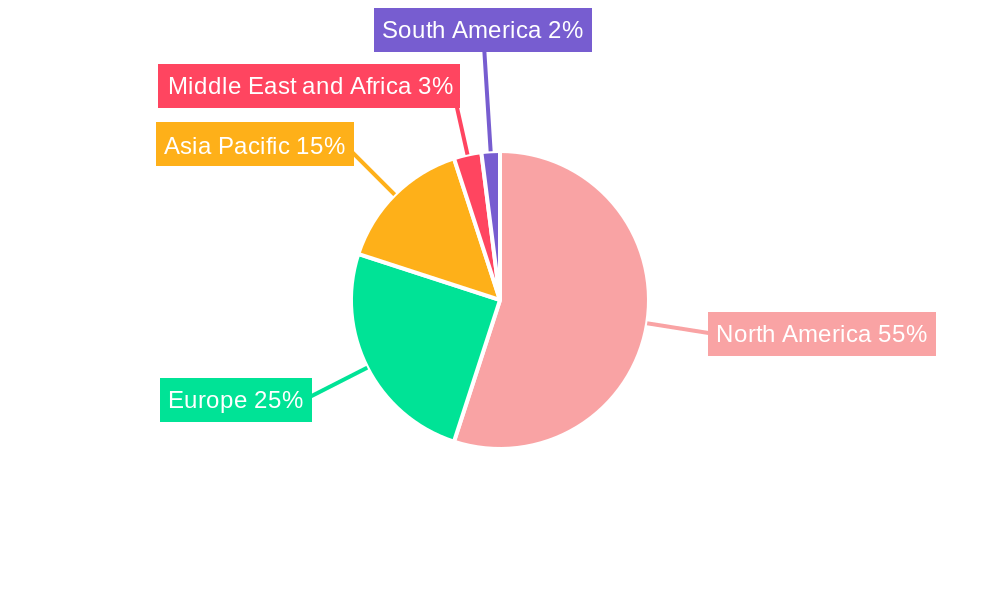
Accountable Care Solutions Market Regional Market Share
Geographic Coverage of Accountable Care Solutions Market
Accountable Care Solutions Market REPORT HIGHLIGHTS
| Aspects | Details |
|---|---|
| Study Period | 2020-2034 |
| Base Year | 2025 |
| Estimated Year | 2026 |
| Forecast Period | 2026-2034 |
| Historical Period | 2020-2025 |
| Growth Rate | CAGR of 10.92% from 2020-2034 |
| Segmentation |
|
Table of Contents
- 1. Introduction
- 1.1. Research Scope
- 1.2. Market Segmentation
- 1.3. Research Objective
- 1.4. Definitions and Assumptions
- 2. Executive Summary
- 2.1. Market Snapshot
- 3. Market Dynamics
- 3.1. Market Drivers
- 3.2. Market Restrains
- 3.3. Market Trends
- 3.4. Market Opportunities
- 4. Market Factor Analysis
- 4.1. Porters Five Forces
- 4.1.1. Bargaining Power of Suppliers
- 4.1.2. Bargaining Power of Buyers
- 4.1.3. Threat of New Entrants
- 4.1.4. Threat of Substitutes
- 4.1.5. Competitive Rivalry
- 4.2. PESTEL analysis
- 4.3. BCG Analysis
- 4.3.1. Stars (High Growth, High Market Share)
- 4.3.2. Cash Cows (Low Growth, High Market Share)
- 4.3.3. Question Mark (High Growth, Low Market Share)
- 4.3.4. Dogs (Low Growth, Low Market Share)
- 4.4. Ansoff Matrix Analysis
- 4.5. Supply Chain Analysis
- 4.6. Regulatory Landscape
- 4.7. Current Market Potential and Opportunity Assessment (TAM–SAM–SOM Framework)
- 4.8. PRI Analyst Note
- 4.1. Porters Five Forces
- 5. Market Analysis, Insights and Forecast 2021-2033
- 5.1. Market Analysis, Insights and Forecast - by Product & Services
- 5.1.1. Electronic Health/Medical Records
- 5.1.2. Healthcare Analytics
- 5.1.3. Revenue Cycle Management Solutions (RCM)
- 5.1.4. Claims Management Solutions
- 5.1.5. Payment Management Solutions
- 5.1.6. Support and Maintenance Services
- 5.1.7. Other Products & Services
- 5.2. Market Analysis, Insights and Forecast - by Deployment
- 5.2.1. On-premise
- 5.2.2. Web & Cloud-Based
- 5.3. Market Analysis, Insights and Forecast - by End User
- 5.3.1. Healthcare Providers
- 5.3.2. Healthcare Payers
- 5.4. Market Analysis, Insights and Forecast - by Region
- 5.4.1. North America
- 5.4.2. Europe
- 5.4.3. Asia Pacific
- 5.4.4. Middle East and Africa
- 5.4.5. South America
- 5.1. Market Analysis, Insights and Forecast - by Product & Services
- 6. Global Accountable Care Solutions Market Analysis, Insights and Forecast, 2021-2033
- 6.1. Market Analysis, Insights and Forecast - by Product & Services
- 6.1.1. Electronic Health/Medical Records
- 6.1.2. Healthcare Analytics
- 6.1.3. Revenue Cycle Management Solutions (RCM)
- 6.1.4. Claims Management Solutions
- 6.1.5. Payment Management Solutions
- 6.1.6. Support and Maintenance Services
- 6.1.7. Other Products & Services
- 6.2. Market Analysis, Insights and Forecast - by Deployment
- 6.2.1. On-premise
- 6.2.2. Web & Cloud-Based
- 6.3. Market Analysis, Insights and Forecast - by End User
- 6.3.1. Healthcare Providers
- 6.3.2. Healthcare Payers
- 6.1. Market Analysis, Insights and Forecast - by Product & Services
- 7. North America Accountable Care Solutions Market Analysis, Insights and Forecast, 2020-2032
- 7.1. Market Analysis, Insights and Forecast - by Product & Services
- 7.1.1. Electronic Health/Medical Records
- 7.1.2. Healthcare Analytics
- 7.1.3. Revenue Cycle Management Solutions (RCM)
- 7.1.4. Claims Management Solutions
- 7.1.5. Payment Management Solutions
- 7.1.6. Support and Maintenance Services
- 7.1.7. Other Products & Services
- 7.2. Market Analysis, Insights and Forecast - by Deployment
- 7.2.1. On-premise
- 7.2.2. Web & Cloud-Based
- 7.3. Market Analysis, Insights and Forecast - by End User
- 7.3.1. Healthcare Providers
- 7.3.2. Healthcare Payers
- 7.1. Market Analysis, Insights and Forecast - by Product & Services
- 8. Europe Accountable Care Solutions Market Analysis, Insights and Forecast, 2020-2032
- 8.1. Market Analysis, Insights and Forecast - by Product & Services
- 8.1.1. Electronic Health/Medical Records
- 8.1.2. Healthcare Analytics
- 8.1.3. Revenue Cycle Management Solutions (RCM)
- 8.1.4. Claims Management Solutions
- 8.1.5. Payment Management Solutions
- 8.1.6. Support and Maintenance Services
- 8.1.7. Other Products & Services
- 8.2. Market Analysis, Insights and Forecast - by Deployment
- 8.2.1. On-premise
- 8.2.2. Web & Cloud-Based
- 8.3. Market Analysis, Insights and Forecast - by End User
- 8.3.1. Healthcare Providers
- 8.3.2. Healthcare Payers
- 8.1. Market Analysis, Insights and Forecast - by Product & Services
- 9. Asia Pacific Accountable Care Solutions Market Analysis, Insights and Forecast, 2020-2032
- 9.1. Market Analysis, Insights and Forecast - by Product & Services
- 9.1.1. Electronic Health/Medical Records
- 9.1.2. Healthcare Analytics
- 9.1.3. Revenue Cycle Management Solutions (RCM)
- 9.1.4. Claims Management Solutions
- 9.1.5. Payment Management Solutions
- 9.1.6. Support and Maintenance Services
- 9.1.7. Other Products & Services
- 9.2. Market Analysis, Insights and Forecast - by Deployment
- 9.2.1. On-premise
- 9.2.2. Web & Cloud-Based
- 9.3. Market Analysis, Insights and Forecast - by End User
- 9.3.1. Healthcare Providers
- 9.3.2. Healthcare Payers
- 9.1. Market Analysis, Insights and Forecast - by Product & Services
- 10. Middle East and Africa Accountable Care Solutions Market Analysis, Insights and Forecast, 2020-2032
- 10.1. Market Analysis, Insights and Forecast - by Product & Services
- 10.1.1. Electronic Health/Medical Records
- 10.1.2. Healthcare Analytics
- 10.1.3. Revenue Cycle Management Solutions (RCM)
- 10.1.4. Claims Management Solutions
- 10.1.5. Payment Management Solutions
- 10.1.6. Support and Maintenance Services
- 10.1.7. Other Products & Services
- 10.2. Market Analysis, Insights and Forecast - by Deployment
- 10.2.1. On-premise
- 10.2.2. Web & Cloud-Based
- 10.3. Market Analysis, Insights and Forecast - by End User
- 10.3.1. Healthcare Providers
- 10.3.2. Healthcare Payers
- 10.1. Market Analysis, Insights and Forecast - by Product & Services
- 11. South America Accountable Care Solutions Market Analysis, Insights and Forecast, 2020-2032
- 11.1. Market Analysis, Insights and Forecast - by Product & Services
- 11.1.1. Electronic Health/Medical Records
- 11.1.2. Healthcare Analytics
- 11.1.3. Revenue Cycle Management Solutions (RCM)
- 11.1.4. Claims Management Solutions
- 11.1.5. Payment Management Solutions
- 11.1.6. Support and Maintenance Services
- 11.1.7. Other Products & Services
- 11.2. Market Analysis, Insights and Forecast - by Deployment
- 11.2.1. On-premise
- 11.2.2. Web & Cloud-Based
- 11.3. Market Analysis, Insights and Forecast - by End User
- 11.3.1. Healthcare Providers
- 11.3.2. Healthcare Payers
- 11.1. Market Analysis, Insights and Forecast - by Product & Services
- 12. Competitive Analysis
- 12.1. Company Profiles
- 12.1.1 Mckesson Corporation
- 12.1.1.1. Company Overview
- 12.1.1.2. Products
- 12.1.1.3. Company Financials
- 12.1.1.4. SWOT Analysis
- 12.1.2 Allscripts Healthcare Solutions
- 12.1.2.1. Company Overview
- 12.1.2.2. Products
- 12.1.2.3. Company Financials
- 12.1.2.4. SWOT Analysis
- 12.1.3 Epic Systems Corporation
- 12.1.3.1. Company Overview
- 12.1.3.2. Products
- 12.1.3.3. Company Financials
- 12.1.3.4. SWOT Analysis
- 12.1.4 Eclinicalworks LLC
- 12.1.4.1. Company Overview
- 12.1.4.2. Products
- 12.1.4.3. Company Financials
- 12.1.4.4. SWOT Analysis
- 12.1.5 UnitedHealth Group Incorporated
- 12.1.5.1. Company Overview
- 12.1.5.2. Products
- 12.1.5.3. Company Financials
- 12.1.5.4. SWOT Analysis
- 12.1.6 Verisk Analytics Inc
- 12.1.6.1. Company Overview
- 12.1.6.2. Products
- 12.1.6.3. Company Financials
- 12.1.6.4. SWOT Analysis
- 12.1.7 Constellation Software
- 12.1.7.1. Company Overview
- 12.1.7.2. Products
- 12.1.7.3. Company Financials
- 12.1.7.4. SWOT Analysis
- 12.1.8 IBM Healthcare
- 12.1.8.1. Company Overview
- 12.1.8.2. Products
- 12.1.8.3. Company Financials
- 12.1.8.4. SWOT Analysis
- 12.1.9 Cerner Corporation
- 12.1.9.1. Company Overview
- 12.1.9.2. Products
- 12.1.9.3. Company Financials
- 12.1.9.4. SWOT Analysis
- 12.1.10 ZeOmega Inc
- 12.1.10.1. Company Overview
- 12.1.10.2. Products
- 12.1.10.3. Company Financials
- 12.1.10.4. SWOT Analysis
- 12.1.11 Aetna Inc
- 12.1.11.1. Company Overview
- 12.1.11.2. Products
- 12.1.11.3. Company Financials
- 12.1.11.4. SWOT Analysis
- 12.1.12 Athenahealth Inc
- 12.1.12.1. Company Overview
- 12.1.12.2. Products
- 12.1.12.3. Company Financials
- 12.1.12.4. SWOT Analysis
- 12.1.1 Mckesson Corporation
- 12.2. Market Entropy
- 12.2.1 Company's Key Areas Served
- 12.2.2 Recent Developments
- 12.3. Company Market Share Analysis 2025
- 12.3.1 Top 5 Companies Market Share Analysis
- 12.3.2 Top 3 Companies Market Share Analysis
- 12.4. List of Potential Customers
- 13. Research Methodology
List of Figures
- Figure 1: Global Accountable Care Solutions Market Revenue Breakdown (Million, %) by Region 2025 & 2033
- Figure 2: Global Accountable Care Solutions Market Volume Breakdown (K Unit, %) by Region 2025 & 2033
- Figure 3: North America Accountable Care Solutions Market Revenue (Million), by Product & Services 2025 & 2033
- Figure 4: North America Accountable Care Solutions Market Volume (K Unit), by Product & Services 2025 & 2033
- Figure 5: North America Accountable Care Solutions Market Revenue Share (%), by Product & Services 2025 & 2033
- Figure 6: North America Accountable Care Solutions Market Volume Share (%), by Product & Services 2025 & 2033
- Figure 7: North America Accountable Care Solutions Market Revenue (Million), by Deployment 2025 & 2033
- Figure 8: North America Accountable Care Solutions Market Volume (K Unit), by Deployment 2025 & 2033
- Figure 9: North America Accountable Care Solutions Market Revenue Share (%), by Deployment 2025 & 2033
- Figure 10: North America Accountable Care Solutions Market Volume Share (%), by Deployment 2025 & 2033
- Figure 11: North America Accountable Care Solutions Market Revenue (Million), by End User 2025 & 2033
- Figure 12: North America Accountable Care Solutions Market Volume (K Unit), by End User 2025 & 2033
- Figure 13: North America Accountable Care Solutions Market Revenue Share (%), by End User 2025 & 2033
- Figure 14: North America Accountable Care Solutions Market Volume Share (%), by End User 2025 & 2033
- Figure 15: North America Accountable Care Solutions Market Revenue (Million), by Country 2025 & 2033
- Figure 16: North America Accountable Care Solutions Market Volume (K Unit), by Country 2025 & 2033
- Figure 17: North America Accountable Care Solutions Market Revenue Share (%), by Country 2025 & 2033
- Figure 18: North America Accountable Care Solutions Market Volume Share (%), by Country 2025 & 2033
- Figure 19: Europe Accountable Care Solutions Market Revenue (Million), by Product & Services 2025 & 2033
- Figure 20: Europe Accountable Care Solutions Market Volume (K Unit), by Product & Services 2025 & 2033
- Figure 21: Europe Accountable Care Solutions Market Revenue Share (%), by Product & Services 2025 & 2033
- Figure 22: Europe Accountable Care Solutions Market Volume Share (%), by Product & Services 2025 & 2033
- Figure 23: Europe Accountable Care Solutions Market Revenue (Million), by Deployment 2025 & 2033
- Figure 24: Europe Accountable Care Solutions Market Volume (K Unit), by Deployment 2025 & 2033
- Figure 25: Europe Accountable Care Solutions Market Revenue Share (%), by Deployment 2025 & 2033
- Figure 26: Europe Accountable Care Solutions Market Volume Share (%), by Deployment 2025 & 2033
- Figure 27: Europe Accountable Care Solutions Market Revenue (Million), by End User 2025 & 2033
- Figure 28: Europe Accountable Care Solutions Market Volume (K Unit), by End User 2025 & 2033
- Figure 29: Europe Accountable Care Solutions Market Revenue Share (%), by End User 2025 & 2033
- Figure 30: Europe Accountable Care Solutions Market Volume Share (%), by End User 2025 & 2033
- Figure 31: Europe Accountable Care Solutions Market Revenue (Million), by Country 2025 & 2033
- Figure 32: Europe Accountable Care Solutions Market Volume (K Unit), by Country 2025 & 2033
- Figure 33: Europe Accountable Care Solutions Market Revenue Share (%), by Country 2025 & 2033
- Figure 34: Europe Accountable Care Solutions Market Volume Share (%), by Country 2025 & 2033
- Figure 35: Asia Pacific Accountable Care Solutions Market Revenue (Million), by Product & Services 2025 & 2033
- Figure 36: Asia Pacific Accountable Care Solutions Market Volume (K Unit), by Product & Services 2025 & 2033
- Figure 37: Asia Pacific Accountable Care Solutions Market Revenue Share (%), by Product & Services 2025 & 2033
- Figure 38: Asia Pacific Accountable Care Solutions Market Volume Share (%), by Product & Services 2025 & 2033
- Figure 39: Asia Pacific Accountable Care Solutions Market Revenue (Million), by Deployment 2025 & 2033
- Figure 40: Asia Pacific Accountable Care Solutions Market Volume (K Unit), by Deployment 2025 & 2033
- Figure 41: Asia Pacific Accountable Care Solutions Market Revenue Share (%), by Deployment 2025 & 2033
- Figure 42: Asia Pacific Accountable Care Solutions Market Volume Share (%), by Deployment 2025 & 2033
- Figure 43: Asia Pacific Accountable Care Solutions Market Revenue (Million), by End User 2025 & 2033
- Figure 44: Asia Pacific Accountable Care Solutions Market Volume (K Unit), by End User 2025 & 2033
- Figure 45: Asia Pacific Accountable Care Solutions Market Revenue Share (%), by End User 2025 & 2033
- Figure 46: Asia Pacific Accountable Care Solutions Market Volume Share (%), by End User 2025 & 2033
- Figure 47: Asia Pacific Accountable Care Solutions Market Revenue (Million), by Country 2025 & 2033
- Figure 48: Asia Pacific Accountable Care Solutions Market Volume (K Unit), by Country 2025 & 2033
- Figure 49: Asia Pacific Accountable Care Solutions Market Revenue Share (%), by Country 2025 & 2033
- Figure 50: Asia Pacific Accountable Care Solutions Market Volume Share (%), by Country 2025 & 2033
- Figure 51: Middle East and Africa Accountable Care Solutions Market Revenue (Million), by Product & Services 2025 & 2033
- Figure 52: Middle East and Africa Accountable Care Solutions Market Volume (K Unit), by Product & Services 2025 & 2033
- Figure 53: Middle East and Africa Accountable Care Solutions Market Revenue Share (%), by Product & Services 2025 & 2033
- Figure 54: Middle East and Africa Accountable Care Solutions Market Volume Share (%), by Product & Services 2025 & 2033
- Figure 55: Middle East and Africa Accountable Care Solutions Market Revenue (Million), by Deployment 2025 & 2033
- Figure 56: Middle East and Africa Accountable Care Solutions Market Volume (K Unit), by Deployment 2025 & 2033
- Figure 57: Middle East and Africa Accountable Care Solutions Market Revenue Share (%), by Deployment 2025 & 2033
- Figure 58: Middle East and Africa Accountable Care Solutions Market Volume Share (%), by Deployment 2025 & 2033
- Figure 59: Middle East and Africa Accountable Care Solutions Market Revenue (Million), by End User 2025 & 2033
- Figure 60: Middle East and Africa Accountable Care Solutions Market Volume (K Unit), by End User 2025 & 2033
- Figure 61: Middle East and Africa Accountable Care Solutions Market Revenue Share (%), by End User 2025 & 2033
- Figure 62: Middle East and Africa Accountable Care Solutions Market Volume Share (%), by End User 2025 & 2033
- Figure 63: Middle East and Africa Accountable Care Solutions Market Revenue (Million), by Country 2025 & 2033
- Figure 64: Middle East and Africa Accountable Care Solutions Market Volume (K Unit), by Country 2025 & 2033
- Figure 65: Middle East and Africa Accountable Care Solutions Market Revenue Share (%), by Country 2025 & 2033
- Figure 66: Middle East and Africa Accountable Care Solutions Market Volume Share (%), by Country 2025 & 2033
- Figure 67: South America Accountable Care Solutions Market Revenue (Million), by Product & Services 2025 & 2033
- Figure 68: South America Accountable Care Solutions Market Volume (K Unit), by Product & Services 2025 & 2033
- Figure 69: South America Accountable Care Solutions Market Revenue Share (%), by Product & Services 2025 & 2033
- Figure 70: South America Accountable Care Solutions Market Volume Share (%), by Product & Services 2025 & 2033
- Figure 71: South America Accountable Care Solutions Market Revenue (Million), by Deployment 2025 & 2033
- Figure 72: South America Accountable Care Solutions Market Volume (K Unit), by Deployment 2025 & 2033
- Figure 73: South America Accountable Care Solutions Market Revenue Share (%), by Deployment 2025 & 2033
- Figure 74: South America Accountable Care Solutions Market Volume Share (%), by Deployment 2025 & 2033
- Figure 75: South America Accountable Care Solutions Market Revenue (Million), by End User 2025 & 2033
- Figure 76: South America Accountable Care Solutions Market Volume (K Unit), by End User 2025 & 2033
- Figure 77: South America Accountable Care Solutions Market Revenue Share (%), by End User 2025 & 2033
- Figure 78: South America Accountable Care Solutions Market Volume Share (%), by End User 2025 & 2033
- Figure 79: South America Accountable Care Solutions Market Revenue (Million), by Country 2025 & 2033
- Figure 80: South America Accountable Care Solutions Market Volume (K Unit), by Country 2025 & 2033
- Figure 81: South America Accountable Care Solutions Market Revenue Share (%), by Country 2025 & 2033
- Figure 82: South America Accountable Care Solutions Market Volume Share (%), by Country 2025 & 2033
List of Tables
- Table 1: Global Accountable Care Solutions Market Revenue Million Forecast, by Product & Services 2020 & 2033
- Table 2: Global Accountable Care Solutions Market Volume K Unit Forecast, by Product & Services 2020 & 2033
- Table 3: Global Accountable Care Solutions Market Revenue Million Forecast, by Deployment 2020 & 2033
- Table 4: Global Accountable Care Solutions Market Volume K Unit Forecast, by Deployment 2020 & 2033
- Table 5: Global Accountable Care Solutions Market Revenue Million Forecast, by End User 2020 & 2033
- Table 6: Global Accountable Care Solutions Market Volume K Unit Forecast, by End User 2020 & 2033
- Table 7: Global Accountable Care Solutions Market Revenue Million Forecast, by Region 2020 & 2033
- Table 8: Global Accountable Care Solutions Market Volume K Unit Forecast, by Region 2020 & 2033
- Table 9: Global Accountable Care Solutions Market Revenue Million Forecast, by Product & Services 2020 & 2033
- Table 10: Global Accountable Care Solutions Market Volume K Unit Forecast, by Product & Services 2020 & 2033
- Table 11: Global Accountable Care Solutions Market Revenue Million Forecast, by Deployment 2020 & 2033
- Table 12: Global Accountable Care Solutions Market Volume K Unit Forecast, by Deployment 2020 & 2033
- Table 13: Global Accountable Care Solutions Market Revenue Million Forecast, by End User 2020 & 2033
- Table 14: Global Accountable Care Solutions Market Volume K Unit Forecast, by End User 2020 & 2033
- Table 15: Global Accountable Care Solutions Market Revenue Million Forecast, by Country 2020 & 2033
- Table 16: Global Accountable Care Solutions Market Volume K Unit Forecast, by Country 2020 & 2033
- Table 17: United States Accountable Care Solutions Market Revenue (Million) Forecast, by Application 2020 & 2033
- Table 18: United States Accountable Care Solutions Market Volume (K Unit) Forecast, by Application 2020 & 2033
- Table 19: Canada Accountable Care Solutions Market Revenue (Million) Forecast, by Application 2020 & 2033
- Table 20: Canada Accountable Care Solutions Market Volume (K Unit) Forecast, by Application 2020 & 2033
- Table 21: Mexico Accountable Care Solutions Market Revenue (Million) Forecast, by Application 2020 & 2033
- Table 22: Mexico Accountable Care Solutions Market Volume (K Unit) Forecast, by Application 2020 & 2033
- Table 23: Global Accountable Care Solutions Market Revenue Million Forecast, by Product & Services 2020 & 2033
- Table 24: Global Accountable Care Solutions Market Volume K Unit Forecast, by Product & Services 2020 & 2033
- Table 25: Global Accountable Care Solutions Market Revenue Million Forecast, by Deployment 2020 & 2033
- Table 26: Global Accountable Care Solutions Market Volume K Unit Forecast, by Deployment 2020 & 2033
- Table 27: Global Accountable Care Solutions Market Revenue Million Forecast, by End User 2020 & 2033
- Table 28: Global Accountable Care Solutions Market Volume K Unit Forecast, by End User 2020 & 2033
- Table 29: Global Accountable Care Solutions Market Revenue Million Forecast, by Country 2020 & 2033
- Table 30: Global Accountable Care Solutions Market Volume K Unit Forecast, by Country 2020 & 2033
- Table 31: Germany Accountable Care Solutions Market Revenue (Million) Forecast, by Application 2020 & 2033
- Table 32: Germany Accountable Care Solutions Market Volume (K Unit) Forecast, by Application 2020 & 2033
- Table 33: United Kingdom Accountable Care Solutions Market Revenue (Million) Forecast, by Application 2020 & 2033
- Table 34: United Kingdom Accountable Care Solutions Market Volume (K Unit) Forecast, by Application 2020 & 2033
- Table 35: France Accountable Care Solutions Market Revenue (Million) Forecast, by Application 2020 & 2033
- Table 36: France Accountable Care Solutions Market Volume (K Unit) Forecast, by Application 2020 & 2033
- Table 37: Italy Accountable Care Solutions Market Revenue (Million) Forecast, by Application 2020 & 2033
- Table 38: Italy Accountable Care Solutions Market Volume (K Unit) Forecast, by Application 2020 & 2033
- Table 39: Spain Accountable Care Solutions Market Revenue (Million) Forecast, by Application 2020 & 2033
- Table 40: Spain Accountable Care Solutions Market Volume (K Unit) Forecast, by Application 2020 & 2033
- Table 41: Rest of Europe Accountable Care Solutions Market Revenue (Million) Forecast, by Application 2020 & 2033
- Table 42: Rest of Europe Accountable Care Solutions Market Volume (K Unit) Forecast, by Application 2020 & 2033
- Table 43: Global Accountable Care Solutions Market Revenue Million Forecast, by Product & Services 2020 & 2033
- Table 44: Global Accountable Care Solutions Market Volume K Unit Forecast, by Product & Services 2020 & 2033
- Table 45: Global Accountable Care Solutions Market Revenue Million Forecast, by Deployment 2020 & 2033
- Table 46: Global Accountable Care Solutions Market Volume K Unit Forecast, by Deployment 2020 & 2033
- Table 47: Global Accountable Care Solutions Market Revenue Million Forecast, by End User 2020 & 2033
- Table 48: Global Accountable Care Solutions Market Volume K Unit Forecast, by End User 2020 & 2033
- Table 49: Global Accountable Care Solutions Market Revenue Million Forecast, by Country 2020 & 2033
- Table 50: Global Accountable Care Solutions Market Volume K Unit Forecast, by Country 2020 & 2033
- Table 51: China Accountable Care Solutions Market Revenue (Million) Forecast, by Application 2020 & 2033
- Table 52: China Accountable Care Solutions Market Volume (K Unit) Forecast, by Application 2020 & 2033
- Table 53: Japan Accountable Care Solutions Market Revenue (Million) Forecast, by Application 2020 & 2033
- Table 54: Japan Accountable Care Solutions Market Volume (K Unit) Forecast, by Application 2020 & 2033
- Table 55: India Accountable Care Solutions Market Revenue (Million) Forecast, by Application 2020 & 2033
- Table 56: India Accountable Care Solutions Market Volume (K Unit) Forecast, by Application 2020 & 2033
- Table 57: Australia Accountable Care Solutions Market Revenue (Million) Forecast, by Application 2020 & 2033
- Table 58: Australia Accountable Care Solutions Market Volume (K Unit) Forecast, by Application 2020 & 2033
- Table 59: South Korea Accountable Care Solutions Market Revenue (Million) Forecast, by Application 2020 & 2033
- Table 60: South Korea Accountable Care Solutions Market Volume (K Unit) Forecast, by Application 2020 & 2033
- Table 61: Rest of Asia Pacific Accountable Care Solutions Market Revenue (Million) Forecast, by Application 2020 & 2033
- Table 62: Rest of Asia Pacific Accountable Care Solutions Market Volume (K Unit) Forecast, by Application 2020 & 2033
- Table 63: Global Accountable Care Solutions Market Revenue Million Forecast, by Product & Services 2020 & 2033
- Table 64: Global Accountable Care Solutions Market Volume K Unit Forecast, by Product & Services 2020 & 2033
- Table 65: Global Accountable Care Solutions Market Revenue Million Forecast, by Deployment 2020 & 2033
- Table 66: Global Accountable Care Solutions Market Volume K Unit Forecast, by Deployment 2020 & 2033
- Table 67: Global Accountable Care Solutions Market Revenue Million Forecast, by End User 2020 & 2033
- Table 68: Global Accountable Care Solutions Market Volume K Unit Forecast, by End User 2020 & 2033
- Table 69: Global Accountable Care Solutions Market Revenue Million Forecast, by Country 2020 & 2033
- Table 70: Global Accountable Care Solutions Market Volume K Unit Forecast, by Country 2020 & 2033
- Table 71: GCC Accountable Care Solutions Market Revenue (Million) Forecast, by Application 2020 & 2033
- Table 72: GCC Accountable Care Solutions Market Volume (K Unit) Forecast, by Application 2020 & 2033
- Table 73: South Africa Accountable Care Solutions Market Revenue (Million) Forecast, by Application 2020 & 2033
- Table 74: South Africa Accountable Care Solutions Market Volume (K Unit) Forecast, by Application 2020 & 2033
- Table 75: Rest of Middle East and Africa Accountable Care Solutions Market Revenue (Million) Forecast, by Application 2020 & 2033
- Table 76: Rest of Middle East and Africa Accountable Care Solutions Market Volume (K Unit) Forecast, by Application 2020 & 2033
- Table 77: Global Accountable Care Solutions Market Revenue Million Forecast, by Product & Services 2020 & 2033
- Table 78: Global Accountable Care Solutions Market Volume K Unit Forecast, by Product & Services 2020 & 2033
- Table 79: Global Accountable Care Solutions Market Revenue Million Forecast, by Deployment 2020 & 2033
- Table 80: Global Accountable Care Solutions Market Volume K Unit Forecast, by Deployment 2020 & 2033
- Table 81: Global Accountable Care Solutions Market Revenue Million Forecast, by End User 2020 & 2033
- Table 82: Global Accountable Care Solutions Market Volume K Unit Forecast, by End User 2020 & 2033
- Table 83: Global Accountable Care Solutions Market Revenue Million Forecast, by Country 2020 & 2033
- Table 84: Global Accountable Care Solutions Market Volume K Unit Forecast, by Country 2020 & 2033
- Table 85: Brazil Accountable Care Solutions Market Revenue (Million) Forecast, by Application 2020 & 2033
- Table 86: Brazil Accountable Care Solutions Market Volume (K Unit) Forecast, by Application 2020 & 2033
- Table 87: Argentina Accountable Care Solutions Market Revenue (Million) Forecast, by Application 2020 & 2033
- Table 88: Argentina Accountable Care Solutions Market Volume (K Unit) Forecast, by Application 2020 & 2033
- Table 89: Rest of South America Accountable Care Solutions Market Revenue (Million) Forecast, by Application 2020 & 2033
- Table 90: Rest of South America Accountable Care Solutions Market Volume (K Unit) Forecast, by Application 2020 & 2033
Frequently Asked Questions
1. What is the projected Compound Annual Growth Rate (CAGR) of the Accountable Care Solutions Market?
The projected CAGR is approximately 10.92%.
2. Which companies are prominent players in the Accountable Care Solutions Market?
Key companies in the market include Mckesson Corporation, Allscripts Healthcare Solutions, Epic Systems Corporation, Eclinicalworks LLC, UnitedHealth Group Incorporated, Verisk Analytics Inc, Constellation Software, IBM Healthcare, Cerner Corporation, ZeOmega Inc, Aetna Inc, Athenahealth Inc.
3. What are the main segments of the Accountable Care Solutions Market?
The market segments include Product & Services, Deployment, End User.
4. Can you provide details about the market size?
The market size is estimated to be USD 2.24 Million as of 2022.
5. What are some drivers contributing to market growth?
Emergence of Big Data in Healthcare; Government Regulations and Initiatives to Promote Patient-Centric Care; Increasing Demand to Curtail Healthcare Costs.
6. What are the notable trends driving market growth?
Electronic Health/Medical Records Segment is Expected to Hold a Significant Market Share Over the Forecast Period.
7. Are there any restraints impacting market growth?
Data Security and Privacy Concerns; High Investments Required for Supporting Infrastructure.
8. Can you provide examples of recent developments in the market?
In March 2022, Collaborative Health Systems, a population health management organization, and Community Care Alliance, an accountable care organization, entered into a venture.
9. What pricing options are available for accessing the report?
Pricing options include single-user, multi-user, and enterprise licenses priced at USD 4750, USD 5250, and USD 8750 respectively.
10. Is the market size provided in terms of value or volume?
The market size is provided in terms of value, measured in Million and volume, measured in K Unit.
11. Are there any specific market keywords associated with the report?
Yes, the market keyword associated with the report is "Accountable Care Solutions Market," which aids in identifying and referencing the specific market segment covered.
12. How do I determine which pricing option suits my needs best?
The pricing options vary based on user requirements and access needs. Individual users may opt for single-user licenses, while businesses requiring broader access may choose multi-user or enterprise licenses for cost-effective access to the report.
13. Are there any additional resources or data provided in the Accountable Care Solutions Market report?
While the report offers comprehensive insights, it's advisable to review the specific contents or supplementary materials provided to ascertain if additional resources or data are available.
14. How can I stay updated on further developments or reports in the Accountable Care Solutions Market?
To stay informed about further developments, trends, and reports in the Accountable Care Solutions Market, consider subscribing to industry newsletters, following relevant companies and organizations, or regularly checking reputable industry news sources and publications.
Methodology
Step 1 - Identification of Relevant Samples Size from Population Database


Step 2 - Approaches for Defining Global Market Size (Value, Volume* & Price*)

Note*: In applicable scenarios
Step 3 - Data Sources
Primary Research
- Web Analytics
- Survey Reports
- Research Institute
- Latest Research Reports
- Opinion Leaders
Secondary Research
- Annual Reports
- White Paper
- Latest Press Release
- Industry Association
- Paid Database
- Investor Presentations

Step 4 - Data Triangulation
Involves using different sources of information in order to increase the validity of a study
These sources are likely to be stakeholders in a program - participants, other researchers, program staff, other community members, and so on.
Then we put all data in single framework & apply various statistical tools to find out the dynamic on the market.
During the analysis stage, feedback from the stakeholder groups would be compared to determine areas of agreement as well as areas of divergence

