

Key Insights for Chromatography Data Systems Market
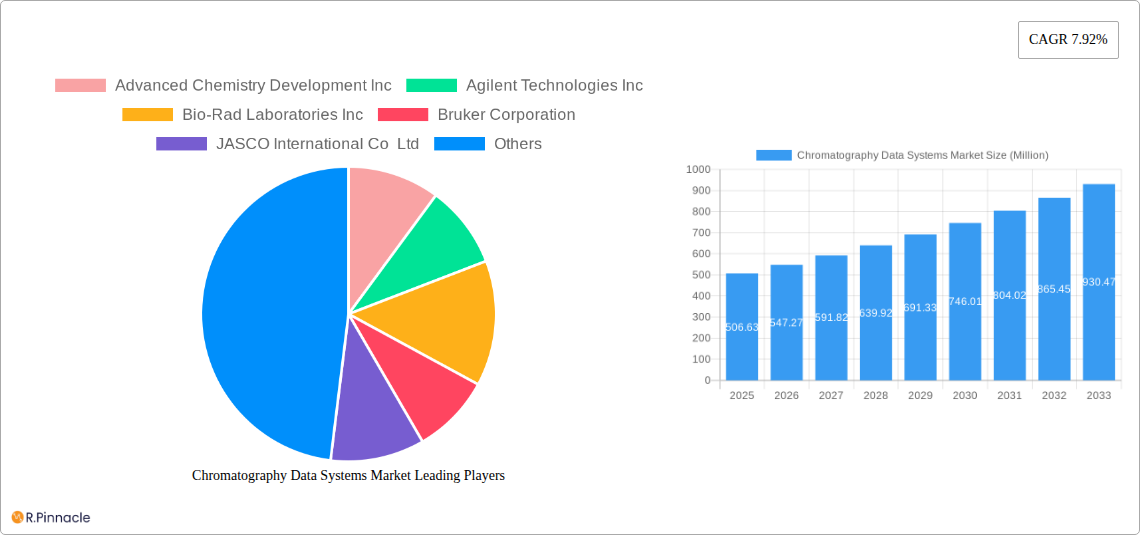
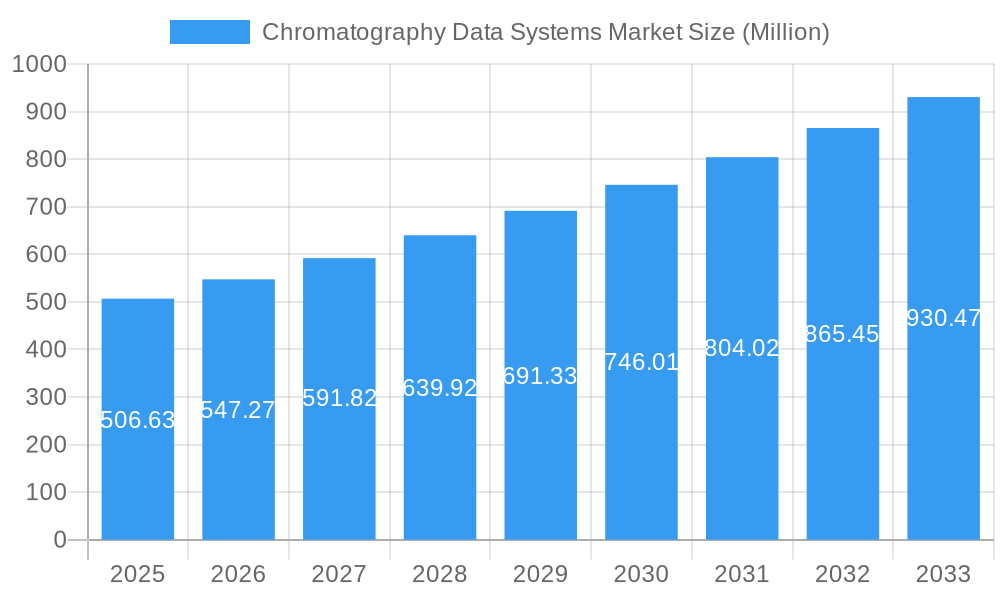
The Chromatography Data Systems Market, a critical component within the broader Healthcare IT Market, is experiencing robust expansion, driven by the escalating demand for analytical precision and data integrity across diverse scientific and industrial applications. Valued at an estimated $506.63 Million in 2024, the market is poised for significant growth, projected to reach approximately $1086.61 Million by 2034, exhibiting a compound annual growth rate (CAGR) of 7.92%. This trajectory is primarily fueled by rising research and development expenditures within the life sciences sector and the expanding requirements for rigorous food testing protocols globally.
Chromatography Data Systems Market Market Size (In Million)
The foundational drivers for this growth stem from the increasing complexity of analytical workflows and the stringent regulatory environments necessitating auditable, secure, and compliant data management solutions. Chromatography Data Systems (CDS) serve as the backbone for managing data generated by various chromatographic techniques, including gas chromatography (GC), high-performance liquid chromatography (HPLC), and ion chromatography (IC), among others. The proliferation of advanced analytical instrumentation inherently boosts the demand for sophisticated CDS platforms that can seamlessly integrate, process, and report complex datasets.
Chromatography Data Systems Market Company Market Share
Technological advancements are profoundly shaping the market landscape. A notable trend is the migration towards cloud-based deployment models, offering enhanced scalability, accessibility, and reduced infrastructure overhead, aligning with the broader Cloud-Based Software Market shift. This pivot is particularly appealing to Small & Medium Enterprises (SMEs) and geographically dispersed research entities. Furthermore, the integration of artificial intelligence (AI) and machine learning (ML) capabilities within CDS is enhancing data interpretation, predictive maintenance, and workflow optimization, contributing to a more efficient Laboratory Automation Market. The convergence of these technological innovations with regulatory pressures for data integrity, such as 21 CFR Part 11 compliance, positions the Chromatography Data Systems Market as a cornerstone for quality control, research, and development in the pharmaceutical, biotechnology, and food & beverage industries. The ongoing digital transformation across the life sciences is solidifying the role of robust CDS platforms, ensuring that analytical insights are accurate, traceable, and readily available for critical decision-making processes.
Cloud-Based Deployment Dominance in Chromatography Data Systems Market
The Chromatography Data Systems Market is witnessing a transformative shift towards cloud-based deployment models, a trend underscored by its projected substantial growth over the forecast period. While traditional on-premise solutions have historically dominated, offering direct control over infrastructure and data, the strategic advantages of cloud-based CDS are increasingly compelling, positioning this segment for future dominance. This evolution reflects a broader industry movement towards scalable, flexible, and accessible IT infrastructures, resonating with the expansion of the Cloud-Based Software Market across various sectors.
The appeal of cloud-based CDS lies in several key areas. Firstly, it significantly reduces the capital expenditure associated with purchasing and maintaining on-site servers, network infrastructure, and dedicated IT personnel. This cost-efficiency makes advanced analytical data management accessible to a wider range of organizations, particularly Small & Medium Enterprises (SMEs) that may lack the resources for extensive on-premise setups. Secondly, cloud solutions offer unparalleled scalability, allowing laboratories to effortlessly adjust computing resources and storage capacity based on fluctuating demand without disruptive hardware upgrades. This elasticity is crucial for contract research organizations (CROs) and biotechnology companies experiencing rapid project cycles or growth phases.
Furthermore, cloud-based Chromatography Data Systems enhance collaboration and accessibility. Scientists can access their data and analytical workflows from virtually anywhere, fostering remote work capabilities and facilitating data sharing across multi-site organizations or collaborative research networks. This improved accessibility also supports the overarching objectives of the Digital Health Market by enabling more interconnected and efficient data ecosystems. The inherent security architecture of reputable cloud providers, with advanced data encryption, regular backups, and disaster recovery protocols, often surpasses the capabilities of individual on-premise installations, addressing critical data integrity and compliance concerns in highly regulated environments like the Pharmaceutical Analytics Market.
Regulatory compliance, a paramount concern for users of Chromatography Data Systems, is also evolving with cloud adoption. Leading cloud-based CDS providers are developing solutions designed to meet stringent requirements such as FDA 21 CFR Part 11, offering audit trails, electronic signatures, and robust data security features that simplify validation efforts for end-users. This focus on compliance and data integrity is crucial for pharmaceutical companies, biotechnology companies, and CDMOs. As the life sciences sector continues its digital transformation journey, the inherent flexibility, cost-effectiveness, and collaborative capabilities of cloud-based deployment are poised to solidify its position as the largest and most influential segment within the Chromatography Data Systems Market, driving innovation and expanding access to advanced analytical capabilities across the globe.
Primary Drivers Powering the Chromatography Data Systems Market
The Chromatography Data Systems Market is experiencing robust growth propelled by two significant macroeconomic trends: the rising expenditures on research and development (R&D) within the life sciences sector and the growing demand for food testing. These drivers underscore the critical need for sophisticated data management and analytical tools to ensure precision, compliance, and efficiency in scientific and industrial processes.
Firstly, the substantial increase in R&D investments by pharmaceutical companies, biotechnology companies, and academic and research institutes is a primary catalyst. These organizations are continuously innovating, developing new drugs, therapies, and diagnostics, which inherently involve extensive analytical testing using techniques such as High-Performance Liquid Chromatography (HPLC) and Gas Chromatography (GC). Each analytical run generates vast amounts of data, necessitating advanced Chromatography Data Systems to manage, process, interpret, and archive this information reliably. The pursuit of new molecular entities, biologics, and gene therapies requires meticulous data integrity and traceability to meet regulatory standards globally, making a robust CDS an indispensable component of the drug discovery and development pipeline. The push for faster drug development cycles and personalized medicine further intensifies the demand for efficient and integrated data systems that can accelerate decision-making and reduce time-to-market. This trend also positively impacts the Pharmaceutical Analytics Market, as more R&D generates more analytical data requiring management.
Secondly, the growing demand for food testing due to increasing global food safety regulations, consumer awareness, and the complexity of the food supply chain is significantly boosting the Chromatography Data Systems Market. Governments and regulatory bodies worldwide are imposing stricter limits on contaminants, allergens, and residues in food products, driving the need for sophisticated analytical methods to detect and quantify these substances accurately. Chromatography techniques are foundational in food analysis for quality control, authenticity verification, and contaminant detection. As such, food testing laboratories, both public and private, require reliable and compliant CDS solutions to handle the high throughput of samples, ensure data accuracy, and generate auditable reports. The proliferation of international trade also necessitates harmonized testing standards and data reporting, which advanced CDS platforms facilitate. This surge in food safety consciousness and regulatory oversight directly translates into an amplified need for advanced analytical instrumentation and their accompanying data management systems.
Competitive Ecosystem of Chromatography Data Systems Market
The Chromatography Data Systems Market features a competitive landscape comprising established analytical instrument manufacturers and specialized software providers, each striving to offer comprehensive solutions for laboratory data management and compliance. Key players continuously innovate to meet evolving regulatory requirements and integrate new technologies.
- Advanced Chemistry Development Inc: This company specializes in cheminformatics software, providing solutions for analytical data processing, chemical structure elucidation, and chromatography prediction, offering a specialized suite that enhances analytical workflows for researchers.
- Agilent Technologies Inc: A global leader in life sciences, diagnostics, and applied chemical markets, Agilent offers a broad portfolio of CDS solutions, including OpenLab CDS, known for its scalability, compliance features, and integration with Agilent's extensive range of chromatography and Mass Spectrometry Market instruments.
- Bio-Rad Laboratories Inc: Bio-Rad provides a diverse range of products for the life science research and clinical diagnostics markets, including chromatography systems and software for data acquisition and analysis, catering to specific biotechnological and academic needs.
- Bruker Corporation: Known for its high-performance scientific instruments and analytical solutions, Bruker offers a range of CDS platforms that integrate with its chromatography and mass spectrometry systems, focusing on robust data handling and spectral analysis for complex samples.
- JASCO International Co Ltd: A prominent manufacturer of spectroscopic and chromatographic instruments, JASCO provides comprehensive CDS software designed to seamlessly control its instrumentation and manage analytical data with user-friendly interfaces.
- Justice Innovations Inc: This company focuses on delivering specialized software solutions, often for forensic and environmental laboratories, which includes robust data management and reporting capabilities for chromatography data, tailored to specific compliance needs.
- PerkinElmer Inc: A global leader in analytical instrumentation, PerkinElmer offers unified CDS platforms such as the SimplicityChrom software, designed to streamline workflows for various chromatographic techniques and ensure regulatory compliance, as demonstrated by its GC 2400 Platform.
- Shimadzu Corporation: A major provider of analytical and measuring instruments, Shimadzu offers powerful CDS software that integrates with its extensive lineup of HPLC, GC, and other analytical systems, emphasizing high throughput and data integrity.
- Thermo Fisher Scientific Inc: As a global leader in serving science, Thermo Fisher provides a wide array of laboratory products, including robust Chromatography Data Systems that integrate seamlessly with its diverse analytical instruments, supporting complex scientific applications and regulatory compliance.
- Waters Corporatio: A leading innovator in separation and analytical science, Waters offers the widely adopted Empower CDS, known for its enterprise-level capabilities, extensive instrument control, and compliance features, facilitating data management across various laboratory settings, including integration with other analytical systems like those in the Mass Spectrometry Market.
Recent Developments & Milestones in Chromatography Data Systems Market
The Chromatography Data Systems Market is continually evolving with strategic integrations, new product launches, and software enhancements aimed at improving laboratory efficiency, data integrity, and regulatory compliance.
- May 2023: Sciex Corporation, a United States-based manufacturer of mass spectrometry instrumentation, launched the BioPhase 8800 driver. This significant development enables the easy integration of the BioPhase 8800 system with the Empower chromatography data system from Waters Technologies Corporation, showcasing a trend towards broader system compatibility and streamlined data workflows, particularly beneficial in areas utilizing both chromatography and Mass Spectrometry Market technologies.
- January 2023: Waters Corporation announced the launch of waters_connect System Monitoring. This new Software-as-a-Service (SaaS) application represents a key innovation in the Chromatography Data Systems Market by allowing the real-time status monitoring of any chromatography instruments, irrespective of the manufacturer, that are running on Waters Empower Software. This development highlights the increasing importance of remote monitoring, predictive maintenance, and the adoption of cloud-based solutions to enhance laboratory operational efficiency and integrate into the broader Laboratory Automation Market.
- June 2022: PerkinElmer Inc. launched the GC 2400 Platform, an advanced, automated gas chromatography, headspace sampler, and gas chromatography/mass spectrometry solution. This platform is specifically designed to help lab teams simplify lab operations, drive precise results, and perform more flexible monitoring. Crucially, the platform’s 21 CFR Part 11 compliant SimplicityChrom chromatography data system significantly reduces user training requirements and guides teams through the entire gas chromatography workflow, emphasizing user-friendliness and adherence to regulatory standards within the Gas Chromatography Market segment.
Regional Market Breakdown for Chromatography Data Systems Market
The global Chromatography Data Systems Market exhibits distinct regional dynamics, influenced by varying levels of R&D investment, regulatory landscapes, and the maturity of pharmaceutical and biotechnology industries. While precise regional market sizes and CAGRs are proprietary, a comparative analysis reveals key trends across major geographical segments.
North America, encompassing the United States, Canada, and Mexico, stands as a leading region in the Chromatography Data Systems Market. This dominance is primarily attributed to the significant presence of major pharmaceutical companies, biotechnology companies, and contract research organizations (CROs), coupled with substantial R&D expenditures. The region also benefits from stringent regulatory frameworks, particularly in the U.S., which necessitate robust, compliant CDS solutions for data integrity and traceability. High adoption rates of advanced analytical instruments and a mature Healthcare IT Market infrastructure further bolster demand.
Europe, including Germany, the United Kingdom, France, Italy, and Spain, represents another mature and substantial market for Chromatography Data Systems. Similar to North America, Europe boasts a strong pharmaceutical and biotechnology sector, supported by significant government and private funding for life sciences research. The region's emphasis on quality control in food and environmental testing also drives the adoption of sophisticated CDS. European economies are early adopters of new technologies, and a strong focus on data governance and digitalization across industries contributes to steady market growth.
Asia Pacific, comprising China, Japan, India, Australia, and South Korea, is projected to be the fastest-growing region in the Chromatography Data Systems Market. This rapid expansion is fueled by increasing investments in healthcare infrastructure, a burgeoning pharmaceutical and biotechnology industry, and the expansion of academic and research institutes. Growing awareness of food safety and environmental monitoring, coupled with evolving regulatory frameworks, further stimulates demand for advanced analytical solutions. Countries like China and India are witnessing significant R&D spending and manufacturing expansion, leading to increased installation of chromatography instruments and subsequent demand for efficient data management systems. This growth parallels the expansion of the Biotechnology Instruments Market in the region.
Latin America (South America) and the Middle East and Africa (MEA) represent emerging markets for Chromatography Data Systems. While currently holding smaller market shares compared to developed regions, these areas are expected to demonstrate considerable growth. Factors such as improving healthcare infrastructure, increasing foreign investment in life sciences, and growing industrialization are driving the adoption of modern laboratory technologies. However, challenges related to infrastructure, regulatory harmonization, and economic stability may temper growth compared to the more developed and rapidly emerging Asian markets.
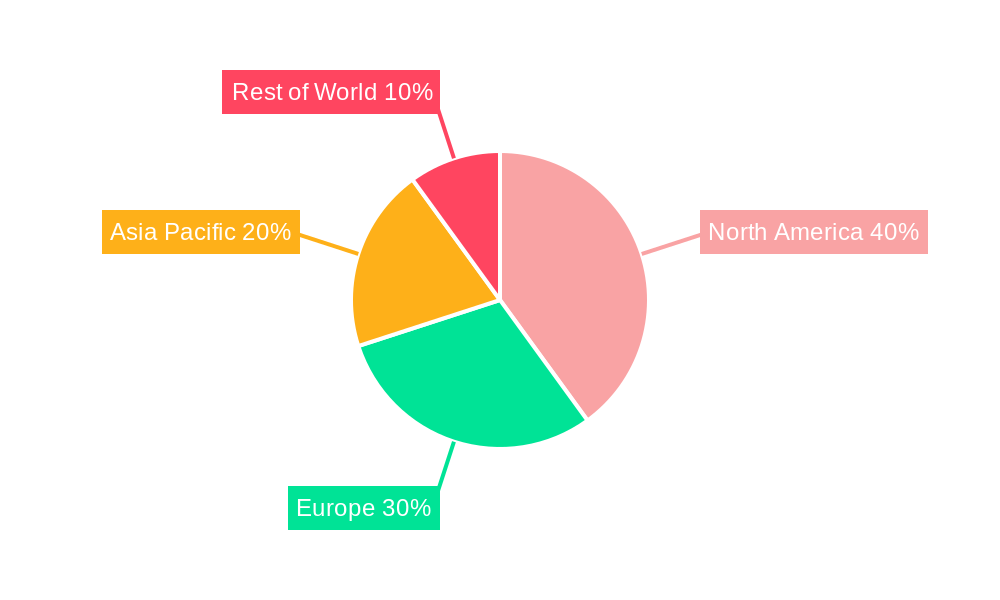
Chromatography Data Systems Market Regional Market Share
Technology Innovation Trajectory in Chromatography Data Systems Market
Innovation in the Chromatography Data Systems Market is rapidly evolving, driven by the demand for enhanced data insights, automation, and seamless integration within the modern laboratory. The most disruptive emerging technologies are centered around cloud integration, artificial intelligence (AI) and machine learning (ML), and advanced data visualization, each poised to redefine incumbent business models.
Cloud-based platforms, as highlighted by the growing Cloud-Based Software Market, are fundamentally altering how CDS are deployed and managed. The shift from on-premise to Software-as-a-Service (SaaS) models offers unparalleled scalability, accessibility, and cost-efficiency. This trend, exemplified by developments like Waters' waters_connect System Monitoring, is enabling real-time instrument monitoring and global data access, significantly lowering the barrier to entry for smaller labs and fostering distributed research networks. Adoption timelines are accelerating, with substantial R&D investments from key players focusing on ensuring cloud security, compliance (e.g., 21 CFR Part 11 validation in the cloud), and seamless integration with other Laboratory Information Management Systems Market solutions. This threatens traditional perpetual license models by offering subscription-based flexibility and continuous updates, compelling incumbent software providers to rapidly transition their offerings.
Artificial intelligence and machine learning are poised to revolutionize data interpretation and workflow optimization within Chromatography Data Systems. AI algorithms can automate peak identification, integration, and quantification, significantly reducing manual intervention and human error. Furthermore, ML models can predict instrument failures, optimize chromatographic methods, and even identify subtle trends in complex datasets that might be missed by human analysis. This has profound implications for the Pharmaceutical Analytics Market, where speed and accuracy are paramount. While still in nascent stages for broad adoption, R&D in this area is intense, with companies exploring how AI can enhance data quality, streamline method development, and facilitate regulatory submissions. This technology reinforces the value of CDS by transforming raw data into actionable intelligence, yet it demands significant R&D in robust algorithms and comprehensive data training sets.
Finally, advanced data visualization and analytics tools are becoming integral to next-generation CDS. Beyond traditional chromatograms, these innovations provide interactive dashboards, multivariate analysis capabilities, and tools for correlating chromatographic data with other analytical outputs, such as those from the Mass Spectrometry Market. This holistic data view supports more informed decision-making and accelerates research. Investments are focused on creating intuitive interfaces that present complex data in digestible formats, empowering scientists to derive deeper insights more efficiently. These innovations reinforce incumbent business models by enhancing the value proposition of integrated analytical platforms, making comprehensive data analysis accessible even to non-specialist users and contributing to the overall Digital Health Market ecosystem through improved data utility.
Export, Trade Flow & Tariff Impact on Chromatography Data Systems Market
The Chromatography Data Systems Market, primarily comprising software and associated services, is less directly impacted by traditional tariffs on physical goods but is significantly shaped by digital trade policies, data localization laws, and intellectual property (IP) regulations. Cross-border data flows and the provision of SaaS solutions form the core of its international trade dynamics.
Major trade corridors for CDS involve the flow of software licenses and cloud-based services from developed economies, particularly North America (United States) and Europe (Germany, UK), to global markets. The U.S. and European Union are leading exporters of high-value analytical software solutions, leveraging their strong R&D ecosystems and mature IT infrastructures. Importing nations are diverse, spanning rapidly industrializing economies in Asia Pacific (China, India, South Korea), which are expanding their pharmaceutical, biotechnology, and food testing capabilities, as well as countries in Latin America and the Middle East seeking to modernize their laboratory infrastructure.
Non-tariff barriers represent the most significant impact on the Chromatography Data Systems Market. Data localization laws, for instance, in countries like China, India, and Russia, mandate that data generated or processed within their borders must be stored on local servers. This necessitates significant investment from CDS providers in establishing local cloud infrastructure or partnering with in-country data centers, which can increase operational costs and complexity. Data privacy regulations, such as the General Data Protection Regulation (GDPR) in Europe, dictate strict rules for processing and transferring personal data, influencing how CDS handle data that might contain personally identifiable information (e.g., in clinical research settings). Compliance with these diverse regulatory landscapes creates substantial overheads for international CDS providers and can act as a barrier to market entry for smaller vendors.
Intellectual property protection is also crucial in the digital trade of CDS. Software piracy and the unauthorized use of licensed technologies pose ongoing challenges, particularly in emerging markets. Trade agreements often include provisions for IP protection, which can either facilitate or hinder the cross-border distribution of advanced software solutions. Recent geopolitical shifts and increased scrutiny on technology transfers can also affect the market, leading to restrictions on certain software exports or heightened compliance requirements. While direct tariffs on CDS software are rare, indirect impacts from tariffs on related Biotechnology Instruments Market or analytical hardware can affect overall laboratory investment, subsequently influencing the demand for integrated software solutions. The trend towards global digital trade agreements aims to harmonize some of these regulations, but fragmentation in data governance remains a key factor influencing the global flow and adoption of Chromatography Data Systems.
Chromatography Data Systems Market Segmentation
-
1. Type
- 1.1. Integrated CDS
- 1.2. Standalone CDS
-
2. Deployment Mode
- 2.1. On-Premise CDS
- 2.2. Cloud-Based CDS
- 2.3. Hybrid CDS
-
3. Enterprise Size
- 3.1. Large Enterprises
- 3.2. Small & Medium Enterprises (SMEs)
-
4. Technique
- 4.1. Gas Chromatography (GC)
- 4.2. High-Performance Liquid Chromatography (HPLC)
- 4.3. Ion Chromatography (IC)
- 4.4. Thin Layer Chromatography (TLC)
- 4.5. Supercritical Fluid Chromatography (SFC)
- 4.6. Others
-
5. End User
- 5.1. Pharmaceutical Companies
- 5.2. Biotechnology Companies
- 5.3. CROs
- 5.4. CDMOs
- 5.5. Academic and Research Institutes
- 5.6. Others
Chromatography Data Systems Market Segmentation By Geography
-
1. North America
- 1.1. United States
- 1.2. Canada
- 1.3. Mexico
-
2. Europe
- 2.1. Germany
- 2.2. United Kingdom
- 2.3. France
- 2.4. Italy
- 2.5. Spain
- 2.6. Rest of Europe
-
3. Asia Pacific
- 3.1. China
- 3.2. Japan
- 3.3. India
- 3.4. Australia
- 3.5. South Korea
- 3.6. Rest of Asia Pacific
-
4. Middle East and Africa
- 4.1. GCC
- 4.2. South Africa
- 4.3. Rest of Middle East and Africa
-
5. South America
- 5.1. Brazil
- 5.2. Argentina
- 5.3. Rest of South America
Chromatography Data Systems Market Regional Market Share
Geographic Coverage of Chromatography Data Systems Market
Chromatography Data Systems Market REPORT HIGHLIGHTS
| Aspects | Details |
|---|---|
| Study Period | 2020-2034 |
| Base Year | 2025 |
| Estimated Year | 2026 |
| Forecast Period | 2026-2034 |
| Historical Period | 2020-2025 |
| Growth Rate | CAGR of 7.92% from 2020-2034 |
| Segmentation |
|
Table of Contents
- 1. Introduction
- 1.1. Research Scope
- 1.2. Market Segmentation
- 1.3. Research Objective
- 1.4. Definitions and Assumptions
- 2. Executive Summary
- 2.1. Market Snapshot
- 3. Market Dynamics
- 3.1. Market Drivers
- 3.2. Market Restrains
- 3.3. Market Trends
- 3.4. Market Opportunities
- 4. Market Factor Analysis
- 4.1. Porters Five Forces
- 4.1.1. Bargaining Power of Suppliers
- 4.1.2. Bargaining Power of Buyers
- 4.1.3. Threat of New Entrants
- 4.1.4. Threat of Substitutes
- 4.1.5. Competitive Rivalry
- 4.2. PESTEL analysis
- 4.3. BCG Analysis
- 4.3.1. Stars (High Growth, High Market Share)
- 4.3.2. Cash Cows (Low Growth, High Market Share)
- 4.3.3. Question Mark (High Growth, Low Market Share)
- 4.3.4. Dogs (Low Growth, Low Market Share)
- 4.4. Ansoff Matrix Analysis
- 4.5. Supply Chain Analysis
- 4.6. Regulatory Landscape
- 4.7. Current Market Potential and Opportunity Assessment (TAM–SAM–SOM Framework)
- 4.8. PRI Analyst Note
- 4.1. Porters Five Forces
- 5. Market Analysis, Insights and Forecast 2021-2033
- 5.1. Market Analysis, Insights and Forecast - by Type
- 5.1.1. Integrated CDS
- 5.1.2. Standalone CDS
- 5.2. Market Analysis, Insights and Forecast - by Deployment Mode
- 5.2.1. On-Premise CDS
- 5.2.2. Cloud-Based CDS
- 5.2.3. Hybrid CDS
- 5.3. Market Analysis, Insights and Forecast - by Enterprise Size
- 5.3.1. Large Enterprises
- 5.3.2. Small & Medium Enterprises (SMEs)
- 5.4. Market Analysis, Insights and Forecast - by Technique
- 5.4.1. Gas Chromatography (GC)
- 5.4.2. High-Performance Liquid Chromatography (HPLC)
- 5.4.3. Ion Chromatography (IC)
- 5.4.4. Thin Layer Chromatography (TLC)
- 5.4.5. Supercritical Fluid Chromatography (SFC)
- 5.4.6. Others
- 5.5. Market Analysis, Insights and Forecast - by End User
- 5.5.1. Pharmaceutical Companies
- 5.5.2. Biotechnology Companies
- 5.5.3. CROs
- 5.5.4. CDMOs
- 5.5.5. Academic and Research Institutes
- 5.5.6. Others
- 5.6. Market Analysis, Insights and Forecast - by Region
- 5.6.1. North America
- 5.6.2. Europe
- 5.6.3. Asia Pacific
- 5.6.4. Middle East and Africa
- 5.6.5. South America
- 5.1. Market Analysis, Insights and Forecast - by Type
- 6. Global Chromatography Data Systems Market Analysis, Insights and Forecast, 2021-2033
- 6.1. Market Analysis, Insights and Forecast - by Type
- 6.1.1. Integrated CDS
- 6.1.2. Standalone CDS
- 6.2. Market Analysis, Insights and Forecast - by Deployment Mode
- 6.2.1. On-Premise CDS
- 6.2.2. Cloud-Based CDS
- 6.2.3. Hybrid CDS
- 6.3. Market Analysis, Insights and Forecast - by Enterprise Size
- 6.3.1. Large Enterprises
- 6.3.2. Small & Medium Enterprises (SMEs)
- 6.4. Market Analysis, Insights and Forecast - by Technique
- 6.4.1. Gas Chromatography (GC)
- 6.4.2. High-Performance Liquid Chromatography (HPLC)
- 6.4.3. Ion Chromatography (IC)
- 6.4.4. Thin Layer Chromatography (TLC)
- 6.4.5. Supercritical Fluid Chromatography (SFC)
- 6.4.6. Others
- 6.5. Market Analysis, Insights and Forecast - by End User
- 6.5.1. Pharmaceutical Companies
- 6.5.2. Biotechnology Companies
- 6.5.3. CROs
- 6.5.4. CDMOs
- 6.5.5. Academic and Research Institutes
- 6.5.6. Others
- 6.1. Market Analysis, Insights and Forecast - by Type
- 7. North America Chromatography Data Systems Market Analysis, Insights and Forecast, 2020-2032
- 7.1. Market Analysis, Insights and Forecast - by Type
- 7.1.1. Integrated CDS
- 7.1.2. Standalone CDS
- 7.2. Market Analysis, Insights and Forecast - by Deployment Mode
- 7.2.1. On-Premise CDS
- 7.2.2. Cloud-Based CDS
- 7.2.3. Hybrid CDS
- 7.3. Market Analysis, Insights and Forecast - by Enterprise Size
- 7.3.1. Large Enterprises
- 7.3.2. Small & Medium Enterprises (SMEs)
- 7.4. Market Analysis, Insights and Forecast - by Technique
- 7.4.1. Gas Chromatography (GC)
- 7.4.2. High-Performance Liquid Chromatography (HPLC)
- 7.4.3. Ion Chromatography (IC)
- 7.4.4. Thin Layer Chromatography (TLC)
- 7.4.5. Supercritical Fluid Chromatography (SFC)
- 7.4.6. Others
- 7.5. Market Analysis, Insights and Forecast - by End User
- 7.5.1. Pharmaceutical Companies
- 7.5.2. Biotechnology Companies
- 7.5.3. CROs
- 7.5.4. CDMOs
- 7.5.5. Academic and Research Institutes
- 7.5.6. Others
- 7.1. Market Analysis, Insights and Forecast - by Type
- 8. Europe Chromatography Data Systems Market Analysis, Insights and Forecast, 2020-2032
- 8.1. Market Analysis, Insights and Forecast - by Type
- 8.1.1. Integrated CDS
- 8.1.2. Standalone CDS
- 8.2. Market Analysis, Insights and Forecast - by Deployment Mode
- 8.2.1. On-Premise CDS
- 8.2.2. Cloud-Based CDS
- 8.2.3. Hybrid CDS
- 8.3. Market Analysis, Insights and Forecast - by Enterprise Size
- 8.3.1. Large Enterprises
- 8.3.2. Small & Medium Enterprises (SMEs)
- 8.4. Market Analysis, Insights and Forecast - by Technique
- 8.4.1. Gas Chromatography (GC)
- 8.4.2. High-Performance Liquid Chromatography (HPLC)
- 8.4.3. Ion Chromatography (IC)
- 8.4.4. Thin Layer Chromatography (TLC)
- 8.4.5. Supercritical Fluid Chromatography (SFC)
- 8.4.6. Others
- 8.5. Market Analysis, Insights and Forecast - by End User
- 8.5.1. Pharmaceutical Companies
- 8.5.2. Biotechnology Companies
- 8.5.3. CROs
- 8.5.4. CDMOs
- 8.5.5. Academic and Research Institutes
- 8.5.6. Others
- 8.1. Market Analysis, Insights and Forecast - by Type
- 9. Asia Pacific Chromatography Data Systems Market Analysis, Insights and Forecast, 2020-2032
- 9.1. Market Analysis, Insights and Forecast - by Type
- 9.1.1. Integrated CDS
- 9.1.2. Standalone CDS
- 9.2. Market Analysis, Insights and Forecast - by Deployment Mode
- 9.2.1. On-Premise CDS
- 9.2.2. Cloud-Based CDS
- 9.2.3. Hybrid CDS
- 9.3. Market Analysis, Insights and Forecast - by Enterprise Size
- 9.3.1. Large Enterprises
- 9.3.2. Small & Medium Enterprises (SMEs)
- 9.4. Market Analysis, Insights and Forecast - by Technique
- 9.4.1. Gas Chromatography (GC)
- 9.4.2. High-Performance Liquid Chromatography (HPLC)
- 9.4.3. Ion Chromatography (IC)
- 9.4.4. Thin Layer Chromatography (TLC)
- 9.4.5. Supercritical Fluid Chromatography (SFC)
- 9.4.6. Others
- 9.5. Market Analysis, Insights and Forecast - by End User
- 9.5.1. Pharmaceutical Companies
- 9.5.2. Biotechnology Companies
- 9.5.3. CROs
- 9.5.4. CDMOs
- 9.5.5. Academic and Research Institutes
- 9.5.6. Others
- 9.1. Market Analysis, Insights and Forecast - by Type
- 10. Middle East and Africa Chromatography Data Systems Market Analysis, Insights and Forecast, 2020-2032
- 10.1. Market Analysis, Insights and Forecast - by Type
- 10.1.1. Integrated CDS
- 10.1.2. Standalone CDS
- 10.2. Market Analysis, Insights and Forecast - by Deployment Mode
- 10.2.1. On-Premise CDS
- 10.2.2. Cloud-Based CDS
- 10.2.3. Hybrid CDS
- 10.3. Market Analysis, Insights and Forecast - by Enterprise Size
- 10.3.1. Large Enterprises
- 10.3.2. Small & Medium Enterprises (SMEs)
- 10.4. Market Analysis, Insights and Forecast - by Technique
- 10.4.1. Gas Chromatography (GC)
- 10.4.2. High-Performance Liquid Chromatography (HPLC)
- 10.4.3. Ion Chromatography (IC)
- 10.4.4. Thin Layer Chromatography (TLC)
- 10.4.5. Supercritical Fluid Chromatography (SFC)
- 10.4.6. Others
- 10.5. Market Analysis, Insights and Forecast - by End User
- 10.5.1. Pharmaceutical Companies
- 10.5.2. Biotechnology Companies
- 10.5.3. CROs
- 10.5.4. CDMOs
- 10.5.5. Academic and Research Institutes
- 10.5.6. Others
- 10.1. Market Analysis, Insights and Forecast - by Type
- 11. South America Chromatography Data Systems Market Analysis, Insights and Forecast, 2020-2032
- 11.1. Market Analysis, Insights and Forecast - by Type
- 11.1.1. Integrated CDS
- 11.1.2. Standalone CDS
- 11.2. Market Analysis, Insights and Forecast - by Deployment Mode
- 11.2.1. On-Premise CDS
- 11.2.2. Cloud-Based CDS
- 11.2.3. Hybrid CDS
- 11.3. Market Analysis, Insights and Forecast - by Enterprise Size
- 11.3.1. Large Enterprises
- 11.3.2. Small & Medium Enterprises (SMEs)
- 11.4. Market Analysis, Insights and Forecast - by Technique
- 11.4.1. Gas Chromatography (GC)
- 11.4.2. High-Performance Liquid Chromatography (HPLC)
- 11.4.3. Ion Chromatography (IC)
- 11.4.4. Thin Layer Chromatography (TLC)
- 11.4.5. Supercritical Fluid Chromatography (SFC)
- 11.4.6. Others
- 11.5. Market Analysis, Insights and Forecast - by End User
- 11.5.1. Pharmaceutical Companies
- 11.5.2. Biotechnology Companies
- 11.5.3. CROs
- 11.5.4. CDMOs
- 11.5.5. Academic and Research Institutes
- 11.5.6. Others
- 11.1. Market Analysis, Insights and Forecast - by Type
- 12. Competitive Analysis
- 12.1. Company Profiles
- 12.1.1 Advanced Chemistry Development Inc
- 12.1.1.1. Company Overview
- 12.1.1.2. Products
- 12.1.1.3. Company Financials
- 12.1.1.4. SWOT Analysis
- 12.1.2 Agilent Technologies Inc
- 12.1.2.1. Company Overview
- 12.1.2.2. Products
- 12.1.2.3. Company Financials
- 12.1.2.4. SWOT Analysis
- 12.1.3 Bio-Rad Laboratories Inc
- 12.1.3.1. Company Overview
- 12.1.3.2. Products
- 12.1.3.3. Company Financials
- 12.1.3.4. SWOT Analysis
- 12.1.4 Bruker Corporation
- 12.1.4.1. Company Overview
- 12.1.4.2. Products
- 12.1.4.3. Company Financials
- 12.1.4.4. SWOT Analysis
- 12.1.5 JASCO International Co Ltd
- 12.1.5.1. Company Overview
- 12.1.5.2. Products
- 12.1.5.3. Company Financials
- 12.1.5.4. SWOT Analysis
- 12.1.6 Justice Innovations Inc
- 12.1.6.1. Company Overview
- 12.1.6.2. Products
- 12.1.6.3. Company Financials
- 12.1.6.4. SWOT Analysis
- 12.1.7 PerkinElmer Inc
- 12.1.7.1. Company Overview
- 12.1.7.2. Products
- 12.1.7.3. Company Financials
- 12.1.7.4. SWOT Analysis
- 12.1.8 Shimadzu Corporation
- 12.1.8.1. Company Overview
- 12.1.8.2. Products
- 12.1.8.3. Company Financials
- 12.1.8.4. SWOT Analysis
- 12.1.9 Thermo Fisher Scientific Inc
- 12.1.9.1. Company Overview
- 12.1.9.2. Products
- 12.1.9.3. Company Financials
- 12.1.9.4. SWOT Analysis
- 12.1.10 Waters Corporatio
- 12.1.10.1. Company Overview
- 12.1.10.2. Products
- 12.1.10.3. Company Financials
- 12.1.10.4. SWOT Analysis
- 12.1.1 Advanced Chemistry Development Inc
- 12.2. Market Entropy
- 12.2.1 Company's Key Areas Served
- 12.2.2 Recent Developments
- 12.3. Company Market Share Analysis 2025
- 12.3.1 Top 5 Companies Market Share Analysis
- 12.3.2 Top 3 Companies Market Share Analysis
- 12.4. List of Potential Customers
- 13. Research Methodology
List of Figures
- Figure 1: Global Chromatography Data Systems Market Revenue Breakdown (Million, %) by Region 2025 & 2033
- Figure 2: Global Chromatography Data Systems Market Volume Breakdown (Million, %) by Region 2025 & 2033
- Figure 3: North America Chromatography Data Systems Market Revenue (Million), by Type 2025 & 2033
- Figure 4: North America Chromatography Data Systems Market Volume (Million), by Type 2025 & 2033
- Figure 5: North America Chromatography Data Systems Market Revenue Share (%), by Type 2025 & 2033
- Figure 6: North America Chromatography Data Systems Market Volume Share (%), by Type 2025 & 2033
- Figure 7: North America Chromatography Data Systems Market Revenue (Million), by Deployment Mode 2025 & 2033
- Figure 8: North America Chromatography Data Systems Market Volume (Million), by Deployment Mode 2025 & 2033
- Figure 9: North America Chromatography Data Systems Market Revenue Share (%), by Deployment Mode 2025 & 2033
- Figure 10: North America Chromatography Data Systems Market Volume Share (%), by Deployment Mode 2025 & 2033
- Figure 11: North America Chromatography Data Systems Market Revenue (Million), by Enterprise Size 2025 & 2033
- Figure 12: North America Chromatography Data Systems Market Volume (Million), by Enterprise Size 2025 & 2033
- Figure 13: North America Chromatography Data Systems Market Revenue Share (%), by Enterprise Size 2025 & 2033
- Figure 14: North America Chromatography Data Systems Market Volume Share (%), by Enterprise Size 2025 & 2033
- Figure 15: North America Chromatography Data Systems Market Revenue (Million), by Technique 2025 & 2033
- Figure 16: North America Chromatography Data Systems Market Volume (Million), by Technique 2025 & 2033
- Figure 17: North America Chromatography Data Systems Market Revenue Share (%), by Technique 2025 & 2033
- Figure 18: North America Chromatography Data Systems Market Volume Share (%), by Technique 2025 & 2033
- Figure 19: North America Chromatography Data Systems Market Revenue (Million), by End User 2025 & 2033
- Figure 20: North America Chromatography Data Systems Market Volume (Million), by End User 2025 & 2033
- Figure 21: North America Chromatography Data Systems Market Revenue Share (%), by End User 2025 & 2033
- Figure 22: North America Chromatography Data Systems Market Volume Share (%), by End User 2025 & 2033
- Figure 23: North America Chromatography Data Systems Market Revenue (Million), by Country 2025 & 2033
- Figure 24: North America Chromatography Data Systems Market Volume (Million), by Country 2025 & 2033
- Figure 25: North America Chromatography Data Systems Market Revenue Share (%), by Country 2025 & 2033
- Figure 26: North America Chromatography Data Systems Market Volume Share (%), by Country 2025 & 2033
- Figure 27: Europe Chromatography Data Systems Market Revenue (Million), by Type 2025 & 2033
- Figure 28: Europe Chromatography Data Systems Market Volume (Million), by Type 2025 & 2033
- Figure 29: Europe Chromatography Data Systems Market Revenue Share (%), by Type 2025 & 2033
- Figure 30: Europe Chromatography Data Systems Market Volume Share (%), by Type 2025 & 2033
- Figure 31: Europe Chromatography Data Systems Market Revenue (Million), by Deployment Mode 2025 & 2033
- Figure 32: Europe Chromatography Data Systems Market Volume (Million), by Deployment Mode 2025 & 2033
- Figure 33: Europe Chromatography Data Systems Market Revenue Share (%), by Deployment Mode 2025 & 2033
- Figure 34: Europe Chromatography Data Systems Market Volume Share (%), by Deployment Mode 2025 & 2033
- Figure 35: Europe Chromatography Data Systems Market Revenue (Million), by Enterprise Size 2025 & 2033
- Figure 36: Europe Chromatography Data Systems Market Volume (Million), by Enterprise Size 2025 & 2033
- Figure 37: Europe Chromatography Data Systems Market Revenue Share (%), by Enterprise Size 2025 & 2033
- Figure 38: Europe Chromatography Data Systems Market Volume Share (%), by Enterprise Size 2025 & 2033
- Figure 39: Europe Chromatography Data Systems Market Revenue (Million), by Technique 2025 & 2033
- Figure 40: Europe Chromatography Data Systems Market Volume (Million), by Technique 2025 & 2033
- Figure 41: Europe Chromatography Data Systems Market Revenue Share (%), by Technique 2025 & 2033
- Figure 42: Europe Chromatography Data Systems Market Volume Share (%), by Technique 2025 & 2033
- Figure 43: Europe Chromatography Data Systems Market Revenue (Million), by End User 2025 & 2033
- Figure 44: Europe Chromatography Data Systems Market Volume (Million), by End User 2025 & 2033
- Figure 45: Europe Chromatography Data Systems Market Revenue Share (%), by End User 2025 & 2033
- Figure 46: Europe Chromatography Data Systems Market Volume Share (%), by End User 2025 & 2033
- Figure 47: Europe Chromatography Data Systems Market Revenue (Million), by Country 2025 & 2033
- Figure 48: Europe Chromatography Data Systems Market Volume (Million), by Country 2025 & 2033
- Figure 49: Europe Chromatography Data Systems Market Revenue Share (%), by Country 2025 & 2033
- Figure 50: Europe Chromatography Data Systems Market Volume Share (%), by Country 2025 & 2033
- Figure 51: Asia Pacific Chromatography Data Systems Market Revenue (Million), by Type 2025 & 2033
- Figure 52: Asia Pacific Chromatography Data Systems Market Volume (Million), by Type 2025 & 2033
- Figure 53: Asia Pacific Chromatography Data Systems Market Revenue Share (%), by Type 2025 & 2033
- Figure 54: Asia Pacific Chromatography Data Systems Market Volume Share (%), by Type 2025 & 2033
- Figure 55: Asia Pacific Chromatography Data Systems Market Revenue (Million), by Deployment Mode 2025 & 2033
- Figure 56: Asia Pacific Chromatography Data Systems Market Volume (Million), by Deployment Mode 2025 & 2033
- Figure 57: Asia Pacific Chromatography Data Systems Market Revenue Share (%), by Deployment Mode 2025 & 2033
- Figure 58: Asia Pacific Chromatography Data Systems Market Volume Share (%), by Deployment Mode 2025 & 2033
- Figure 59: Asia Pacific Chromatography Data Systems Market Revenue (Million), by Enterprise Size 2025 & 2033
- Figure 60: Asia Pacific Chromatography Data Systems Market Volume (Million), by Enterprise Size 2025 & 2033
- Figure 61: Asia Pacific Chromatography Data Systems Market Revenue Share (%), by Enterprise Size 2025 & 2033
- Figure 62: Asia Pacific Chromatography Data Systems Market Volume Share (%), by Enterprise Size 2025 & 2033
- Figure 63: Asia Pacific Chromatography Data Systems Market Revenue (Million), by Technique 2025 & 2033
- Figure 64: Asia Pacific Chromatography Data Systems Market Volume (Million), by Technique 2025 & 2033
- Figure 65: Asia Pacific Chromatography Data Systems Market Revenue Share (%), by Technique 2025 & 2033
- Figure 66: Asia Pacific Chromatography Data Systems Market Volume Share (%), by Technique 2025 & 2033
- Figure 67: Asia Pacific Chromatography Data Systems Market Revenue (Million), by End User 2025 & 2033
- Figure 68: Asia Pacific Chromatography Data Systems Market Volume (Million), by End User 2025 & 2033
- Figure 69: Asia Pacific Chromatography Data Systems Market Revenue Share (%), by End User 2025 & 2033
- Figure 70: Asia Pacific Chromatography Data Systems Market Volume Share (%), by End User 2025 & 2033
- Figure 71: Asia Pacific Chromatography Data Systems Market Revenue (Million), by Country 2025 & 2033
- Figure 72: Asia Pacific Chromatography Data Systems Market Volume (Million), by Country 2025 & 2033
- Figure 73: Asia Pacific Chromatography Data Systems Market Revenue Share (%), by Country 2025 & 2033
- Figure 74: Asia Pacific Chromatography Data Systems Market Volume Share (%), by Country 2025 & 2033
- Figure 75: Middle East and Africa Chromatography Data Systems Market Revenue (Million), by Type 2025 & 2033
- Figure 76: Middle East and Africa Chromatography Data Systems Market Volume (Million), by Type 2025 & 2033
- Figure 77: Middle East and Africa Chromatography Data Systems Market Revenue Share (%), by Type 2025 & 2033
- Figure 78: Middle East and Africa Chromatography Data Systems Market Volume Share (%), by Type 2025 & 2033
- Figure 79: Middle East and Africa Chromatography Data Systems Market Revenue (Million), by Deployment Mode 2025 & 2033
- Figure 80: Middle East and Africa Chromatography Data Systems Market Volume (Million), by Deployment Mode 2025 & 2033
- Figure 81: Middle East and Africa Chromatography Data Systems Market Revenue Share (%), by Deployment Mode 2025 & 2033
- Figure 82: Middle East and Africa Chromatography Data Systems Market Volume Share (%), by Deployment Mode 2025 & 2033
- Figure 83: Middle East and Africa Chromatography Data Systems Market Revenue (Million), by Enterprise Size 2025 & 2033
- Figure 84: Middle East and Africa Chromatography Data Systems Market Volume (Million), by Enterprise Size 2025 & 2033
- Figure 85: Middle East and Africa Chromatography Data Systems Market Revenue Share (%), by Enterprise Size 2025 & 2033
- Figure 86: Middle East and Africa Chromatography Data Systems Market Volume Share (%), by Enterprise Size 2025 & 2033
- Figure 87: Middle East and Africa Chromatography Data Systems Market Revenue (Million), by Technique 2025 & 2033
- Figure 88: Middle East and Africa Chromatography Data Systems Market Volume (Million), by Technique 2025 & 2033
- Figure 89: Middle East and Africa Chromatography Data Systems Market Revenue Share (%), by Technique 2025 & 2033
- Figure 90: Middle East and Africa Chromatography Data Systems Market Volume Share (%), by Technique 2025 & 2033
- Figure 91: Middle East and Africa Chromatography Data Systems Market Revenue (Million), by End User 2025 & 2033
- Figure 92: Middle East and Africa Chromatography Data Systems Market Volume (Million), by End User 2025 & 2033
- Figure 93: Middle East and Africa Chromatography Data Systems Market Revenue Share (%), by End User 2025 & 2033
- Figure 94: Middle East and Africa Chromatography Data Systems Market Volume Share (%), by End User 2025 & 2033
- Figure 95: Middle East and Africa Chromatography Data Systems Market Revenue (Million), by Country 2025 & 2033
- Figure 96: Middle East and Africa Chromatography Data Systems Market Volume (Million), by Country 2025 & 2033
- Figure 97: Middle East and Africa Chromatography Data Systems Market Revenue Share (%), by Country 2025 & 2033
- Figure 98: Middle East and Africa Chromatography Data Systems Market Volume Share (%), by Country 2025 & 2033
- Figure 99: South America Chromatography Data Systems Market Revenue (Million), by Type 2025 & 2033
- Figure 100: South America Chromatography Data Systems Market Volume (Million), by Type 2025 & 2033
- Figure 101: South America Chromatography Data Systems Market Revenue Share (%), by Type 2025 & 2033
- Figure 102: South America Chromatography Data Systems Market Volume Share (%), by Type 2025 & 2033
- Figure 103: South America Chromatography Data Systems Market Revenue (Million), by Deployment Mode 2025 & 2033
- Figure 104: South America Chromatography Data Systems Market Volume (Million), by Deployment Mode 2025 & 2033
- Figure 105: South America Chromatography Data Systems Market Revenue Share (%), by Deployment Mode 2025 & 2033
- Figure 106: South America Chromatography Data Systems Market Volume Share (%), by Deployment Mode 2025 & 2033
- Figure 107: South America Chromatography Data Systems Market Revenue (Million), by Enterprise Size 2025 & 2033
- Figure 108: South America Chromatography Data Systems Market Volume (Million), by Enterprise Size 2025 & 2033
- Figure 109: South America Chromatography Data Systems Market Revenue Share (%), by Enterprise Size 2025 & 2033
- Figure 110: South America Chromatography Data Systems Market Volume Share (%), by Enterprise Size 2025 & 2033
- Figure 111: South America Chromatography Data Systems Market Revenue (Million), by Technique 2025 & 2033
- Figure 112: South America Chromatography Data Systems Market Volume (Million), by Technique 2025 & 2033
- Figure 113: South America Chromatography Data Systems Market Revenue Share (%), by Technique 2025 & 2033
- Figure 114: South America Chromatography Data Systems Market Volume Share (%), by Technique 2025 & 2033
- Figure 115: South America Chromatography Data Systems Market Revenue (Million), by End User 2025 & 2033
- Figure 116: South America Chromatography Data Systems Market Volume (Million), by End User 2025 & 2033
- Figure 117: South America Chromatography Data Systems Market Revenue Share (%), by End User 2025 & 2033
- Figure 118: South America Chromatography Data Systems Market Volume Share (%), by End User 2025 & 2033
- Figure 119: South America Chromatography Data Systems Market Revenue (Million), by Country 2025 & 2033
- Figure 120: South America Chromatography Data Systems Market Volume (Million), by Country 2025 & 2033
- Figure 121: South America Chromatography Data Systems Market Revenue Share (%), by Country 2025 & 2033
- Figure 122: South America Chromatography Data Systems Market Volume Share (%), by Country 2025 & 2033
List of Tables
- Table 1: Global Chromatography Data Systems Market Revenue Million Forecast, by Type 2020 & 2033
- Table 2: Global Chromatography Data Systems Market Volume Million Forecast, by Type 2020 & 2033
- Table 3: Global Chromatography Data Systems Market Revenue Million Forecast, by Deployment Mode 2020 & 2033
- Table 4: Global Chromatography Data Systems Market Volume Million Forecast, by Deployment Mode 2020 & 2033
- Table 5: Global Chromatography Data Systems Market Revenue Million Forecast, by Enterprise Size 2020 & 2033
- Table 6: Global Chromatography Data Systems Market Volume Million Forecast, by Enterprise Size 2020 & 2033
- Table 7: Global Chromatography Data Systems Market Revenue Million Forecast, by Technique 2020 & 2033
- Table 8: Global Chromatography Data Systems Market Volume Million Forecast, by Technique 2020 & 2033
- Table 9: Global Chromatography Data Systems Market Revenue Million Forecast, by End User 2020 & 2033
- Table 10: Global Chromatography Data Systems Market Volume Million Forecast, by End User 2020 & 2033
- Table 11: Global Chromatography Data Systems Market Revenue Million Forecast, by Region 2020 & 2033
- Table 12: Global Chromatography Data Systems Market Volume Million Forecast, by Region 2020 & 2033
- Table 13: Global Chromatography Data Systems Market Revenue Million Forecast, by Type 2020 & 2033
- Table 14: Global Chromatography Data Systems Market Volume Million Forecast, by Type 2020 & 2033
- Table 15: Global Chromatography Data Systems Market Revenue Million Forecast, by Deployment Mode 2020 & 2033
- Table 16: Global Chromatography Data Systems Market Volume Million Forecast, by Deployment Mode 2020 & 2033
- Table 17: Global Chromatography Data Systems Market Revenue Million Forecast, by Enterprise Size 2020 & 2033
- Table 18: Global Chromatography Data Systems Market Volume Million Forecast, by Enterprise Size 2020 & 2033
- Table 19: Global Chromatography Data Systems Market Revenue Million Forecast, by Technique 2020 & 2033
- Table 20: Global Chromatography Data Systems Market Volume Million Forecast, by Technique 2020 & 2033
- Table 21: Global Chromatography Data Systems Market Revenue Million Forecast, by End User 2020 & 2033
- Table 22: Global Chromatography Data Systems Market Volume Million Forecast, by End User 2020 & 2033
- Table 23: Global Chromatography Data Systems Market Revenue Million Forecast, by Country 2020 & 2033
- Table 24: Global Chromatography Data Systems Market Volume Million Forecast, by Country 2020 & 2033
- Table 25: United States Chromatography Data Systems Market Revenue (Million) Forecast, by Application 2020 & 2033
- Table 26: United States Chromatography Data Systems Market Volume (Million) Forecast, by Application 2020 & 2033
- Table 27: Canada Chromatography Data Systems Market Revenue (Million) Forecast, by Application 2020 & 2033
- Table 28: Canada Chromatography Data Systems Market Volume (Million) Forecast, by Application 2020 & 2033
- Table 29: Mexico Chromatography Data Systems Market Revenue (Million) Forecast, by Application 2020 & 2033
- Table 30: Mexico Chromatography Data Systems Market Volume (Million) Forecast, by Application 2020 & 2033
- Table 31: Global Chromatography Data Systems Market Revenue Million Forecast, by Type 2020 & 2033
- Table 32: Global Chromatography Data Systems Market Volume Million Forecast, by Type 2020 & 2033
- Table 33: Global Chromatography Data Systems Market Revenue Million Forecast, by Deployment Mode 2020 & 2033
- Table 34: Global Chromatography Data Systems Market Volume Million Forecast, by Deployment Mode 2020 & 2033
- Table 35: Global Chromatography Data Systems Market Revenue Million Forecast, by Enterprise Size 2020 & 2033
- Table 36: Global Chromatography Data Systems Market Volume Million Forecast, by Enterprise Size 2020 & 2033
- Table 37: Global Chromatography Data Systems Market Revenue Million Forecast, by Technique 2020 & 2033
- Table 38: Global Chromatography Data Systems Market Volume Million Forecast, by Technique 2020 & 2033
- Table 39: Global Chromatography Data Systems Market Revenue Million Forecast, by End User 2020 & 2033
- Table 40: Global Chromatography Data Systems Market Volume Million Forecast, by End User 2020 & 2033
- Table 41: Global Chromatography Data Systems Market Revenue Million Forecast, by Country 2020 & 2033
- Table 42: Global Chromatography Data Systems Market Volume Million Forecast, by Country 2020 & 2033
- Table 43: Germany Chromatography Data Systems Market Revenue (Million) Forecast, by Application 2020 & 2033
- Table 44: Germany Chromatography Data Systems Market Volume (Million) Forecast, by Application 2020 & 2033
- Table 45: United Kingdom Chromatography Data Systems Market Revenue (Million) Forecast, by Application 2020 & 2033
- Table 46: United Kingdom Chromatography Data Systems Market Volume (Million) Forecast, by Application 2020 & 2033
- Table 47: France Chromatography Data Systems Market Revenue (Million) Forecast, by Application 2020 & 2033
- Table 48: France Chromatography Data Systems Market Volume (Million) Forecast, by Application 2020 & 2033
- Table 49: Italy Chromatography Data Systems Market Revenue (Million) Forecast, by Application 2020 & 2033
- Table 50: Italy Chromatography Data Systems Market Volume (Million) Forecast, by Application 2020 & 2033
- Table 51: Spain Chromatography Data Systems Market Revenue (Million) Forecast, by Application 2020 & 2033
- Table 52: Spain Chromatography Data Systems Market Volume (Million) Forecast, by Application 2020 & 2033
- Table 53: Rest of Europe Chromatography Data Systems Market Revenue (Million) Forecast, by Application 2020 & 2033
- Table 54: Rest of Europe Chromatography Data Systems Market Volume (Million) Forecast, by Application 2020 & 2033
- Table 55: Global Chromatography Data Systems Market Revenue Million Forecast, by Type 2020 & 2033
- Table 56: Global Chromatography Data Systems Market Volume Million Forecast, by Type 2020 & 2033
- Table 57: Global Chromatography Data Systems Market Revenue Million Forecast, by Deployment Mode 2020 & 2033
- Table 58: Global Chromatography Data Systems Market Volume Million Forecast, by Deployment Mode 2020 & 2033
- Table 59: Global Chromatography Data Systems Market Revenue Million Forecast, by Enterprise Size 2020 & 2033
- Table 60: Global Chromatography Data Systems Market Volume Million Forecast, by Enterprise Size 2020 & 2033
- Table 61: Global Chromatography Data Systems Market Revenue Million Forecast, by Technique 2020 & 2033
- Table 62: Global Chromatography Data Systems Market Volume Million Forecast, by Technique 2020 & 2033
- Table 63: Global Chromatography Data Systems Market Revenue Million Forecast, by End User 2020 & 2033
- Table 64: Global Chromatography Data Systems Market Volume Million Forecast, by End User 2020 & 2033
- Table 65: Global Chromatography Data Systems Market Revenue Million Forecast, by Country 2020 & 2033
- Table 66: Global Chromatography Data Systems Market Volume Million Forecast, by Country 2020 & 2033
- Table 67: China Chromatography Data Systems Market Revenue (Million) Forecast, by Application 2020 & 2033
- Table 68: China Chromatography Data Systems Market Volume (Million) Forecast, by Application 2020 & 2033
- Table 69: Japan Chromatography Data Systems Market Revenue (Million) Forecast, by Application 2020 & 2033
- Table 70: Japan Chromatography Data Systems Market Volume (Million) Forecast, by Application 2020 & 2033
- Table 71: India Chromatography Data Systems Market Revenue (Million) Forecast, by Application 2020 & 2033
- Table 72: India Chromatography Data Systems Market Volume (Million) Forecast, by Application 2020 & 2033
- Table 73: Australia Chromatography Data Systems Market Revenue (Million) Forecast, by Application 2020 & 2033
- Table 74: Australia Chromatography Data Systems Market Volume (Million) Forecast, by Application 2020 & 2033
- Table 75: South Korea Chromatography Data Systems Market Revenue (Million) Forecast, by Application 2020 & 2033
- Table 76: South Korea Chromatography Data Systems Market Volume (Million) Forecast, by Application 2020 & 2033
- Table 77: Rest of Asia Pacific Chromatography Data Systems Market Revenue (Million) Forecast, by Application 2020 & 2033
- Table 78: Rest of Asia Pacific Chromatography Data Systems Market Volume (Million) Forecast, by Application 2020 & 2033
- Table 79: Global Chromatography Data Systems Market Revenue Million Forecast, by Type 2020 & 2033
- Table 80: Global Chromatography Data Systems Market Volume Million Forecast, by Type 2020 & 2033
- Table 81: Global Chromatography Data Systems Market Revenue Million Forecast, by Deployment Mode 2020 & 2033
- Table 82: Global Chromatography Data Systems Market Volume Million Forecast, by Deployment Mode 2020 & 2033
- Table 83: Global Chromatography Data Systems Market Revenue Million Forecast, by Enterprise Size 2020 & 2033
- Table 84: Global Chromatography Data Systems Market Volume Million Forecast, by Enterprise Size 2020 & 2033
- Table 85: Global Chromatography Data Systems Market Revenue Million Forecast, by Technique 2020 & 2033
- Table 86: Global Chromatography Data Systems Market Volume Million Forecast, by Technique 2020 & 2033
- Table 87: Global Chromatography Data Systems Market Revenue Million Forecast, by End User 2020 & 2033
- Table 88: Global Chromatography Data Systems Market Volume Million Forecast, by End User 2020 & 2033
- Table 89: Global Chromatography Data Systems Market Revenue Million Forecast, by Country 2020 & 2033
- Table 90: Global Chromatography Data Systems Market Volume Million Forecast, by Country 2020 & 2033
- Table 91: GCC Chromatography Data Systems Market Revenue (Million) Forecast, by Application 2020 & 2033
- Table 92: GCC Chromatography Data Systems Market Volume (Million) Forecast, by Application 2020 & 2033
- Table 93: South Africa Chromatography Data Systems Market Revenue (Million) Forecast, by Application 2020 & 2033
- Table 94: South Africa Chromatography Data Systems Market Volume (Million) Forecast, by Application 2020 & 2033
- Table 95: Rest of Middle East and Africa Chromatography Data Systems Market Revenue (Million) Forecast, by Application 2020 & 2033
- Table 96: Rest of Middle East and Africa Chromatography Data Systems Market Volume (Million) Forecast, by Application 2020 & 2033
- Table 97: Global Chromatography Data Systems Market Revenue Million Forecast, by Type 2020 & 2033
- Table 98: Global Chromatography Data Systems Market Volume Million Forecast, by Type 2020 & 2033
- Table 99: Global Chromatography Data Systems Market Revenue Million Forecast, by Deployment Mode 2020 & 2033
- Table 100: Global Chromatography Data Systems Market Volume Million Forecast, by Deployment Mode 2020 & 2033
- Table 101: Global Chromatography Data Systems Market Revenue Million Forecast, by Enterprise Size 2020 & 2033
- Table 102: Global Chromatography Data Systems Market Volume Million Forecast, by Enterprise Size 2020 & 2033
- Table 103: Global Chromatography Data Systems Market Revenue Million Forecast, by Technique 2020 & 2033
- Table 104: Global Chromatography Data Systems Market Volume Million Forecast, by Technique 2020 & 2033
- Table 105: Global Chromatography Data Systems Market Revenue Million Forecast, by End User 2020 & 2033
- Table 106: Global Chromatography Data Systems Market Volume Million Forecast, by End User 2020 & 2033
- Table 107: Global Chromatography Data Systems Market Revenue Million Forecast, by Country 2020 & 2033
- Table 108: Global Chromatography Data Systems Market Volume Million Forecast, by Country 2020 & 2033
- Table 109: Brazil Chromatography Data Systems Market Revenue (Million) Forecast, by Application 2020 & 2033
- Table 110: Brazil Chromatography Data Systems Market Volume (Million) Forecast, by Application 2020 & 2033
- Table 111: Argentina Chromatography Data Systems Market Revenue (Million) Forecast, by Application 2020 & 2033
- Table 112: Argentina Chromatography Data Systems Market Volume (Million) Forecast, by Application 2020 & 2033
- Table 113: Rest of South America Chromatography Data Systems Market Revenue (Million) Forecast, by Application 2020 & 2033
- Table 114: Rest of South America Chromatography Data Systems Market Volume (Million) Forecast, by Application 2020 & 2033
Frequently Asked Questions
1. What is the projected Compound Annual Growth Rate (CAGR) of the Chromatography Data Systems Market?
The projected CAGR is approximately 7.92%.
2. Which companies are prominent players in the Chromatography Data Systems Market?
Key companies in the market include Advanced Chemistry Development Inc, Agilent Technologies Inc, Bio-Rad Laboratories Inc, Bruker Corporation, JASCO International Co Ltd, Justice Innovations Inc, PerkinElmer Inc, Shimadzu Corporation, Thermo Fisher Scientific Inc, Waters Corporatio.
3. What are the main segments of the Chromatography Data Systems Market?
The market segments include Type, Deployment Mode, Enterprise Size, Technique, End User.
4. Can you provide details about the market size?
The market size is estimated to be USD 506.63 Million as of 2022.
5. What are some drivers contributing to market growth?
Rising Expenses on Research and Development From Life Sciences Sector; Growing Demand for Food Testing.
6. What are the notable trends driving market growth?
The Cloud Segment is Expected to Witness Substantial Growth Over the Forecast Period.
7. Are there any restraints impacting market growth?
Rising Expenses on Research and Development From Life Sciences Sector; Growing Demand for Food Testing.
8. Can you provide examples of recent developments in the market?
May 2023: Sciex Corporation, a United States-based manufacturer of mass spectrometry instrumentation, launched the BioPhase 8800 driver, which enables the easy integration of the BioPhase 8800 system with the Empower chromatography data system from Waters Technologies Corporation.
9. What pricing options are available for accessing the report?
Pricing options include single-user, multi-user, and enterprise licenses priced at USD 4750, USD 5250, and USD 8750 respectively.
10. Is the market size provided in terms of value or volume?
The market size is provided in terms of value, measured in Million and volume, measured in Million.
11. Are there any specific market keywords associated with the report?
Yes, the market keyword associated with the report is "Chromatography Data Systems Market," which aids in identifying and referencing the specific market segment covered.
12. How do I determine which pricing option suits my needs best?
The pricing options vary based on user requirements and access needs. Individual users may opt for single-user licenses, while businesses requiring broader access may choose multi-user or enterprise licenses for cost-effective access to the report.
13. Are there any additional resources or data provided in the Chromatography Data Systems Market report?
While the report offers comprehensive insights, it's advisable to review the specific contents or supplementary materials provided to ascertain if additional resources or data are available.
14. How can I stay updated on further developments or reports in the Chromatography Data Systems Market?
To stay informed about further developments, trends, and reports in the Chromatography Data Systems Market, consider subscribing to industry newsletters, following relevant companies and organizations, or regularly checking reputable industry news sources and publications.
Methodology
Step 1 - Identification of Relevant Samples Size from Population Database


Step 2 - Approaches for Defining Global Market Size (Value, Volume* & Price*)

Note*: In applicable scenarios
Step 3 - Data Sources
Primary Research
- Web Analytics
- Survey Reports
- Research Institute
- Latest Research Reports
- Opinion Leaders
Secondary Research
- Annual Reports
- White Paper
- Latest Press Release
- Industry Association
- Paid Database
- Investor Presentations

Step 4 - Data Triangulation
Involves using different sources of information in order to increase the validity of a study
These sources are likely to be stakeholders in a program - participants, other researchers, program staff, other community members, and so on.
Then we put all data in single framework & apply various statistical tools to find out the dynamic on the market.
During the analysis stage, feedback from the stakeholder groups would be compared to determine areas of agreement as well as areas of divergence