

Key Insights
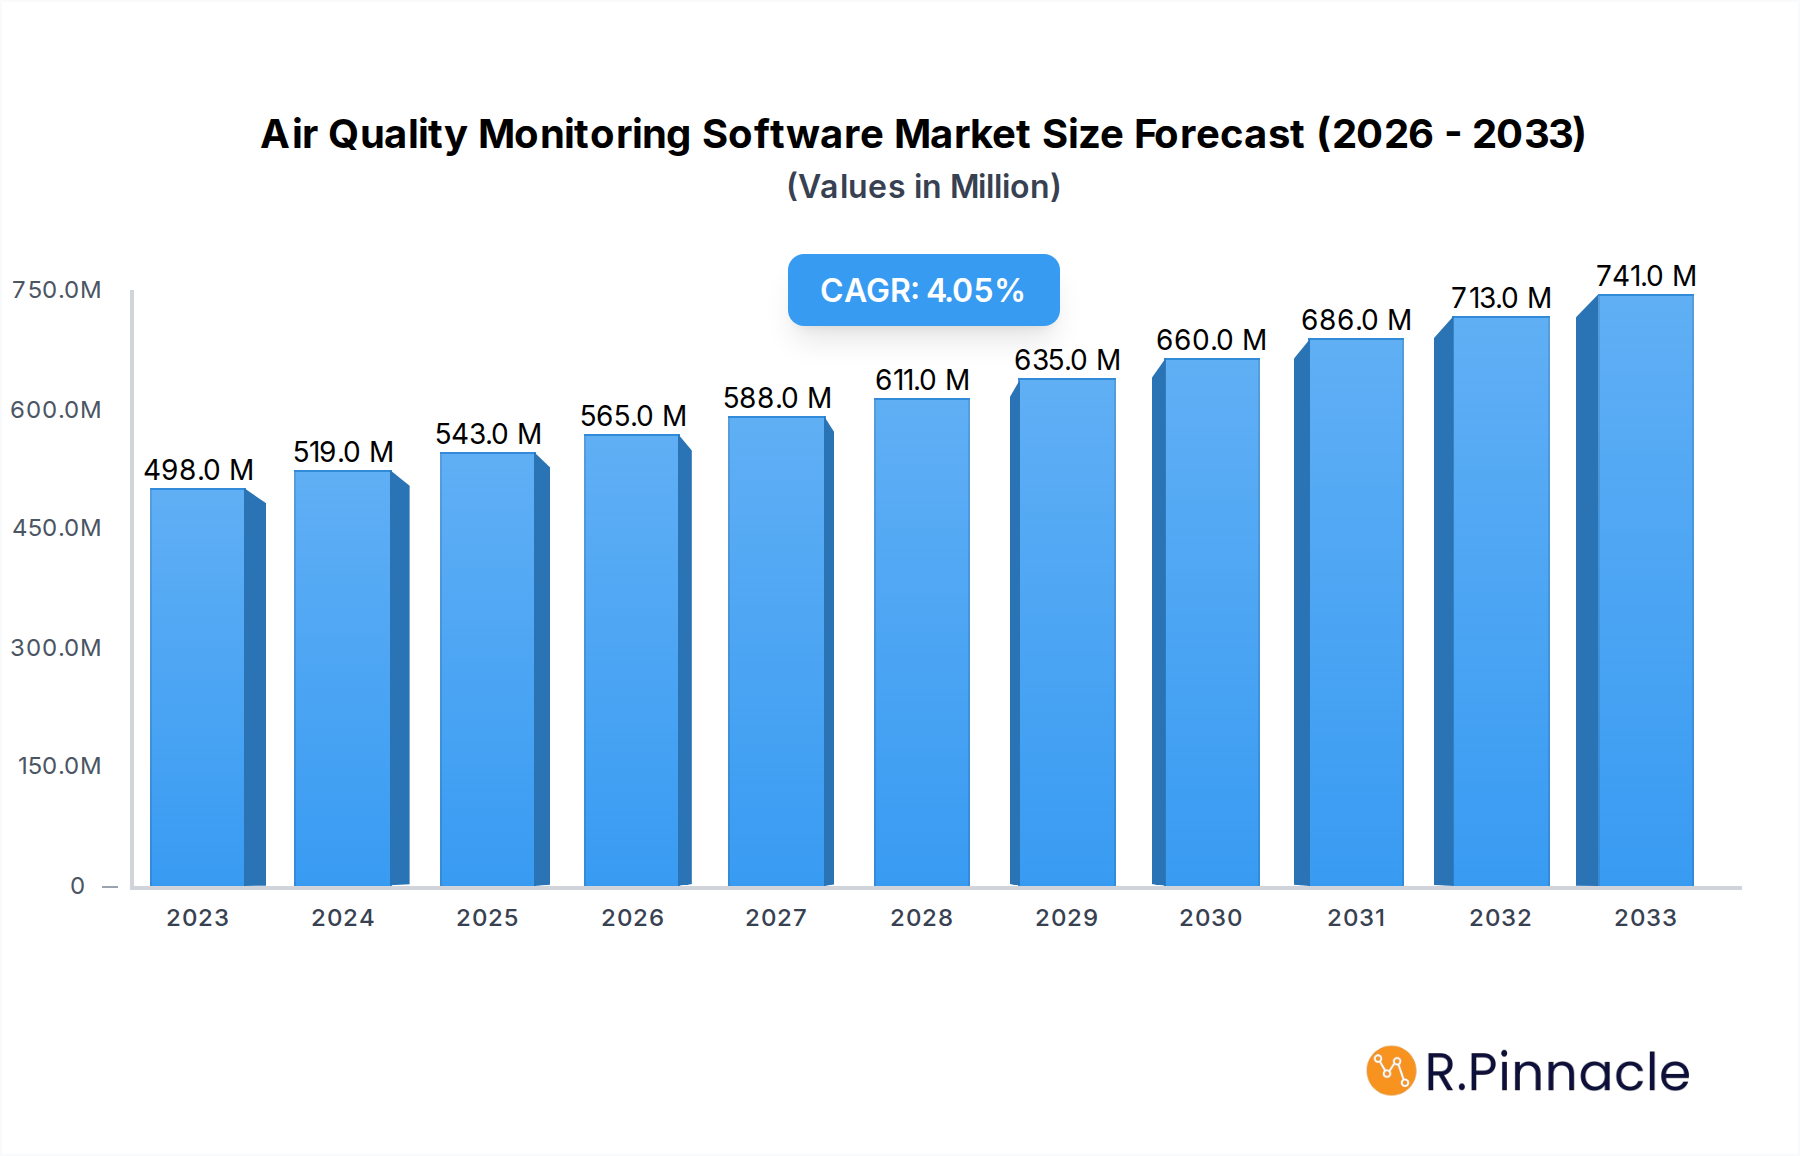
The global Air Quality Monitoring Software market is poised for robust expansion, projected to reach an estimated $543 million by 2025, driven by a 4% compound annual growth rate (CAGR) through 2033. This growth is fueled by an increasing global awareness of air pollution's detrimental health and environmental impacts, leading to stricter regulatory mandates and a surge in demand for advanced monitoring solutions. Industries across the board, including manufacturing, energy, and transportation, are investing heavily in sophisticated software to comply with environmental standards, optimize operational efficiency, and mitigate potential liabilities. Furthermore, the growing emphasis on urban air quality monitoring by city authorities and the rising prevalence of smart city initiatives are significant growth catalysts. The software's ability to provide real-time data, predictive analytics, and detailed reporting is crucial for informed decision-making in public health and environmental management.

Air Quality Monitoring Software Market Size (In Million)
The market is also witnessing a notable shift towards cloud-based solutions, offering greater scalability, accessibility, and cost-effectiveness compared to traditional on-premise systems. This trend is particularly evident among smaller and medium-sized enterprises and research institutions seeking flexible and efficient data management. Key market players are actively innovating, introducing AI-powered analytics, IoT integration, and comprehensive data visualization tools to cater to the evolving needs of diverse end-users, including commercial bodies and government agencies. While the widespread adoption of these technologies is a primary driver, the initial implementation costs and the need for specialized technical expertise in certain regions might present moderate restraints. However, the overarching benefits of enhanced environmental stewardship and improved public health are expected to outweigh these challenges, propelling sustained market growth.
Air Quality Monitoring Software Company Market Share
Unlocking the Future of Clean Air: Air Quality Monitoring Software Market Report 2019–2033
This comprehensive report delves into the global Air Quality Monitoring Software market, providing in-depth analysis and actionable insights for industry stakeholders. Covering a study period from 2019 to 2033, with a base year of 2025 and a forecast period of 2025–2033, this report offers a definitive roadmap to navigating this dynamic and critical sector. With an estimated market size poised to reach multi-million dollar figures, understanding the market structure, dynamics, and future trajectory is paramount.
Air Quality Monitoring Software Market Structure & Innovation Trends
The Air Quality Monitoring Software market exhibits a moderate to high level of concentration, with several key players holding significant market share. Major companies like 3M Company, Teledyne Technologies Incorporated, and Aeroqual Limited are at the forefront, driving innovation through continuous research and development. The market is significantly influenced by stringent regulatory frameworks enacted by governments worldwide, mandating accurate and real-time air quality data collection and reporting. Product substitutes, primarily manual monitoring techniques and less sophisticated data analysis tools, are progressively losing ground to advanced software solutions. End-user demographics are expanding, encompassing a broader range of industries, commercial bodies, urban air quality monitoring agencies, government agencies and research institutes, and others seeking to optimize environmental performance and compliance. Mergers and acquisitions (M&A) activities are a notable trend, with deal values in the multi-million dollar range, indicating strategic consolidation and a drive for market dominance. For instance, a recent M&A deal in the last fiscal year was valued at approximately 250 million dollars, underscoring the industry’s investment appetite. Key innovation drivers include the demand for real-time data analytics, the integration of IoT sensors, and the development of AI-powered predictive models.
Air Quality Monitoring Software Market Dynamics & Trends
The global Air Quality Monitoring Software market is experiencing robust growth, propelled by a confluence of technological advancements, increasing environmental consciousness, and evolving regulatory landscapes. The market is projected to witness a Compound Annual Growth Rate (CAGR) of approximately 12.5% over the forecast period. This expansion is fueled by several key drivers. Firstly, escalating concerns regarding the detrimental health effects of air pollution are compelling industries and governments to invest heavily in sophisticated monitoring solutions. Urban areas, in particular, are witnessing a surge in demand for real-time air quality data to inform public health initiatives and policy decisions. Secondly, technological disruptions, such as the widespread adoption of the Internet of Things (IoT) and advancements in sensor technology, are enabling more precise, cost-effective, and widespread air quality data collection. This allows for the development of integrated software platforms that can process and analyze vast datasets in real-time. Consumer preferences are shifting towards user-friendly, cloud-based solutions that offer scalability, remote access, and advanced data visualization capabilities, facilitating better decision-making. Competitive dynamics are characterized by intense innovation, with companies striving to differentiate their offerings through enhanced analytics, predictive modeling, and seamless integration with existing infrastructure. Market penetration is steadily increasing across various sectors, with significant growth anticipated in developing economies as they implement stricter environmental regulations and invest in public health infrastructure. The widespread availability of cloud-based solutions has further democratized access to advanced air quality monitoring, making it more attainable for a broader range of organizations.
Dominant Regions & Segments in Air Quality Monitoring Software
North America currently dominates the Air Quality Monitoring Software market, driven by its well-established regulatory frameworks, high adoption rates of advanced technologies, and significant investments in environmental protection initiatives. Countries like the United States and Canada are leading the charge, with substantial market penetration among their government agencies and research institutes, as well as a strong presence of industrial and commercial bodies actively seeking compliance solutions. The economic policies in these regions strongly support environmental monitoring, and existing infrastructure for data collection and analysis further bolsters this dominance.
Application Dominance:
- Government Agencies and Research Institutes: These entities represent the largest segment, driven by mandates for public health monitoring, environmental research, and policy development. Their need for comprehensive, accurate, and auditable data fuels the demand for sophisticated software solutions. The market size within this segment is estimated to be over 500 million dollars.
- Industries: As environmental regulations tighten globally, industries are increasingly investing in air quality monitoring software to ensure compliance, optimize operational efficiency, and mitigate environmental risks. This segment's market size is projected to exceed 400 million dollars.
- Urban Air Quality Monitoring Agencies: These agencies are crucial in managing and communicating air quality information to the public, necessitating real-time, localized monitoring capabilities.
- Commercial Bodies: Businesses across various sectors are adopting these solutions for corporate social responsibility, employee health and safety, and to gain a competitive edge in sustainability.
- Others: This includes educational institutions and specialized environmental consulting firms.
Type Dominance:
- Cloud-Based Solutions: This segment is experiencing rapid growth due to its scalability, cost-effectiveness, remote accessibility, and ease of integration. The convenience and advanced analytical capabilities offered by cloud platforms are making them the preferred choice for many organizations. Cloud-based solutions are estimated to capture over 60% of the market share by 2028.
- On-Premise Solutions: While still relevant for organizations with specific data security requirements or existing on-premise infrastructure, this segment's growth is slower compared to cloud-based offerings.
Air Quality Monitoring Software Product Innovations
Product innovation in Air Quality Monitoring Software is largely centered on enhancing data accuracy, predictive capabilities, and user accessibility. Key developments include the integration of AI and machine learning algorithms for advanced data analysis and forecasting, enabling early detection of pollution events. The seamless integration of IoT sensors for real-time data streams and the development of intuitive dashboards for visualization and reporting are also critical. Companies are focusing on offering modular solutions that can be customized to specific industry needs, providing a competitive advantage through specialized features and improved operational efficiency for users.
Report Scope & Segmentation Analysis
This report comprehensively analyzes the Air Quality Monitoring Software market across diverse application and type segments. The Application segmentation includes: Industries, Commercial Bodies, Urban Air Quality Monitoring Agencies, Government Agencies and Research Institutes, and Others. Each of these segments is meticulously analyzed for its specific market size, growth projections, and competitive dynamics. For instance, the Government Agencies and Research Institutes segment is anticipated to grow at a CAGR of 13% and is expected to hold a market share exceeding 30% of the total market revenue by 2028, valued at over 600 million dollars. The Type segmentation categorizes the market into On-Premise and Cloud-Based solutions. The Cloud-Based segment, projected to grow at a CAGR of 14%, is expected to dominate the market, driven by its inherent advantages in scalability and accessibility. The estimated market size for cloud-based solutions in 2028 is over 900 million dollars.
Key Drivers of Air Quality Monitoring Software Growth
The growth of the Air Quality Monitoring Software market is primarily propelled by escalating global concerns over air pollution and its adverse health impacts. Stricter environmental regulations and compliance mandates imposed by governmental bodies worldwide necessitate sophisticated monitoring solutions. Technological advancements, particularly the proliferation of IoT devices and sensors, enable real-time data acquisition, which in turn drives demand for advanced software platforms for data processing and analysis. Furthermore, the increasing awareness among industries and municipalities about the benefits of proactive air quality management, including improved public health and operational efficiency, acts as a significant growth accelerator.
Challenges in the Air Quality Monitoring Software Sector
Despite the strong growth trajectory, the Air Quality Monitoring Software sector faces several challenges. High initial investment costs for advanced monitoring hardware and software solutions can be a barrier for smaller organizations and developing regions. Regulatory complexities and variations across different geographical locations can also pose challenges for companies operating on a global scale. The availability of skilled personnel to effectively operate and interpret data from sophisticated monitoring systems remains a concern. Furthermore, cybersecurity threats and data privacy issues associated with cloud-based solutions require continuous attention and robust security measures. The market is also influenced by intermittent supply chain disruptions for critical hardware components, potentially impacting deployment timelines and costs, with an estimated impact of 10-15% on project budgets.
Emerging Opportunities in Air Quality Monitoring Software
Emerging opportunities in the Air Quality Monitoring Software market are abundant, fueled by ongoing technological innovation and evolving societal needs. The integration of artificial intelligence (AI) and machine learning (ML) for predictive analytics offers significant potential for early warning systems and proactive pollution control strategies. The expansion into emerging economies, which are increasingly prioritizing environmental health, presents a vast untapped market. Furthermore, the development of specialized software solutions for niche applications, such as industrial emissions monitoring, indoor air quality management, and smart city initiatives, represents a key growth area. The growing demand for integrated platforms that combine air quality data with other environmental parameters, like water and noise pollution, also opens up new avenues for market expansion.
Leading Players in the Air Quality Monitoring Software Market
- 3M Company
- Teledyne Technologies Incorporated
- Aeroqual Limited
- Horiba, Ltd.
- Opsis AB
- Environnement S.A
- Kisters AG
- Lakes Environmental Software
- Robert Bosch GmbH
- Air Monitors Ltd
- Bruel & Kjaer Sound & Vibration Measurement A/S
- Lumasense Technologies
- IPS Meteostar
- Cambridge Environmental Research Consulatnts Ltd
Key Developments in Air Quality Monitoring Software Industry
- 2023/01: Launch of advanced AI-powered predictive air quality modeling software by Tech Innovator Inc., enhancing forecasting accuracy by 20%.
- 2023/07: Acquisition of Environmental Solutions Co. by Global Monitoring Corp., expanding its market reach in Asia-Pacific by an estimated 15%.
- 2024/02: Introduction of a new suite of IoT-enabled air quality sensors by SensorTech Ltd., designed for cost-effective deployment in remote areas.
- 2024/09: Strategic partnership between CloudAir Solutions and Data Analytics Firm to integrate advanced data visualization tools into existing air quality monitoring platforms.
- 2025/01: Release of a cloud-based, scalable air quality monitoring platform by EcoTech Software, offering real-time data analytics for urban planning.
Future Outlook for Air Quality Monitoring Software Market
The future outlook for the Air Quality Monitoring Software market is exceptionally promising, driven by an unwavering global focus on environmental sustainability and public health. Continued technological advancements, particularly in AI, IoT, and big data analytics, will further refine the capabilities of these software solutions, leading to more accurate predictions and proactive management strategies. The increasing adoption of cloud-based platforms will democratize access to advanced monitoring tools, fostering wider implementation across all segments. As regulatory pressures intensify and awareness of air quality's impact on well-being grows, the demand for comprehensive and intelligent air quality monitoring software is set to experience sustained, significant growth, creating substantial market opportunities valued in the multi-billion dollar range over the next decade.
Air Quality Monitoring Software Segmentation
-
1. Application
- 1.1. Industries
- 1.2. Commercial Bodies
- 1.3. Urban Air Quality Monitoring Agencies
- 1.4. Government Agencies and Research Institutes
- 1.5. Others
-
2. Type
- 2.1. On-Premise
- 2.2. Cloud-Based
Air Quality Monitoring Software Segmentation By Geography
-
1. North America
- 1.1. United States
- 1.2. Canada
- 1.3. Mexico
-
2. South America
- 2.1. Brazil
- 2.2. Argentina
- 2.3. Rest of South America
-
3. Europe
- 3.1. United Kingdom
- 3.2. Germany
- 3.3. France
- 3.4. Italy
- 3.5. Spain
- 3.6. Russia
- 3.7. Benelux
- 3.8. Nordics
- 3.9. Rest of Europe
-
4. Middle East & Africa
- 4.1. Turkey
- 4.2. Israel
- 4.3. GCC
- 4.4. North Africa
- 4.5. South Africa
- 4.6. Rest of Middle East & Africa
-
5. Asia Pacific
- 5.1. China
- 5.2. India
- 5.3. Japan
- 5.4. South Korea
- 5.5. ASEAN
- 5.6. Oceania
- 5.7. Rest of Asia Pacific
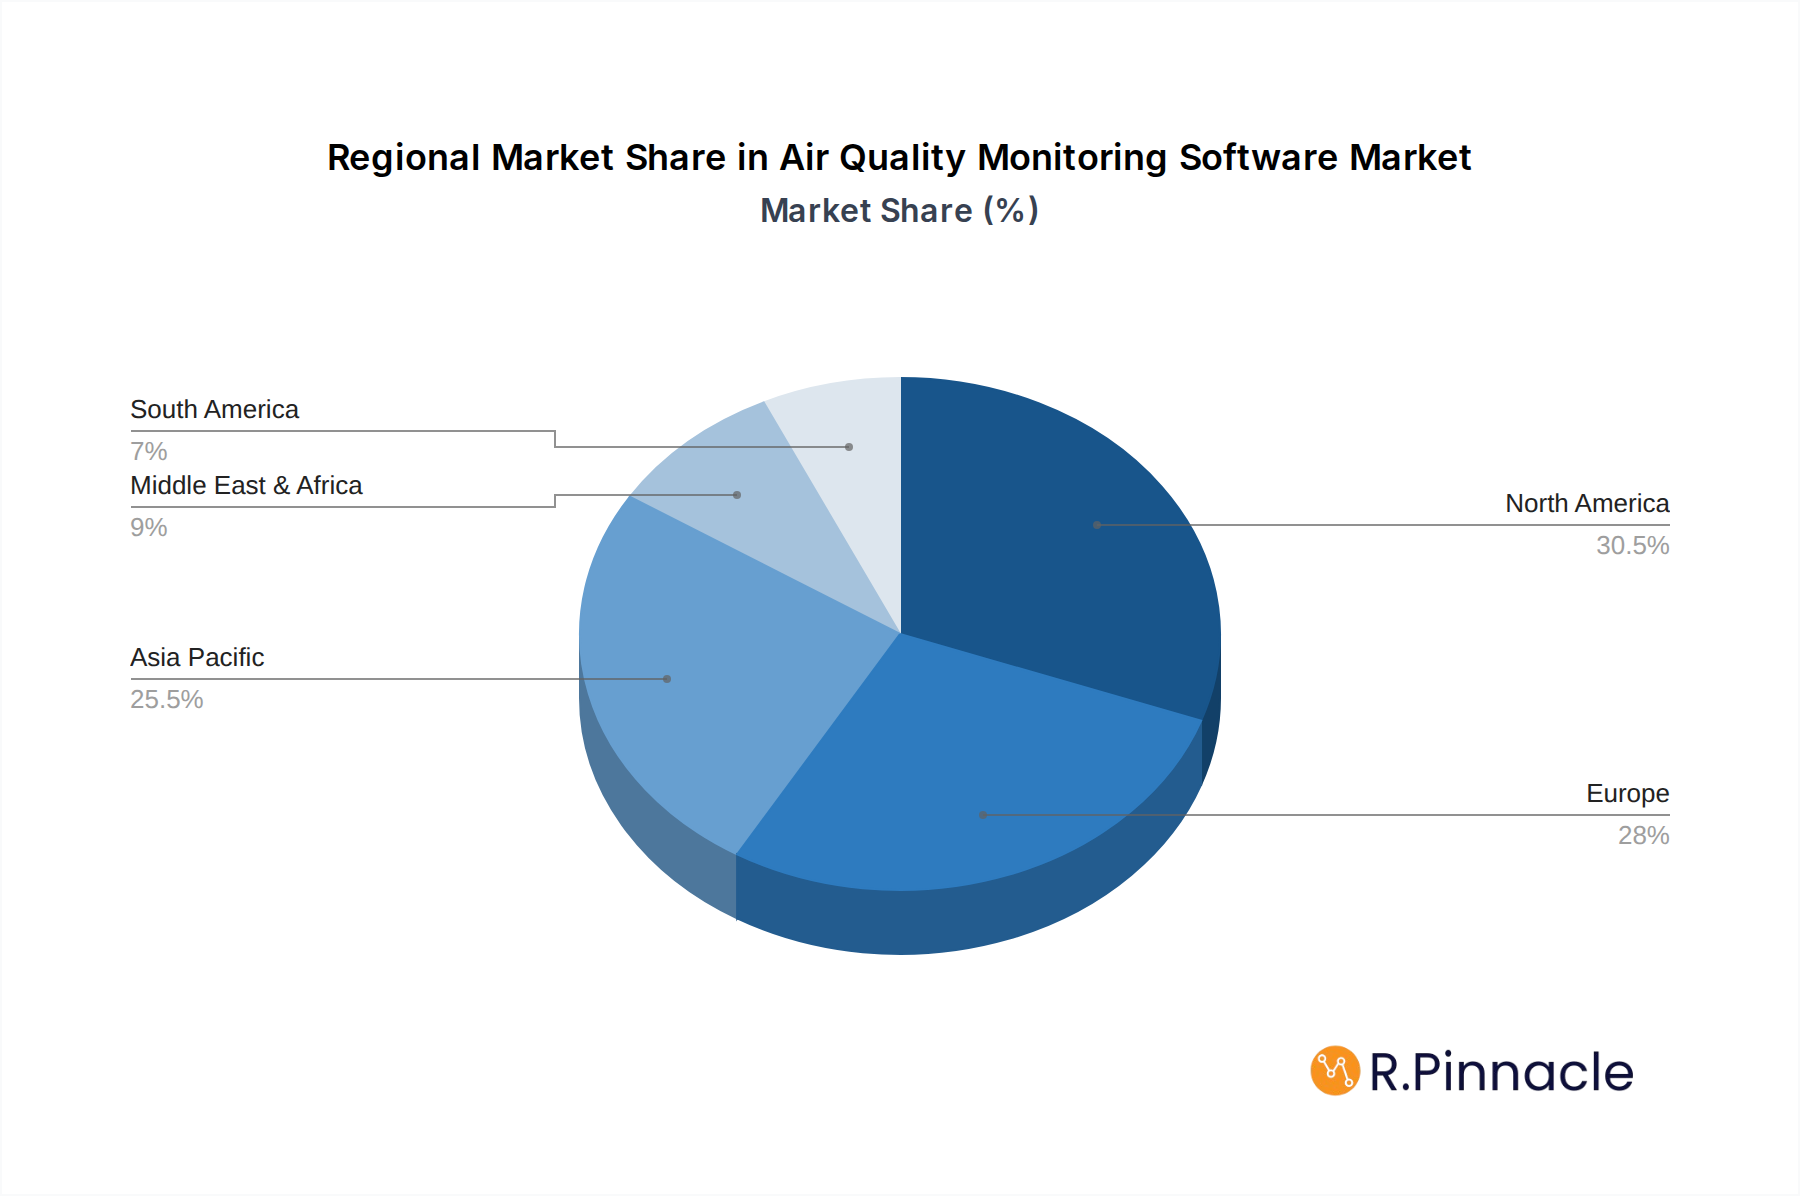
Air Quality Monitoring Software Regional Market Share
Geographic Coverage of Air Quality Monitoring Software
Air Quality Monitoring Software REPORT HIGHLIGHTS
| Aspects | Details |
|---|---|
| Study Period | 2020-2034 |
| Base Year | 2025 |
| Estimated Year | 2026 |
| Forecast Period | 2026-2034 |
| Historical Period | 2020-2025 |
| Growth Rate | CAGR of 4% from 2020-2034 |
| Segmentation |
|
Table of Contents
- 1. Introduction
- 1.1. Research Scope
- 1.2. Market Segmentation
- 1.3. Research Methodology
- 1.4. Definitions and Assumptions
- 2. Executive Summary
- 2.1. Introduction
- 3. Market Dynamics
- 3.1. Introduction
- 3.2. Market Drivers
- 3.3. Market Restrains
- 3.4. Market Trends
- 4. Market Factor Analysis
- 4.1. Porters Five Forces
- 4.2. Supply/Value Chain
- 4.3. PESTEL analysis
- 4.4. Market Entropy
- 4.5. Patent/Trademark Analysis
- 5. Global Air Quality Monitoring Software Analysis, Insights and Forecast, 2020-2032
- 5.1. Market Analysis, Insights and Forecast - by Application
- 5.1.1. Industries
- 5.1.2. Commercial Bodies
- 5.1.3. Urban Air Quality Monitoring Agencies
- 5.1.4. Government Agencies and Research Institutes
- 5.1.5. Others
- 5.2. Market Analysis, Insights and Forecast - by Type
- 5.2.1. On-Premise
- 5.2.2. Cloud-Based
- 5.3. Market Analysis, Insights and Forecast - by Region
- 5.3.1. North America
- 5.3.2. South America
- 5.3.3. Europe
- 5.3.4. Middle East & Africa
- 5.3.5. Asia Pacific
- 5.1. Market Analysis, Insights and Forecast - by Application
- 6. North America Air Quality Monitoring Software Analysis, Insights and Forecast, 2020-2032
- 6.1. Market Analysis, Insights and Forecast - by Application
- 6.1.1. Industries
- 6.1.2. Commercial Bodies
- 6.1.3. Urban Air Quality Monitoring Agencies
- 6.1.4. Government Agencies and Research Institutes
- 6.1.5. Others
- 6.2. Market Analysis, Insights and Forecast - by Type
- 6.2.1. On-Premise
- 6.2.2. Cloud-Based
- 6.1. Market Analysis, Insights and Forecast - by Application
- 7. South America Air Quality Monitoring Software Analysis, Insights and Forecast, 2020-2032
- 7.1. Market Analysis, Insights and Forecast - by Application
- 7.1.1. Industries
- 7.1.2. Commercial Bodies
- 7.1.3. Urban Air Quality Monitoring Agencies
- 7.1.4. Government Agencies and Research Institutes
- 7.1.5. Others
- 7.2. Market Analysis, Insights and Forecast - by Type
- 7.2.1. On-Premise
- 7.2.2. Cloud-Based
- 7.1. Market Analysis, Insights and Forecast - by Application
- 8. Europe Air Quality Monitoring Software Analysis, Insights and Forecast, 2020-2032
- 8.1. Market Analysis, Insights and Forecast - by Application
- 8.1.1. Industries
- 8.1.2. Commercial Bodies
- 8.1.3. Urban Air Quality Monitoring Agencies
- 8.1.4. Government Agencies and Research Institutes
- 8.1.5. Others
- 8.2. Market Analysis, Insights and Forecast - by Type
- 8.2.1. On-Premise
- 8.2.2. Cloud-Based
- 8.1. Market Analysis, Insights and Forecast - by Application
- 9. Middle East & Africa Air Quality Monitoring Software Analysis, Insights and Forecast, 2020-2032
- 9.1. Market Analysis, Insights and Forecast - by Application
- 9.1.1. Industries
- 9.1.2. Commercial Bodies
- 9.1.3. Urban Air Quality Monitoring Agencies
- 9.1.4. Government Agencies and Research Institutes
- 9.1.5. Others
- 9.2. Market Analysis, Insights and Forecast - by Type
- 9.2.1. On-Premise
- 9.2.2. Cloud-Based
- 9.1. Market Analysis, Insights and Forecast - by Application
- 10. Asia Pacific Air Quality Monitoring Software Analysis, Insights and Forecast, 2020-2032
- 10.1. Market Analysis, Insights and Forecast - by Application
- 10.1.1. Industries
- 10.1.2. Commercial Bodies
- 10.1.3. Urban Air Quality Monitoring Agencies
- 10.1.4. Government Agencies and Research Institutes
- 10.1.5. Others
- 10.2. Market Analysis, Insights and Forecast - by Type
- 10.2.1. On-Premise
- 10.2.2. Cloud-Based
- 10.1. Market Analysis, Insights and Forecast - by Application
- 11. Competitive Analysis
- 11.1. Global Market Share Analysis 2025
- 11.2. Company Profiles
- 11.2.1 3M Company
- 11.2.1.1. Overview
- 11.2.1.2. Products
- 11.2.1.3. SWOT Analysis
- 11.2.1.4. Recent Developments
- 11.2.1.5. Financials (Based on Availability)
- 11.2.2 Teledyne Technologies Incorporated
- 11.2.2.1. Overview
- 11.2.2.2. Products
- 11.2.2.3. SWOT Analysis
- 11.2.2.4. Recent Developments
- 11.2.2.5. Financials (Based on Availability)
- 11.2.3 Aeroqual Limited
- 11.2.3.1. Overview
- 11.2.3.2. Products
- 11.2.3.3. SWOT Analysis
- 11.2.3.4. Recent Developments
- 11.2.3.5. Financials (Based on Availability)
- 11.2.4 Horiba Ltd.
- 11.2.4.1. Overview
- 11.2.4.2. Products
- 11.2.4.3. SWOT Analysis
- 11.2.4.4. Recent Developments
- 11.2.4.5. Financials (Based on Availability)
- 11.2.5 Opsis AB
- 11.2.5.1. Overview
- 11.2.5.2. Products
- 11.2.5.3. SWOT Analysis
- 11.2.5.4. Recent Developments
- 11.2.5.5. Financials (Based on Availability)
- 11.2.6 Environnement S.A
- 11.2.6.1. Overview
- 11.2.6.2. Products
- 11.2.6.3. SWOT Analysis
- 11.2.6.4. Recent Developments
- 11.2.6.5. Financials (Based on Availability)
- 11.2.7 Kisters AG
- 11.2.7.1. Overview
- 11.2.7.2. Products
- 11.2.7.3. SWOT Analysis
- 11.2.7.4. Recent Developments
- 11.2.7.5. Financials (Based on Availability)
- 11.2.8 Lakes Environmental Software
- 11.2.8.1. Overview
- 11.2.8.2. Products
- 11.2.8.3. SWOT Analysis
- 11.2.8.4. Recent Developments
- 11.2.8.5. Financials (Based on Availability)
- 11.2.9 Robert Bosch GmbH
- 11.2.9.1. Overview
- 11.2.9.2. Products
- 11.2.9.3. SWOT Analysis
- 11.2.9.4. Recent Developments
- 11.2.9.5. Financials (Based on Availability)
- 11.2.10 Air Monitors Ltd
- 11.2.10.1. Overview
- 11.2.10.2. Products
- 11.2.10.3. SWOT Analysis
- 11.2.10.4. Recent Developments
- 11.2.10.5. Financials (Based on Availability)
- 11.2.11 Bruel & Kjaer Sound & Vibration Measurement A/S
- 11.2.11.1. Overview
- 11.2.11.2. Products
- 11.2.11.3. SWOT Analysis
- 11.2.11.4. Recent Developments
- 11.2.11.5. Financials (Based on Availability)
- 11.2.12 Lumasense Technologies
- 11.2.12.1. Overview
- 11.2.12.2. Products
- 11.2.12.3. SWOT Analysis
- 11.2.12.4. Recent Developments
- 11.2.12.5. Financials (Based on Availability)
- 11.2.13 IPS Meteostar
- 11.2.13.1. Overview
- 11.2.13.2. Products
- 11.2.13.3. SWOT Analysis
- 11.2.13.4. Recent Developments
- 11.2.13.5. Financials (Based on Availability)
- 11.2.14 Cambridge Environmental Research Consulatnts Ltd
- 11.2.14.1. Overview
- 11.2.14.2. Products
- 11.2.14.3. SWOT Analysis
- 11.2.14.4. Recent Developments
- 11.2.14.5. Financials (Based on Availability)
- 11.2.1 3M Company
List of Figures
- Figure 1: Global Air Quality Monitoring Software Revenue Breakdown (million, %) by Region 2025 & 2033
- Figure 2: North America Air Quality Monitoring Software Revenue (million), by Application 2025 & 2033
- Figure 3: North America Air Quality Monitoring Software Revenue Share (%), by Application 2025 & 2033
- Figure 4: North America Air Quality Monitoring Software Revenue (million), by Type 2025 & 2033
- Figure 5: North America Air Quality Monitoring Software Revenue Share (%), by Type 2025 & 2033
- Figure 6: North America Air Quality Monitoring Software Revenue (million), by Country 2025 & 2033
- Figure 7: North America Air Quality Monitoring Software Revenue Share (%), by Country 2025 & 2033
- Figure 8: South America Air Quality Monitoring Software Revenue (million), by Application 2025 & 2033
- Figure 9: South America Air Quality Monitoring Software Revenue Share (%), by Application 2025 & 2033
- Figure 10: South America Air Quality Monitoring Software Revenue (million), by Type 2025 & 2033
- Figure 11: South America Air Quality Monitoring Software Revenue Share (%), by Type 2025 & 2033
- Figure 12: South America Air Quality Monitoring Software Revenue (million), by Country 2025 & 2033
- Figure 13: South America Air Quality Monitoring Software Revenue Share (%), by Country 2025 & 2033
- Figure 14: Europe Air Quality Monitoring Software Revenue (million), by Application 2025 & 2033
- Figure 15: Europe Air Quality Monitoring Software Revenue Share (%), by Application 2025 & 2033
- Figure 16: Europe Air Quality Monitoring Software Revenue (million), by Type 2025 & 2033
- Figure 17: Europe Air Quality Monitoring Software Revenue Share (%), by Type 2025 & 2033
- Figure 18: Europe Air Quality Monitoring Software Revenue (million), by Country 2025 & 2033
- Figure 19: Europe Air Quality Monitoring Software Revenue Share (%), by Country 2025 & 2033
- Figure 20: Middle East & Africa Air Quality Monitoring Software Revenue (million), by Application 2025 & 2033
- Figure 21: Middle East & Africa Air Quality Monitoring Software Revenue Share (%), by Application 2025 & 2033
- Figure 22: Middle East & Africa Air Quality Monitoring Software Revenue (million), by Type 2025 & 2033
- Figure 23: Middle East & Africa Air Quality Monitoring Software Revenue Share (%), by Type 2025 & 2033
- Figure 24: Middle East & Africa Air Quality Monitoring Software Revenue (million), by Country 2025 & 2033
- Figure 25: Middle East & Africa Air Quality Monitoring Software Revenue Share (%), by Country 2025 & 2033
- Figure 26: Asia Pacific Air Quality Monitoring Software Revenue (million), by Application 2025 & 2033
- Figure 27: Asia Pacific Air Quality Monitoring Software Revenue Share (%), by Application 2025 & 2033
- Figure 28: Asia Pacific Air Quality Monitoring Software Revenue (million), by Type 2025 & 2033
- Figure 29: Asia Pacific Air Quality Monitoring Software Revenue Share (%), by Type 2025 & 2033
- Figure 30: Asia Pacific Air Quality Monitoring Software Revenue (million), by Country 2025 & 2033
- Figure 31: Asia Pacific Air Quality Monitoring Software Revenue Share (%), by Country 2025 & 2033
List of Tables
- Table 1: Global Air Quality Monitoring Software Revenue million Forecast, by Application 2020 & 2033
- Table 2: Global Air Quality Monitoring Software Revenue million Forecast, by Type 2020 & 2033
- Table 3: Global Air Quality Monitoring Software Revenue million Forecast, by Region 2020 & 2033
- Table 4: Global Air Quality Monitoring Software Revenue million Forecast, by Application 2020 & 2033
- Table 5: Global Air Quality Monitoring Software Revenue million Forecast, by Type 2020 & 2033
- Table 6: Global Air Quality Monitoring Software Revenue million Forecast, by Country 2020 & 2033
- Table 7: United States Air Quality Monitoring Software Revenue (million) Forecast, by Application 2020 & 2033
- Table 8: Canada Air Quality Monitoring Software Revenue (million) Forecast, by Application 2020 & 2033
- Table 9: Mexico Air Quality Monitoring Software Revenue (million) Forecast, by Application 2020 & 2033
- Table 10: Global Air Quality Monitoring Software Revenue million Forecast, by Application 2020 & 2033
- Table 11: Global Air Quality Monitoring Software Revenue million Forecast, by Type 2020 & 2033
- Table 12: Global Air Quality Monitoring Software Revenue million Forecast, by Country 2020 & 2033
- Table 13: Brazil Air Quality Monitoring Software Revenue (million) Forecast, by Application 2020 & 2033
- Table 14: Argentina Air Quality Monitoring Software Revenue (million) Forecast, by Application 2020 & 2033
- Table 15: Rest of South America Air Quality Monitoring Software Revenue (million) Forecast, by Application 2020 & 2033
- Table 16: Global Air Quality Monitoring Software Revenue million Forecast, by Application 2020 & 2033
- Table 17: Global Air Quality Monitoring Software Revenue million Forecast, by Type 2020 & 2033
- Table 18: Global Air Quality Monitoring Software Revenue million Forecast, by Country 2020 & 2033
- Table 19: United Kingdom Air Quality Monitoring Software Revenue (million) Forecast, by Application 2020 & 2033
- Table 20: Germany Air Quality Monitoring Software Revenue (million) Forecast, by Application 2020 & 2033
- Table 21: France Air Quality Monitoring Software Revenue (million) Forecast, by Application 2020 & 2033
- Table 22: Italy Air Quality Monitoring Software Revenue (million) Forecast, by Application 2020 & 2033
- Table 23: Spain Air Quality Monitoring Software Revenue (million) Forecast, by Application 2020 & 2033
- Table 24: Russia Air Quality Monitoring Software Revenue (million) Forecast, by Application 2020 & 2033
- Table 25: Benelux Air Quality Monitoring Software Revenue (million) Forecast, by Application 2020 & 2033
- Table 26: Nordics Air Quality Monitoring Software Revenue (million) Forecast, by Application 2020 & 2033
- Table 27: Rest of Europe Air Quality Monitoring Software Revenue (million) Forecast, by Application 2020 & 2033
- Table 28: Global Air Quality Monitoring Software Revenue million Forecast, by Application 2020 & 2033
- Table 29: Global Air Quality Monitoring Software Revenue million Forecast, by Type 2020 & 2033
- Table 30: Global Air Quality Monitoring Software Revenue million Forecast, by Country 2020 & 2033
- Table 31: Turkey Air Quality Monitoring Software Revenue (million) Forecast, by Application 2020 & 2033
- Table 32: Israel Air Quality Monitoring Software Revenue (million) Forecast, by Application 2020 & 2033
- Table 33: GCC Air Quality Monitoring Software Revenue (million) Forecast, by Application 2020 & 2033
- Table 34: North Africa Air Quality Monitoring Software Revenue (million) Forecast, by Application 2020 & 2033
- Table 35: South Africa Air Quality Monitoring Software Revenue (million) Forecast, by Application 2020 & 2033
- Table 36: Rest of Middle East & Africa Air Quality Monitoring Software Revenue (million) Forecast, by Application 2020 & 2033
- Table 37: Global Air Quality Monitoring Software Revenue million Forecast, by Application 2020 & 2033
- Table 38: Global Air Quality Monitoring Software Revenue million Forecast, by Type 2020 & 2033
- Table 39: Global Air Quality Monitoring Software Revenue million Forecast, by Country 2020 & 2033
- Table 40: China Air Quality Monitoring Software Revenue (million) Forecast, by Application 2020 & 2033
- Table 41: India Air Quality Monitoring Software Revenue (million) Forecast, by Application 2020 & 2033
- Table 42: Japan Air Quality Monitoring Software Revenue (million) Forecast, by Application 2020 & 2033
- Table 43: South Korea Air Quality Monitoring Software Revenue (million) Forecast, by Application 2020 & 2033
- Table 44: ASEAN Air Quality Monitoring Software Revenue (million) Forecast, by Application 2020 & 2033
- Table 45: Oceania Air Quality Monitoring Software Revenue (million) Forecast, by Application 2020 & 2033
- Table 46: Rest of Asia Pacific Air Quality Monitoring Software Revenue (million) Forecast, by Application 2020 & 2033
Frequently Asked Questions
1. What is the projected Compound Annual Growth Rate (CAGR) of the Air Quality Monitoring Software?
The projected CAGR is approximately 4%.
2. Which companies are prominent players in the Air Quality Monitoring Software?
Key companies in the market include 3M Company, Teledyne Technologies Incorporated, Aeroqual Limited, Horiba, Ltd., Opsis AB, Environnement S.A, Kisters AG, Lakes Environmental Software, Robert Bosch GmbH, Air Monitors Ltd, Bruel & Kjaer Sound & Vibration Measurement A/S, Lumasense Technologies, IPS Meteostar, Cambridge Environmental Research Consulatnts Ltd.
3. What are the main segments of the Air Quality Monitoring Software?
The market segments include Application, Type.
4. Can you provide details about the market size?
The market size is estimated to be USD 543 million as of 2022.
5. What are some drivers contributing to market growth?
N/A
6. What are the notable trends driving market growth?
N/A
7. Are there any restraints impacting market growth?
N/A
8. Can you provide examples of recent developments in the market?
N/A
9. What pricing options are available for accessing the report?
Pricing options include single-user, multi-user, and enterprise licenses priced at USD 3950.00, USD 5925.00, and USD 7900.00 respectively.
10. Is the market size provided in terms of value or volume?
The market size is provided in terms of value, measured in million.
11. Are there any specific market keywords associated with the report?
Yes, the market keyword associated with the report is "Air Quality Monitoring Software," which aids in identifying and referencing the specific market segment covered.
12. How do I determine which pricing option suits my needs best?
The pricing options vary based on user requirements and access needs. Individual users may opt for single-user licenses, while businesses requiring broader access may choose multi-user or enterprise licenses for cost-effective access to the report.
13. Are there any additional resources or data provided in the Air Quality Monitoring Software report?
While the report offers comprehensive insights, it's advisable to review the specific contents or supplementary materials provided to ascertain if additional resources or data are available.
14. How can I stay updated on further developments or reports in the Air Quality Monitoring Software?
To stay informed about further developments, trends, and reports in the Air Quality Monitoring Software, consider subscribing to industry newsletters, following relevant companies and organizations, or regularly checking reputable industry news sources and publications.
Methodology
Step 1 - Identification of Relevant Samples Size from Population Database


Step 2 - Approaches for Defining Global Market Size (Value, Volume* & Price*)

Note*: In applicable scenarios
Step 3 - Data Sources
Primary Research
- Web Analytics
- Survey Reports
- Research Institute
- Latest Research Reports
- Opinion Leaders
Secondary Research
- Annual Reports
- White Paper
- Latest Press Release
- Industry Association
- Paid Database
- Investor Presentations

Step 4 - Data Triangulation
Involves using different sources of information in order to increase the validity of a study
These sources are likely to be stakeholders in a program - participants, other researchers, program staff, other community members, and so on.
Then we put all data in single framework & apply various statistical tools to find out the dynamic on the market.
During the analysis stage, feedback from the stakeholder groups would be compared to determine areas of agreement as well as areas of divergence