
Key Insights
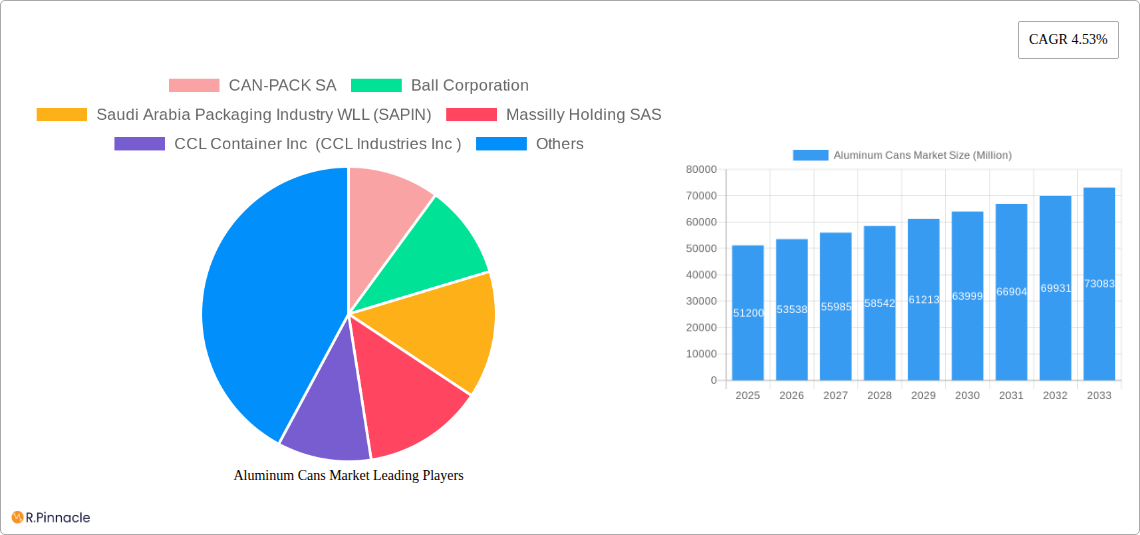
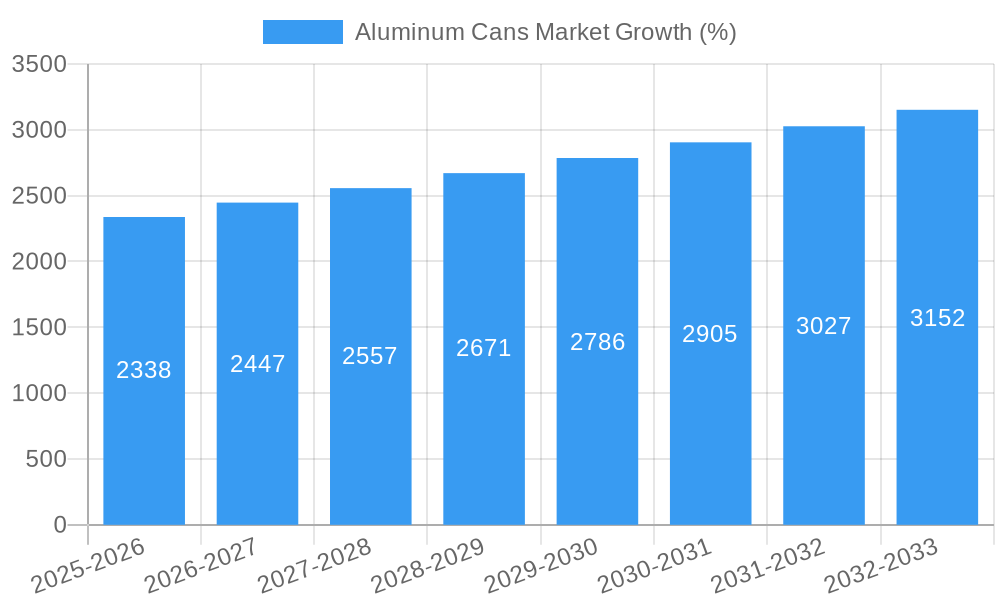
The global aluminum cans market, valued at $51.20 billion in 2025, is projected to experience robust growth, driven by a compound annual growth rate (CAGR) of 4.53% from 2025 to 2033. This expansion is fueled by several key factors. The surging demand for convenient and sustainable packaging solutions across the beverage and food industries is a primary driver. Consumers increasingly prefer aluminum cans due to their recyclability and lightweight nature, aligning with growing environmental consciousness. Furthermore, advancements in can manufacturing technologies, including improved printing and design capabilities, are enhancing product appeal and expanding market applications. The rise of ready-to-drink beverages and the increasing popularity of craft beers and sodas further contribute to market growth. While fluctuating aluminum prices and potential regulatory changes pose challenges, the overall market outlook remains positive, particularly in regions with strong economic growth and expanding consumer bases, such as Asia-Pacific and Latin America. The market segmentation by type (slim, sleek, standard, other) and end-user industry (beverage, food, aerosol, other) reflects diverse application areas, indicating ample opportunities for specialized product development and targeted marketing strategies. Major players like Ball Corporation and Crown Holdings Inc. are actively investing in capacity expansion and innovative product offerings to capitalize on these opportunities.
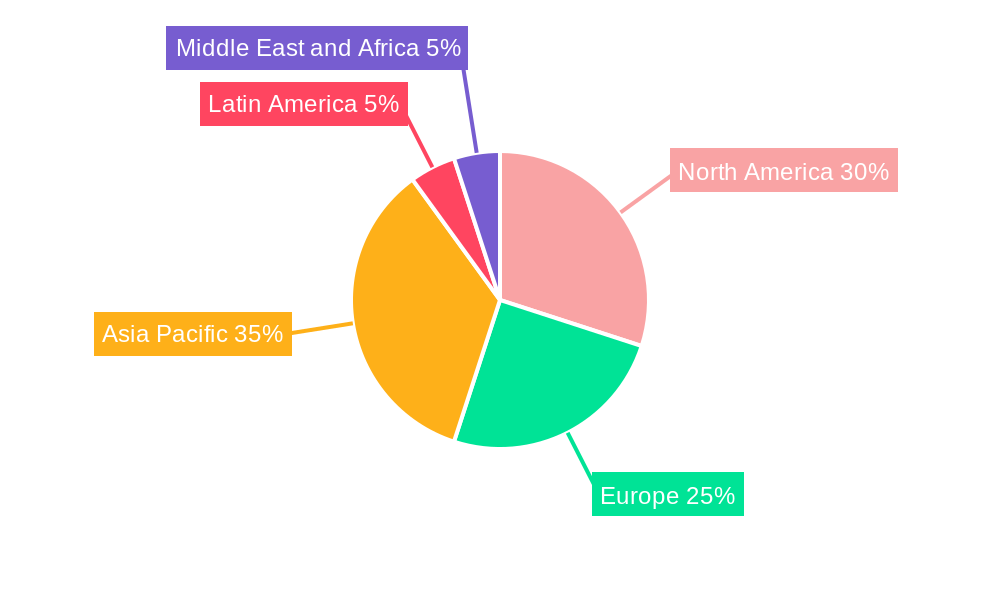
The market's geographic distribution reveals significant regional variations. North America and Europe currently hold substantial market shares, reflecting established consumer preferences and robust packaging industries. However, the Asia-Pacific region is anticipated to experience the most significant growth in the forecast period, driven by rapid urbanization, rising disposable incomes, and increasing demand for packaged goods in developing economies. This dynamic landscape presents both challenges and opportunities for established and emerging players. Companies are likely to focus on strategies that combine sustainable practices with cost-effectiveness to navigate the evolving market dynamics successfully. The strategic use of partnerships, mergers and acquisitions, and focused investments in research and development will play a critical role in achieving market leadership.
Aluminum Cans Market: A Comprehensive Report (2019-2033)
This in-depth report provides a comprehensive analysis of the global Aluminum Cans Market, offering invaluable insights for industry professionals, investors, and strategic decision-makers. With a meticulous study period spanning 2019-2033 (Base Year: 2025, Estimated Year: 2025, Forecast Period: 2025-2033, Historical Period: 2019-2024), this report meticulously examines market dynamics, growth drivers, challenges, and emerging opportunities. The report is packed with actionable data and forecasts, presented in a clear and concise manner to facilitate informed business strategies.
Aluminum Cans Market Structure & Innovation Trends
This section analyzes the competitive landscape of the aluminum cans market, examining market concentration, innovation drivers, regulatory frameworks, product substitutes, end-user demographics, and merger and acquisition (M&A) activities. The market is characterized by a moderately concentrated structure, with key players such as Ball Corporation and Crown Holdings Inc holding significant market share. However, regional players also contribute substantially, leading to diverse competitive dynamics.
- Market Concentration: The top 5 players account for approximately xx% of the global market share in 2025.
- Innovation Drivers: Sustainability initiatives, lightweighting technologies, and advancements in printing and decoration techniques are driving innovation.
- Regulatory Frameworks: Stringent environmental regulations related to recycling and waste management are shaping industry practices.
- Product Substitutes: Alternatives like glass bottles and plastic containers pose competitive challenges, but aluminum's recyclability provides a significant advantage.
- End-User Demographics: The growing demand for convenient packaging in the beverage and food industries fuels market growth.
- M&A Activities: The aluminum cans market has witnessed several significant M&A activities in recent years, with deal values totaling xx Million. These activities are primarily driven by expansion strategies and technological integration.
Aluminum Cans Market Dynamics & Trends
This section delves into the key market dynamics, including growth drivers, technological disruptions, consumer preferences, and competitive dynamics. The global aluminum cans market is experiencing robust growth, driven primarily by increasing demand from the beverage sector and a growing preference for lightweight and recyclable packaging. The CAGR for the forecast period (2025-2033) is estimated at xx%. Market penetration in developing economies is also on the rise, significantly contributing to overall growth. Technological advancements in can manufacturing and recycling are further propelling market expansion. Intense competition among major players necessitates continuous innovation and strategic partnerships to maintain market share.
Dominant Regions & Segments in Aluminum Cans Market
This section identifies the leading regions and segments within the aluminum cans market. Based on our analysis, the [Region Name, e.g., North America] region dominates the market, driven by factors such as robust economic growth, established infrastructure, and high per capita consumption.
- By Type: The standard aluminum cans segment holds the largest market share, but the sleek and slim can segments are experiencing rapid growth.
- By End-user Industry: The beverage industry is the largest end-user, followed by the food industry. Growth in both segments is propelled by demand for convenient and eco-friendly packaging.
- Key Drivers for [Region Name]: Strong economic growth, high consumer spending on packaged goods, and well-established distribution networks.
- Key Drivers for Beverage Industry: Increasing demand for carbonated soft drinks, ready-to-drink beverages, and alcoholic beverages.
Aluminum Cans Market Product Innovations
Recent innovations focus on enhancing recyclability, reducing material weight, and improving aesthetic appeal. This includes the development of thinner aluminum alloys, advanced printing technologies, and innovative can designs (e.g., sleek, slim). These innovations cater to both consumer preference for sustainable products and manufacturers' need for cost efficiency.
Report Scope & Segmentation Analysis
This report segments the aluminum cans market by type (Slim, Sleek, Standard, Other Types) and end-user industry (Beverage, Food, Aerosol, Other End-user Industries). Each segment's growth projection, market size, and competitive dynamics are analyzed in detail. The beverage segment is projected to maintain its dominance, driven by the rising consumption of beverages globally. The food segment is also exhibiting robust growth. The slim and sleek can segments are projected to outpace the standard segment in terms of growth rate.
Key Drivers of Aluminum Cans Market Growth
The aluminum cans market's growth is driven by several factors: rising demand for convenient packaging, the growing preference for sustainable and recyclable materials, and technological advancements in can manufacturing and recycling processes. Government regulations promoting sustainability and increased recycling rates also contribute significantly.
Challenges in the Aluminum Cans Market Sector
The industry faces challenges including fluctuating aluminum prices, stringent environmental regulations, and intense competition from alternative packaging materials. Supply chain disruptions and the need for continuous innovation to maintain competitiveness add to the challenges.
Emerging Opportunities in Aluminum Cans Market
Emerging opportunities include the growing demand for lightweight cans, expansion into new markets, particularly in developing economies, and the integration of smart packaging technologies. The focus on sustainable practices presents significant opportunities for companies embracing circular economy models.
Leading Players in the Aluminum Cans Market
- CAN-PACK SA
- Ball Corporation (Ball Corporation)
- Saudi Arabia Packaging Industry WLL (SAPIN)
- Massilly Holding SAS
- CCL Container Inc (CCL Industries Inc)
- Crown Holdings Inc (Crown Holdings Inc)
- CPMC HOLDINGS Limited (COFCO Group)
- Ardagh Group S A (Ardagh Group)
- Silgan Holdings Inc (Silgan Holdings Inc)
- Tecnocap Group
Key Developments in Aluminum Cans Market Industry
- December 2023: Crown Holdings announced an initiative to boost aluminum can recycling rates through investment in AI-powered robotics for material recovery facilities. This is expected to significantly increase the volume of recycled aluminum.
- February 2024: Emirates Global Aluminium (EGA) partnered with Crown and CANPACK to launch the "Every Can Counts" recycling campaign in the UAE, promoting a circular economy.
Future Outlook for Aluminum Cans Market
The aluminum cans market is poised for continued growth, driven by increasing demand, technological innovations, and a greater emphasis on sustainability. Companies focusing on eco-friendly practices and innovative product designs are expected to capture significant market share in the coming years. The market's future potential hinges on further advancements in recycling technologies and expanding consumer awareness of sustainable packaging choices.
Aluminum Cans Market Segmentation
-
1. Type
- 1.1. Slim
- 1.2. Sleek
- 1.3. Standard
- 1.4. Other Types
-
2. End-user Industry
- 2.1. Beverage
- 2.2. Food
- 2.3. Aerosol
- 2.4. Other End-user Industries
Aluminum Cans Market Segmentation By Geography
-
1. North America
- 1.1. United States
- 1.2. Canada
-
2. Europe
- 2.1. United Kingdom
- 2.2. Germany
- 2.3. France
- 2.4. Spain
- 2.5. Rest of Europe
-
3. Asia Pacific
- 3.1. China
- 3.2. India
- 3.3. Japan
- 3.4. South Korea
- 3.5. Thailand
- 3.6. Rest of Asia Pacific
-
4. Latin America
- 4.1. Brazil
- 4.2. Mexico
- 4.3. Rest of Latin America
-
5. Middle East and Africa
- 5.1. United Arab Emirates
- 5.2. Saudi Arabia
- 5.3. South Africa
- 5.4. Rest of Middle East
Aluminum Cans Market REPORT HIGHLIGHTS
| Aspects | Details |
|---|---|
| Study Period | 2019-2033 |
| Base Year | 2024 |
| Estimated Year | 2025 |
| Forecast Period | 2025-2033 |
| Historical Period | 2019-2024 |
| Growth Rate | CAGR of 4.53% from 2019-2033 |
| Segmentation |
|
Table of Contents
- 1. Introduction
- 1.1. Research Scope
- 1.2. Market Segmentation
- 1.3. Research Methodology
- 1.4. Definitions and Assumptions
- 2. Executive Summary
- 2.1. Introduction
- 3. Market Dynamics
- 3.1. Introduction
- 3.2. Market Drivers
- 3.2.1. High Recyclability Rates of Aluminum Cans; Increasing Demand for Canned Foods driven by Cost and Convenience-related Advantages
- 3.3. Market Restrains
- 3.3.1. Availability of Alternative Packaging Solutions
- 3.4. Market Trends
- 3.4.1. Food and Beverages Segment to Drive the Market
- 4. Market Factor Analysis
- 4.1. Porters Five Forces
- 4.2. Supply/Value Chain
- 4.3. PESTEL analysis
- 4.4. Market Entropy
- 4.5. Patent/Trademark Analysis
- 5. Global Aluminum Cans Market Analysis, Insights and Forecast, 2019-2031
- 5.1. Market Analysis, Insights and Forecast - by Type
- 5.1.1. Slim
- 5.1.2. Sleek
- 5.1.3. Standard
- 5.1.4. Other Types
- 5.2. Market Analysis, Insights and Forecast - by End-user Industry
- 5.2.1. Beverage
- 5.2.2. Food
- 5.2.3. Aerosol
- 5.2.4. Other End-user Industries
- 5.3. Market Analysis, Insights and Forecast - by Region
- 5.3.1. North America
- 5.3.2. Europe
- 5.3.3. Asia Pacific
- 5.3.4. Latin America
- 5.3.5. Middle East and Africa
- 5.1. Market Analysis, Insights and Forecast - by Type
- 6. North America Aluminum Cans Market Analysis, Insights and Forecast, 2019-2031
- 6.1. Market Analysis, Insights and Forecast - by Type
- 6.1.1. Slim
- 6.1.2. Sleek
- 6.1.3. Standard
- 6.1.4. Other Types
- 6.2. Market Analysis, Insights and Forecast - by End-user Industry
- 6.2.1. Beverage
- 6.2.2. Food
- 6.2.3. Aerosol
- 6.2.4. Other End-user Industries
- 6.1. Market Analysis, Insights and Forecast - by Type
- 7. Europe Aluminum Cans Market Analysis, Insights and Forecast, 2019-2031
- 7.1. Market Analysis, Insights and Forecast - by Type
- 7.1.1. Slim
- 7.1.2. Sleek
- 7.1.3. Standard
- 7.1.4. Other Types
- 7.2. Market Analysis, Insights and Forecast - by End-user Industry
- 7.2.1. Beverage
- 7.2.2. Food
- 7.2.3. Aerosol
- 7.2.4. Other End-user Industries
- 7.1. Market Analysis, Insights and Forecast - by Type
- 8. Asia Pacific Aluminum Cans Market Analysis, Insights and Forecast, 2019-2031
- 8.1. Market Analysis, Insights and Forecast - by Type
- 8.1.1. Slim
- 8.1.2. Sleek
- 8.1.3. Standard
- 8.1.4. Other Types
- 8.2. Market Analysis, Insights and Forecast - by End-user Industry
- 8.2.1. Beverage
- 8.2.2. Food
- 8.2.3. Aerosol
- 8.2.4. Other End-user Industries
- 8.1. Market Analysis, Insights and Forecast - by Type
- 9. Latin America Aluminum Cans Market Analysis, Insights and Forecast, 2019-2031
- 9.1. Market Analysis, Insights and Forecast - by Type
- 9.1.1. Slim
- 9.1.2. Sleek
- 9.1.3. Standard
- 9.1.4. Other Types
- 9.2. Market Analysis, Insights and Forecast - by End-user Industry
- 9.2.1. Beverage
- 9.2.2. Food
- 9.2.3. Aerosol
- 9.2.4. Other End-user Industries
- 9.1. Market Analysis, Insights and Forecast - by Type
- 10. Middle East and Africa Aluminum Cans Market Analysis, Insights and Forecast, 2019-2031
- 10.1. Market Analysis, Insights and Forecast - by Type
- 10.1.1. Slim
- 10.1.2. Sleek
- 10.1.3. Standard
- 10.1.4. Other Types
- 10.2. Market Analysis, Insights and Forecast - by End-user Industry
- 10.2.1. Beverage
- 10.2.2. Food
- 10.2.3. Aerosol
- 10.2.4. Other End-user Industries
- 10.1. Market Analysis, Insights and Forecast - by Type
- 11. North America Aluminum Cans Market Analysis, Insights and Forecast, 2019-2031
- 11.1. Market Analysis, Insights and Forecast - By Country/Sub-region
- 11.1.1 United States
- 11.1.2 Canada
- 12. Europe Aluminum Cans Market Analysis, Insights and Forecast, 2019-2031
- 12.1. Market Analysis, Insights and Forecast - By Country/Sub-region
- 12.1.1 United Kingdom
- 12.1.2 Germany
- 12.1.3 France
- 12.1.4 Spain
- 12.1.5 Rest of Europe
- 13. Asia Pacific Aluminum Cans Market Analysis, Insights and Forecast, 2019-2031
- 13.1. Market Analysis, Insights and Forecast - By Country/Sub-region
- 13.1.1 China
- 13.1.2 India
- 13.1.3 Japan
- 13.1.4 South Korea
- 13.1.5 Thailand
- 13.1.6 Rest of Asia Pacific
- 14. Latin America Aluminum Cans Market Analysis, Insights and Forecast, 2019-2031
- 14.1. Market Analysis, Insights and Forecast - By Country/Sub-region
- 14.1.1 Brazil
- 14.1.2 Mexico
- 14.1.3 Rest of Latin America
- 15. Middle East and Africa Aluminum Cans Market Analysis, Insights and Forecast, 2019-2031
- 15.1. Market Analysis, Insights and Forecast - By Country/Sub-region
- 15.1.1 United Arab Emirates
- 15.1.2 Saudi Arabia
- 15.1.3 South Africa
- 15.1.4 Rest of Middle East
- 16. Competitive Analysis
- 16.1. Global Market Share Analysis 2024
- 16.2. Company Profiles
- 16.2.1 CAN-PACK SA
- 16.2.1.1. Overview
- 16.2.1.2. Products
- 16.2.1.3. SWOT Analysis
- 16.2.1.4. Recent Developments
- 16.2.1.5. Financials (Based on Availability)
- 16.2.2 Ball Corporation
- 16.2.2.1. Overview
- 16.2.2.2. Products
- 16.2.2.3. SWOT Analysis
- 16.2.2.4. Recent Developments
- 16.2.2.5. Financials (Based on Availability)
- 16.2.3 Saudi Arabia Packaging Industry WLL (SAPIN)
- 16.2.3.1. Overview
- 16.2.3.2. Products
- 16.2.3.3. SWOT Analysis
- 16.2.3.4. Recent Developments
- 16.2.3.5. Financials (Based on Availability)
- 16.2.4 Massilly Holding SAS
- 16.2.4.1. Overview
- 16.2.4.2. Products
- 16.2.4.3. SWOT Analysis
- 16.2.4.4. Recent Developments
- 16.2.4.5. Financials (Based on Availability)
- 16.2.5 CCL Container Inc (CCL Industries Inc )
- 16.2.5.1. Overview
- 16.2.5.2. Products
- 16.2.5.3. SWOT Analysis
- 16.2.5.4. Recent Developments
- 16.2.5.5. Financials (Based on Availability)
- 16.2.6 Crown Holdings Inc
- 16.2.6.1. Overview
- 16.2.6.2. Products
- 16.2.6.3. SWOT Analysis
- 16.2.6.4. Recent Developments
- 16.2.6.5. Financials (Based on Availability)
- 16.2.7 CPMC HOLDINGS Limited (COFCO Group
- 16.2.7.1. Overview
- 16.2.7.2. Products
- 16.2.7.3. SWOT Analysis
- 16.2.7.4. Recent Developments
- 16.2.7.5. Financials (Based on Availability)
- 16.2.8 Ardagh Group S A
- 16.2.8.1. Overview
- 16.2.8.2. Products
- 16.2.8.3. SWOT Analysis
- 16.2.8.4. Recent Developments
- 16.2.8.5. Financials (Based on Availability)
- 16.2.9 Silgan Holdings Inc
- 16.2.9.1. Overview
- 16.2.9.2. Products
- 16.2.9.3. SWOT Analysis
- 16.2.9.4. Recent Developments
- 16.2.9.5. Financials (Based on Availability)
- 16.2.10 Tecnocap Group
- 16.2.10.1. Overview
- 16.2.10.2. Products
- 16.2.10.3. SWOT Analysis
- 16.2.10.4. Recent Developments
- 16.2.10.5. Financials (Based on Availability)
- 16.2.1 CAN-PACK SA
List of Figures
- Figure 1: Global Aluminum Cans Market Revenue Breakdown (Million, %) by Region 2024 & 2032
- Figure 2: North America Aluminum Cans Market Revenue (Million), by Country 2024 & 2032
- Figure 3: North America Aluminum Cans Market Revenue Share (%), by Country 2024 & 2032
- Figure 4: Europe Aluminum Cans Market Revenue (Million), by Country 2024 & 2032
- Figure 5: Europe Aluminum Cans Market Revenue Share (%), by Country 2024 & 2032
- Figure 6: Asia Pacific Aluminum Cans Market Revenue (Million), by Country 2024 & 2032
- Figure 7: Asia Pacific Aluminum Cans Market Revenue Share (%), by Country 2024 & 2032
- Figure 8: Latin America Aluminum Cans Market Revenue (Million), by Country 2024 & 2032
- Figure 9: Latin America Aluminum Cans Market Revenue Share (%), by Country 2024 & 2032
- Figure 10: Middle East and Africa Aluminum Cans Market Revenue (Million), by Country 2024 & 2032
- Figure 11: Middle East and Africa Aluminum Cans Market Revenue Share (%), by Country 2024 & 2032
- Figure 12: North America Aluminum Cans Market Revenue (Million), by Type 2024 & 2032
- Figure 13: North America Aluminum Cans Market Revenue Share (%), by Type 2024 & 2032
- Figure 14: North America Aluminum Cans Market Revenue (Million), by End-user Industry 2024 & 2032
- Figure 15: North America Aluminum Cans Market Revenue Share (%), by End-user Industry 2024 & 2032
- Figure 16: North America Aluminum Cans Market Revenue (Million), by Country 2024 & 2032
- Figure 17: North America Aluminum Cans Market Revenue Share (%), by Country 2024 & 2032
- Figure 18: Europe Aluminum Cans Market Revenue (Million), by Type 2024 & 2032
- Figure 19: Europe Aluminum Cans Market Revenue Share (%), by Type 2024 & 2032
- Figure 20: Europe Aluminum Cans Market Revenue (Million), by End-user Industry 2024 & 2032
- Figure 21: Europe Aluminum Cans Market Revenue Share (%), by End-user Industry 2024 & 2032
- Figure 22: Europe Aluminum Cans Market Revenue (Million), by Country 2024 & 2032
- Figure 23: Europe Aluminum Cans Market Revenue Share (%), by Country 2024 & 2032
- Figure 24: Asia Pacific Aluminum Cans Market Revenue (Million), by Type 2024 & 2032
- Figure 25: Asia Pacific Aluminum Cans Market Revenue Share (%), by Type 2024 & 2032
- Figure 26: Asia Pacific Aluminum Cans Market Revenue (Million), by End-user Industry 2024 & 2032
- Figure 27: Asia Pacific Aluminum Cans Market Revenue Share (%), by End-user Industry 2024 & 2032
- Figure 28: Asia Pacific Aluminum Cans Market Revenue (Million), by Country 2024 & 2032
- Figure 29: Asia Pacific Aluminum Cans Market Revenue Share (%), by Country 2024 & 2032
- Figure 30: Latin America Aluminum Cans Market Revenue (Million), by Type 2024 & 2032
- Figure 31: Latin America Aluminum Cans Market Revenue Share (%), by Type 2024 & 2032
- Figure 32: Latin America Aluminum Cans Market Revenue (Million), by End-user Industry 2024 & 2032
- Figure 33: Latin America Aluminum Cans Market Revenue Share (%), by End-user Industry 2024 & 2032
- Figure 34: Latin America Aluminum Cans Market Revenue (Million), by Country 2024 & 2032
- Figure 35: Latin America Aluminum Cans Market Revenue Share (%), by Country 2024 & 2032
- Figure 36: Middle East and Africa Aluminum Cans Market Revenue (Million), by Type 2024 & 2032
- Figure 37: Middle East and Africa Aluminum Cans Market Revenue Share (%), by Type 2024 & 2032
- Figure 38: Middle East and Africa Aluminum Cans Market Revenue (Million), by End-user Industry 2024 & 2032
- Figure 39: Middle East and Africa Aluminum Cans Market Revenue Share (%), by End-user Industry 2024 & 2032
- Figure 40: Middle East and Africa Aluminum Cans Market Revenue (Million), by Country 2024 & 2032
- Figure 41: Middle East and Africa Aluminum Cans Market Revenue Share (%), by Country 2024 & 2032
List of Tables
- Table 1: Global Aluminum Cans Market Revenue Million Forecast, by Region 2019 & 2032
- Table 2: Global Aluminum Cans Market Revenue Million Forecast, by Type 2019 & 2032
- Table 3: Global Aluminum Cans Market Revenue Million Forecast, by End-user Industry 2019 & 2032
- Table 4: Global Aluminum Cans Market Revenue Million Forecast, by Region 2019 & 2032
- Table 5: Global Aluminum Cans Market Revenue Million Forecast, by Country 2019 & 2032
- Table 6: United States Aluminum Cans Market Revenue (Million) Forecast, by Application 2019 & 2032
- Table 7: Canada Aluminum Cans Market Revenue (Million) Forecast, by Application 2019 & 2032
- Table 8: Global Aluminum Cans Market Revenue Million Forecast, by Country 2019 & 2032
- Table 9: United Kingdom Aluminum Cans Market Revenue (Million) Forecast, by Application 2019 & 2032
- Table 10: Germany Aluminum Cans Market Revenue (Million) Forecast, by Application 2019 & 2032
- Table 11: France Aluminum Cans Market Revenue (Million) Forecast, by Application 2019 & 2032
- Table 12: Spain Aluminum Cans Market Revenue (Million) Forecast, by Application 2019 & 2032
- Table 13: Rest of Europe Aluminum Cans Market Revenue (Million) Forecast, by Application 2019 & 2032
- Table 14: Global Aluminum Cans Market Revenue Million Forecast, by Country 2019 & 2032
- Table 15: China Aluminum Cans Market Revenue (Million) Forecast, by Application 2019 & 2032
- Table 16: India Aluminum Cans Market Revenue (Million) Forecast, by Application 2019 & 2032
- Table 17: Japan Aluminum Cans Market Revenue (Million) Forecast, by Application 2019 & 2032
- Table 18: South Korea Aluminum Cans Market Revenue (Million) Forecast, by Application 2019 & 2032
- Table 19: Thailand Aluminum Cans Market Revenue (Million) Forecast, by Application 2019 & 2032
- Table 20: Rest of Asia Pacific Aluminum Cans Market Revenue (Million) Forecast, by Application 2019 & 2032
- Table 21: Global Aluminum Cans Market Revenue Million Forecast, by Country 2019 & 2032
- Table 22: Brazil Aluminum Cans Market Revenue (Million) Forecast, by Application 2019 & 2032
- Table 23: Mexico Aluminum Cans Market Revenue (Million) Forecast, by Application 2019 & 2032
- Table 24: Rest of Latin America Aluminum Cans Market Revenue (Million) Forecast, by Application 2019 & 2032
- Table 25: Global Aluminum Cans Market Revenue Million Forecast, by Country 2019 & 2032
- Table 26: United Arab Emirates Aluminum Cans Market Revenue (Million) Forecast, by Application 2019 & 2032
- Table 27: Saudi Arabia Aluminum Cans Market Revenue (Million) Forecast, by Application 2019 & 2032
- Table 28: South Africa Aluminum Cans Market Revenue (Million) Forecast, by Application 2019 & 2032
- Table 29: Rest of Middle East Aluminum Cans Market Revenue (Million) Forecast, by Application 2019 & 2032
- Table 30: Global Aluminum Cans Market Revenue Million Forecast, by Type 2019 & 2032
- Table 31: Global Aluminum Cans Market Revenue Million Forecast, by End-user Industry 2019 & 2032
- Table 32: Global Aluminum Cans Market Revenue Million Forecast, by Country 2019 & 2032
- Table 33: United States Aluminum Cans Market Revenue (Million) Forecast, by Application 2019 & 2032
- Table 34: Canada Aluminum Cans Market Revenue (Million) Forecast, by Application 2019 & 2032
- Table 35: Global Aluminum Cans Market Revenue Million Forecast, by Type 2019 & 2032
- Table 36: Global Aluminum Cans Market Revenue Million Forecast, by End-user Industry 2019 & 2032
- Table 37: Global Aluminum Cans Market Revenue Million Forecast, by Country 2019 & 2032
- Table 38: United Kingdom Aluminum Cans Market Revenue (Million) Forecast, by Application 2019 & 2032
- Table 39: Germany Aluminum Cans Market Revenue (Million) Forecast, by Application 2019 & 2032
- Table 40: France Aluminum Cans Market Revenue (Million) Forecast, by Application 2019 & 2032
- Table 41: Spain Aluminum Cans Market Revenue (Million) Forecast, by Application 2019 & 2032
- Table 42: Rest of Europe Aluminum Cans Market Revenue (Million) Forecast, by Application 2019 & 2032
- Table 43: Global Aluminum Cans Market Revenue Million Forecast, by Type 2019 & 2032
- Table 44: Global Aluminum Cans Market Revenue Million Forecast, by End-user Industry 2019 & 2032
- Table 45: Global Aluminum Cans Market Revenue Million Forecast, by Country 2019 & 2032
- Table 46: China Aluminum Cans Market Revenue (Million) Forecast, by Application 2019 & 2032
- Table 47: India Aluminum Cans Market Revenue (Million) Forecast, by Application 2019 & 2032
- Table 48: Japan Aluminum Cans Market Revenue (Million) Forecast, by Application 2019 & 2032
- Table 49: South Korea Aluminum Cans Market Revenue (Million) Forecast, by Application 2019 & 2032
- Table 50: Thailand Aluminum Cans Market Revenue (Million) Forecast, by Application 2019 & 2032
- Table 51: Rest of Asia Pacific Aluminum Cans Market Revenue (Million) Forecast, by Application 2019 & 2032
- Table 52: Global Aluminum Cans Market Revenue Million Forecast, by Type 2019 & 2032
- Table 53: Global Aluminum Cans Market Revenue Million Forecast, by End-user Industry 2019 & 2032
- Table 54: Global Aluminum Cans Market Revenue Million Forecast, by Country 2019 & 2032
- Table 55: Brazil Aluminum Cans Market Revenue (Million) Forecast, by Application 2019 & 2032
- Table 56: Mexico Aluminum Cans Market Revenue (Million) Forecast, by Application 2019 & 2032
- Table 57: Rest of Latin America Aluminum Cans Market Revenue (Million) Forecast, by Application 2019 & 2032
- Table 58: Global Aluminum Cans Market Revenue Million Forecast, by Type 2019 & 2032
- Table 59: Global Aluminum Cans Market Revenue Million Forecast, by End-user Industry 2019 & 2032
- Table 60: Global Aluminum Cans Market Revenue Million Forecast, by Country 2019 & 2032
- Table 61: United Arab Emirates Aluminum Cans Market Revenue (Million) Forecast, by Application 2019 & 2032
- Table 62: Saudi Arabia Aluminum Cans Market Revenue (Million) Forecast, by Application 2019 & 2032
- Table 63: South Africa Aluminum Cans Market Revenue (Million) Forecast, by Application 2019 & 2032
- Table 64: Rest of Middle East Aluminum Cans Market Revenue (Million) Forecast, by Application 2019 & 2032
Frequently Asked Questions
1. What is the projected Compound Annual Growth Rate (CAGR) of the Aluminum Cans Market?
The projected CAGR is approximately 4.53%.
2. Which companies are prominent players in the Aluminum Cans Market?
Key companies in the market include CAN-PACK SA, Ball Corporation, Saudi Arabia Packaging Industry WLL (SAPIN), Massilly Holding SAS, CCL Container Inc (CCL Industries Inc ), Crown Holdings Inc, CPMC HOLDINGS Limited (COFCO Group, Ardagh Group S A, Silgan Holdings Inc, Tecnocap Group.
3. What are the main segments of the Aluminum Cans Market?
The market segments include Type, End-user Industry.
4. Can you provide details about the market size?
The market size is estimated to be USD 51.20 Million as of 2022.
5. What are some drivers contributing to market growth?
High Recyclability Rates of Aluminum Cans; Increasing Demand for Canned Foods driven by Cost and Convenience-related Advantages.
6. What are the notable trends driving market growth?
Food and Beverages Segment to Drive the Market.
7. Are there any restraints impacting market growth?
Availability of Alternative Packaging Solutions.
8. Can you provide examples of recent developments in the market?
February 2024 - Emirates Global Aluminium (EGA), the leading aluminum giant in the UAE, has partnered with beverage can manufacturers Crown and CANPACK to launch "Every Can Counts," an innovative campaign aimed at promoting the recycling of used aluminum drink cans. This initiative, introduced during COP28, represents a crucial step towards fostering a circular economy in the United Arab Emirates.
9. What pricing options are available for accessing the report?
Pricing options include single-user, multi-user, and enterprise licenses priced at USD 4750, USD 5250, and USD 8750 respectively.
10. Is the market size provided in terms of value or volume?
The market size is provided in terms of value, measured in Million.
11. Are there any specific market keywords associated with the report?
Yes, the market keyword associated with the report is "Aluminum Cans Market," which aids in identifying and referencing the specific market segment covered.
12. How do I determine which pricing option suits my needs best?
The pricing options vary based on user requirements and access needs. Individual users may opt for single-user licenses, while businesses requiring broader access may choose multi-user or enterprise licenses for cost-effective access to the report.
13. Are there any additional resources or data provided in the Aluminum Cans Market report?
While the report offers comprehensive insights, it's advisable to review the specific contents or supplementary materials provided to ascertain if additional resources or data are available.
14. How can I stay updated on further developments or reports in the Aluminum Cans Market?
To stay informed about further developments, trends, and reports in the Aluminum Cans Market, consider subscribing to industry newsletters, following relevant companies and organizations, or regularly checking reputable industry news sources and publications.
Methodology
Step 1 - Identification of Relevant Samples Size from Population Database


Step 2 - Approaches for Defining Global Market Size (Value, Volume* & Price*)

Note*: In applicable scenarios
Step 3 - Data Sources
Primary Research
- Web Analytics
- Survey Reports
- Research Institute
- Latest Research Reports
- Opinion Leaders
Secondary Research
- Annual Reports
- White Paper
- Latest Press Release
- Industry Association
- Paid Database
- Investor Presentations

Step 4 - Data Triangulation
Involves using different sources of information in order to increase the validity of a study
These sources are likely to be stakeholders in a program - participants, other researchers, program staff, other community members, and so on.
Then we put all data in single framework & apply various statistical tools to find out the dynamic on the market.
During the analysis stage, feedback from the stakeholder groups would be compared to determine areas of agreement as well as areas of divergence


