
Key Insights
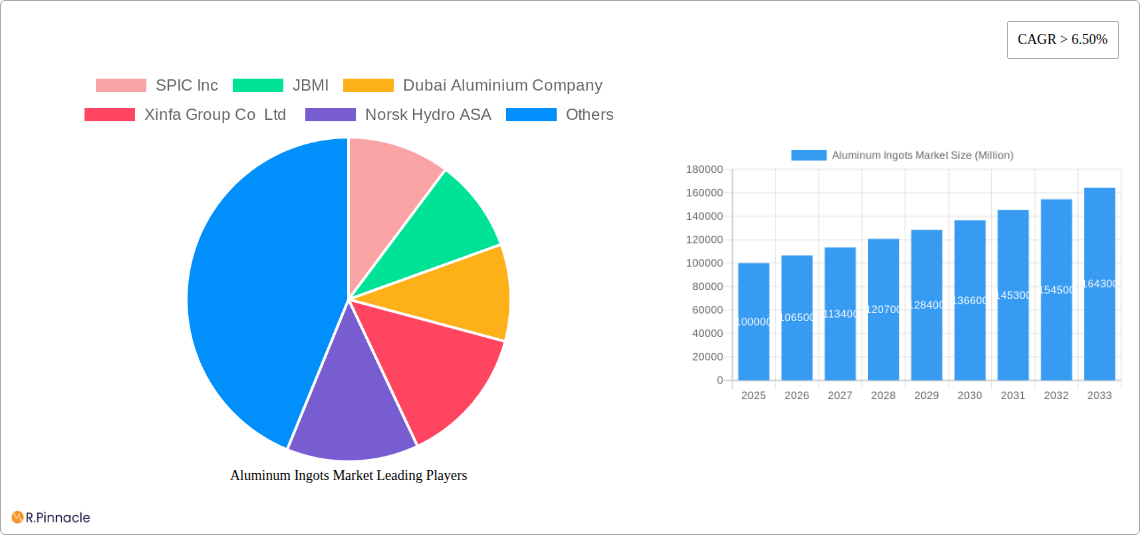
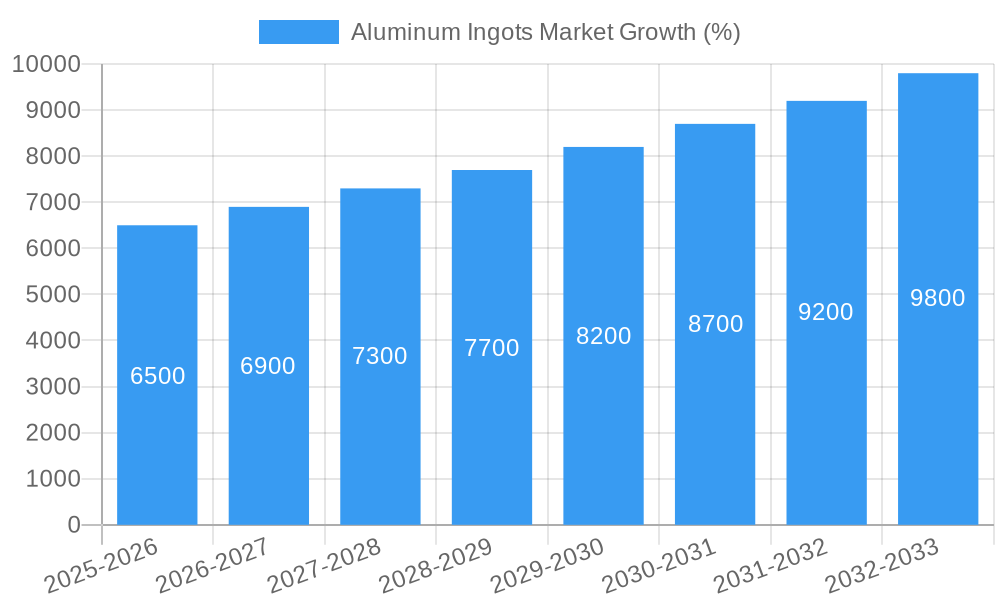
The global aluminum ingots market is experiencing robust growth, driven by the increasing demand from key end-user industries. A Compound Annual Growth Rate (CAGR) exceeding 6.50% from 2019 to 2024 suggests a significant upward trajectory. This expansion is fueled primarily by the burgeoning automotive and aerospace sectors, where lightweight aluminum components are crucial for fuel efficiency and performance enhancement. The construction industry also contributes significantly, utilizing aluminum in building materials and infrastructure projects. The expanding electronics and semiconductor industries further bolster demand for high-purity aluminum ingots used in various components. While fluctuations in raw material prices and global economic conditions represent potential restraints, the overall outlook remains positive. Technological advancements focused on improving production efficiency and the development of sustainable aluminum production methods are contributing to the market's dynamism. Major players, including Alcoa, Rusal, and Norsk Hydro, are strategically investing in capacity expansion and research and development to meet this growing demand. The geographically diverse market sees strong contributions from North America, Europe, and particularly the Asia-Pacific region, driven by rapid industrialization and infrastructure development in countries like China and India. The continued growth in these sectors and ongoing innovations point to sustained expansion in the aluminum ingots market throughout the forecast period (2025-2033).
The market segmentation reveals a significant dependence on the automotive, aerospace, and construction industries, which collectively account for a substantial share of the overall demand. The electrical and electronics sector is also a crucial driver of growth, as is the increasing adoption of aluminum in various applications. The competitive landscape is dominated by several large multinational corporations, which are constantly vying for market share through capacity expansions, strategic acquisitions, and technological innovations. Regional differences in market growth reflect varied levels of industrial development and infrastructure spending. The Asia-Pacific region is projected to witness the highest growth rate due to its robust industrial expansion and significant investments in infrastructure. While challenges such as fluctuating commodity prices and environmental concerns related to aluminum production remain, the long-term prospects for the aluminum ingots market are positive, with continuous growth anticipated over the forecast period, driven by ongoing industrialization and the adoption of sustainable manufacturing practices.
Aluminum Ingots Market: A Comprehensive Report (2019-2033)
This in-depth report provides a comprehensive analysis of the global Aluminum Ingots Market, offering actionable insights for industry professionals, investors, and stakeholders. Covering the period from 2019 to 2033, with a focus on the forecast period of 2025-2033 and a base year of 2025, this report unravels market dynamics, competitive landscapes, and future growth trajectories. The report leverages extensive data analysis to provide a clear understanding of market structure, segmentation, and key players.
Aluminum Ingots Market Structure & Innovation Trends
The Aluminum Ingots market exhibits a moderately concentrated structure, with key players holding significant market share. While precise market share data for each company requires further investigation, companies like Alcoa Inc, RUSAL Plc, and Norsk Hydro ASA are known to be major global players. The market is characterized by ongoing innovation driven by the need for lighter, stronger, and more sustainable aluminum alloys. Regulatory frameworks focusing on environmental sustainability and carbon emissions are shaping production practices and influencing product development. Product substitutes, such as other metals and composites, pose a competitive threat, though aluminum's unique properties often maintain its dominance in specific applications. Mergers and acquisitions (M&A) activity has been moderate in recent years, with deal values varying greatly depending on the size and strategic goals of the companies involved. One example is Rio Tinto's USD 29 Million investment in a recycling facility. The end-user demographics are diverse, ranging from automotive and aerospace to construction and electronics, influencing the demand for various aluminum ingot grades.
- Market Concentration: Moderately Concentrated
- Innovation Drivers: Sustainability, lightweighting, performance enhancement
- Regulatory Frameworks: Emphasis on environmental compliance and carbon footprint reduction.
- M&A Activity: Moderate, with deal values ranging from xx Million to xx Million.
Aluminum Ingots Market Dynamics & Trends
The global Aluminum Ingots market is projected to experience a CAGR of xx% during the forecast period (2025-2033). Several factors contribute to this growth, including increasing demand from the automotive and construction sectors, driven by lightweighting trends in vehicle manufacturing and the expansion of infrastructure projects globally. Technological advancements in aluminum production, such as improved smelting techniques and recycling processes, are also boosting efficiency and reducing costs. Consumer preferences are shifting towards sustainable materials, which further fuels the demand for recycled aluminum and low-carbon aluminum solutions. The competitive dynamics are intense, with leading players focusing on product differentiation, cost optimization, and geographical expansion. Market penetration rates vary across different end-user industries, with automotive and aerospace segments showing higher penetration compared to others.
Dominant Regions & Segments in Aluminum Ingots Market
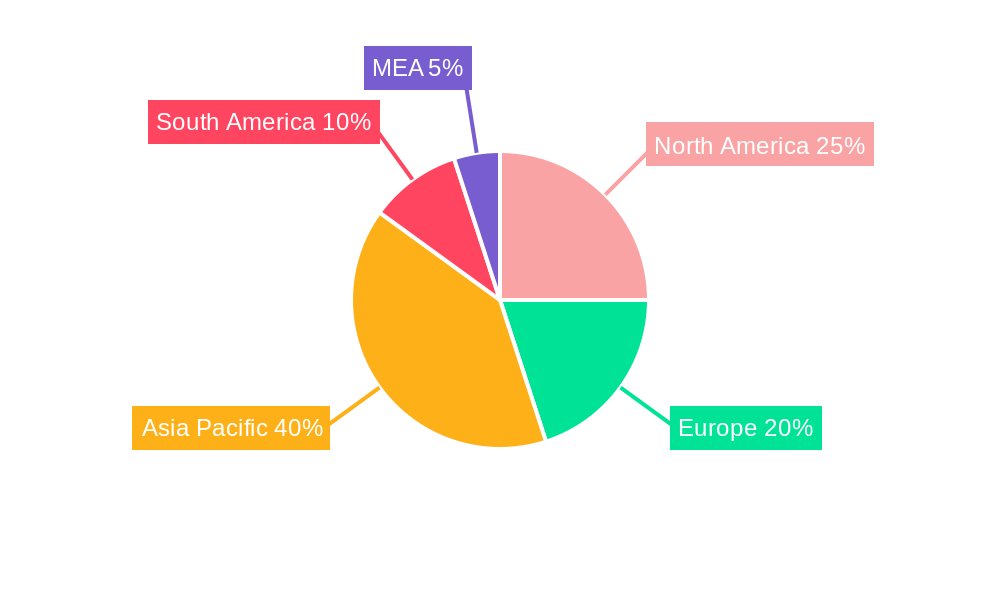
The Asia-Pacific region is currently the dominant market for aluminum ingots, driven by robust economic growth, large-scale infrastructure development, and a growing automotive industry. China, in particular, plays a significant role as a major producer and consumer.
- Key Drivers in Asia-Pacific:
- Rapid industrialization and urbanization
- Growing automotive and construction sectors
- Government support for infrastructure projects
- Dominant Segment: Automotive industry, due to its increasing demand for lightweight materials.
- Other Regions: North America and Europe also hold significant market share, with growth influenced by factors like investments in renewable energy infrastructure and automotive sector expansion.
Detailed Dominance Analysis: While the Asia-Pacific region is currently dominant, other regions show significant potential for growth. North America's strong manufacturing base and focus on sustainable solutions drive demand. Europe, despite some economic fluctuations, is a large and stable market.
Aluminum Ingots Market Product Innovations
Recent product innovations in the aluminum ingots market focus on developing high-strength, lightweight alloys with improved formability and corrosion resistance. These advancements cater to the specific needs of diverse end-user industries, particularly aerospace and automotive. The incorporation of recycled aluminum content in ingots is gaining traction, aligning with the industry's growing emphasis on sustainability. Technological advancements in casting and processing techniques are improving the efficiency and quality of aluminum ingot production.
Report Scope & Segmentation Analysis
This report segments the Aluminum Ingots market based on end-user industry:
Automotive: This segment exhibits high growth potential, driven by lightweighting trends in vehicles and rising vehicle production globally. The market size is projected to reach xx Million by 2033. Competitive dynamics are intense, with major aluminum producers vying for market share.
Aerospace: The aerospace segment demands high-performance, lightweight alloys, driving innovation and specialization in this niche market. The market size is estimated to reach xx Million by 2033.
Building and Construction: Aluminum ingots are used in various construction applications, offering durability and corrosion resistance. Market size is expected at xx Million by 2033.
Semiconductor: This segment requires high-purity aluminum for specific applications, leading to niche product development and high value. Market size is projected at xx Million by 2033.
Electrical and Electronics: Aluminum's electrical conductivity and lightweight properties make it suitable for electronics applications. Market size is projected at xx Million by 2033.
Other End-user Industries: This segment includes packaging, consumer goods, and other miscellaneous applications. Market size is predicted to reach xx Million by 2033.
Key Drivers of Aluminum Ingots Market Growth
Several key factors contribute to the growth of the Aluminum Ingots market: Firstly, the rising demand for lightweight materials in the automotive and aerospace industries is a significant driver. Secondly, the expansion of construction and infrastructure projects globally fuels demand. Finally, increasing adoption of recycled aluminum and growing environmental regulations are also pushing market growth.
Challenges in the Aluminum Ingots Market Sector
The Aluminum Ingots market faces challenges including fluctuating raw material prices, which directly impact production costs. Supply chain disruptions can also create instability, impacting production and delivery timelines. Furthermore, intense competition from other materials and the need to comply with stringent environmental regulations pose ongoing challenges. These factors can negatively affect profit margins and market growth.
Emerging Opportunities in Aluminum Ingots Market
Emerging opportunities lie in the development of high-performance alloys for specialized applications, leveraging advancements in materials science. The growth of electric vehicles and renewable energy infrastructure creates significant demand for lightweight and high-conductivity aluminum. Furthermore, the increasing focus on sustainability offers opportunities for companies to promote recycled aluminum and low-carbon production methods.
Leading Players in the Aluminum Ingots Market
- SPIC Inc
- JBMI
- Dubai Aluminium Company
- Xinfa Group Co Ltd
- Norsk Hydro ASA
- Aluminum Corporation of China Limited (Chalco)
- BHP Billiton
- United Company
- Rio Tinto Group
- CHINA ZHONGWANG HOLDINGS LIMITED
- RUSAL Plc
- Alcoa Inc
- Hindalco Industries Ltd
- Aluminium Bahrain
Key Developments in Aluminum Ingots Market Industry
July 2022: Alcoa Corporation announced plans to expand casting capabilities at its Deschambault smelter in Canada, increasing its capacity for standard ingots by the first quarter of 2023. This signifies a commitment to meeting growing market demand.
August 2022: Rio Tinto invested USD 29 Million in a new aluminum recycling facility at its Arvida plant. This move emphasizes its focus on sustainable aluminum solutions and caters to the growing demand for low-carbon aluminum.
Future Outlook for Aluminum Ingots Market
The Aluminum Ingots market is poised for continued growth, fueled by increasing demand from key industries, advancements in materials science, and the rising focus on sustainability. Strategic opportunities exist for companies to innovate, expand capacity, and capitalize on the demand for high-performance and environmentally friendly aluminum solutions. The market's future growth will largely depend on the continued expansion of the automotive, aerospace, and construction industries, as well as the implementation of favorable governmental policies and technological advancements.
Aluminum Ingots Market Segmentation
-
1. End-user Industry
- 1.1. Automotive
- 1.2. Aerospace
- 1.3. Building and Construction
- 1.4. Semiconductor
- 1.5. Electrical and Electronics
- 1.6. Other End-user Industries
Aluminum Ingots Market Segmentation By Geography
-
1. Asia Pacific
- 1.1. China
- 1.2. India
- 1.3. Japan
- 1.4. South Korea
- 1.5. Rest of Asia Pacific
-
2. North America
- 2.1. United States
- 2.2. Canada
- 2.3. Mexico
-
3. Europe
- 3.1. Germany
- 3.2. United Kingdom
- 3.3. Italy
- 3.4. France
- 3.5. Rest of Europe
-
4. South America
- 4.1. Brazil
- 4.2. Argentina
- 4.3. Rest of South America
-
5. Middle East and Africa
- 5.1. Saudi Arabia
- 5.2. South Africa
- 5.3. Rest of Middle East and Africa
Aluminum Ingots Market REPORT HIGHLIGHTS
| Aspects | Details |
|---|---|
| Study Period | 2019-2033 |
| Base Year | 2024 |
| Estimated Year | 2025 |
| Forecast Period | 2025-2033 |
| Historical Period | 2019-2024 |
| Growth Rate | CAGR of > 6.50% from 2019-2033 |
| Segmentation |
|
Table of Contents
- 1. Introduction
- 1.1. Research Scope
- 1.2. Market Segmentation
- 1.3. Research Methodology
- 1.4. Definitions and Assumptions
- 2. Executive Summary
- 2.1. Introduction
- 3. Market Dynamics
- 3.1. Introduction
- 3.2. Market Drivers
- 3.2.1. Surging Construction Activities in Developing Countries; Rising Application of Aluminum Ingots in the Automotive Industry
- 3.3. Market Restrains
- 3.3.1. Fluctuating Prices of Raw Materials; Other Market Restraints
- 3.4. Market Trends
- 3.4.1. Significant Growth in Building and Construction Segment
- 4. Market Factor Analysis
- 4.1. Porters Five Forces
- 4.2. Supply/Value Chain
- 4.3. PESTEL analysis
- 4.4. Market Entropy
- 4.5. Patent/Trademark Analysis
- 5. Global Aluminum Ingots Market Analysis, Insights and Forecast, 2019-2031
- 5.1. Market Analysis, Insights and Forecast - by End-user Industry
- 5.1.1. Automotive
- 5.1.2. Aerospace
- 5.1.3. Building and Construction
- 5.1.4. Semiconductor
- 5.1.5. Electrical and Electronics
- 5.1.6. Other End-user Industries
- 5.2. Market Analysis, Insights and Forecast - by Region
- 5.2.1. Asia Pacific
- 5.2.2. North America
- 5.2.3. Europe
- 5.2.4. South America
- 5.2.5. Middle East and Africa
- 5.1. Market Analysis, Insights and Forecast - by End-user Industry
- 6. Asia Pacific Aluminum Ingots Market Analysis, Insights and Forecast, 2019-2031
- 6.1. Market Analysis, Insights and Forecast - by End-user Industry
- 6.1.1. Automotive
- 6.1.2. Aerospace
- 6.1.3. Building and Construction
- 6.1.4. Semiconductor
- 6.1.5. Electrical and Electronics
- 6.1.6. Other End-user Industries
- 6.1. Market Analysis, Insights and Forecast - by End-user Industry
- 7. North America Aluminum Ingots Market Analysis, Insights and Forecast, 2019-2031
- 7.1. Market Analysis, Insights and Forecast - by End-user Industry
- 7.1.1. Automotive
- 7.1.2. Aerospace
- 7.1.3. Building and Construction
- 7.1.4. Semiconductor
- 7.1.5. Electrical and Electronics
- 7.1.6. Other End-user Industries
- 7.1. Market Analysis, Insights and Forecast - by End-user Industry
- 8. Europe Aluminum Ingots Market Analysis, Insights and Forecast, 2019-2031
- 8.1. Market Analysis, Insights and Forecast - by End-user Industry
- 8.1.1. Automotive
- 8.1.2. Aerospace
- 8.1.3. Building and Construction
- 8.1.4. Semiconductor
- 8.1.5. Electrical and Electronics
- 8.1.6. Other End-user Industries
- 8.1. Market Analysis, Insights and Forecast - by End-user Industry
- 9. South America Aluminum Ingots Market Analysis, Insights and Forecast, 2019-2031
- 9.1. Market Analysis, Insights and Forecast - by End-user Industry
- 9.1.1. Automotive
- 9.1.2. Aerospace
- 9.1.3. Building and Construction
- 9.1.4. Semiconductor
- 9.1.5. Electrical and Electronics
- 9.1.6. Other End-user Industries
- 9.1. Market Analysis, Insights and Forecast - by End-user Industry
- 10. Middle East and Africa Aluminum Ingots Market Analysis, Insights and Forecast, 2019-2031
- 10.1. Market Analysis, Insights and Forecast - by End-user Industry
- 10.1.1. Automotive
- 10.1.2. Aerospace
- 10.1.3. Building and Construction
- 10.1.4. Semiconductor
- 10.1.5. Electrical and Electronics
- 10.1.6. Other End-user Industries
- 10.1. Market Analysis, Insights and Forecast - by End-user Industry
- 11. North America Aluminum Ingots Market Analysis, Insights and Forecast, 2019-2031
- 11.1. Market Analysis, Insights and Forecast - By Country/Sub-region
- 11.1.1 United States
- 11.1.2 Canada
- 11.1.3 Mexico
- 12. Europe Aluminum Ingots Market Analysis, Insights and Forecast, 2019-2031
- 12.1. Market Analysis, Insights and Forecast - By Country/Sub-region
- 12.1.1 Germany
- 12.1.2 France
- 12.1.3 Italy
- 12.1.4 United Kingdom
- 12.1.5 Netherlands
- 12.1.6 Rest of Europe
- 13. Asia Pacific Aluminum Ingots Market Analysis, Insights and Forecast, 2019-2031
- 13.1. Market Analysis, Insights and Forecast - By Country/Sub-region
- 13.1.1 China
- 13.1.2 Japan
- 13.1.3 India
- 13.1.4 South Korea
- 13.1.5 Taiwan
- 13.1.6 Australia
- 13.1.7 Rest of Asia-Pacific
- 14. South America Aluminum Ingots Market Analysis, Insights and Forecast, 2019-2031
- 14.1. Market Analysis, Insights and Forecast - By Country/Sub-region
- 14.1.1 Brazil
- 14.1.2 Argentina
- 14.1.3 Rest of South America
- 15. MEA Aluminum Ingots Market Analysis, Insights and Forecast, 2019-2031
- 15.1. Market Analysis, Insights and Forecast - By Country/Sub-region
- 15.1.1 Middle East
- 15.1.2 Africa
- 16. Competitive Analysis
- 16.1. Global Market Share Analysis 2024
- 16.2. Company Profiles
- 16.2.1 SPIC Inc
- 16.2.1.1. Overview
- 16.2.1.2. Products
- 16.2.1.3. SWOT Analysis
- 16.2.1.4. Recent Developments
- 16.2.1.5. Financials (Based on Availability)
- 16.2.2 JBMI
- 16.2.2.1. Overview
- 16.2.2.2. Products
- 16.2.2.3. SWOT Analysis
- 16.2.2.4. Recent Developments
- 16.2.2.5. Financials (Based on Availability)
- 16.2.3 Dubai Aluminium Company
- 16.2.3.1. Overview
- 16.2.3.2. Products
- 16.2.3.3. SWOT Analysis
- 16.2.3.4. Recent Developments
- 16.2.3.5. Financials (Based on Availability)
- 16.2.4 Xinfa Group Co Ltd
- 16.2.4.1. Overview
- 16.2.4.2. Products
- 16.2.4.3. SWOT Analysis
- 16.2.4.4. Recent Developments
- 16.2.4.5. Financials (Based on Availability)
- 16.2.5 Norsk Hydro ASA
- 16.2.5.1. Overview
- 16.2.5.2. Products
- 16.2.5.3. SWOT Analysis
- 16.2.5.4. Recent Developments
- 16.2.5.5. Financials (Based on Availability)
- 16.2.6 Aluminum Corporation of China Limited (Chalco)
- 16.2.6.1. Overview
- 16.2.6.2. Products
- 16.2.6.3. SWOT Analysis
- 16.2.6.4. Recent Developments
- 16.2.6.5. Financials (Based on Availability)
- 16.2.7 BHP Billiton
- 16.2.7.1. Overview
- 16.2.7.2. Products
- 16.2.7.3. SWOT Analysis
- 16.2.7.4. Recent Developments
- 16.2.7.5. Financials (Based on Availability)
- 16.2.8 United Company
- 16.2.8.1. Overview
- 16.2.8.2. Products
- 16.2.8.3. SWOT Analysis
- 16.2.8.4. Recent Developments
- 16.2.8.5. Financials (Based on Availability)
- 16.2.9 Rio Tinto Group
- 16.2.9.1. Overview
- 16.2.9.2. Products
- 16.2.9.3. SWOT Analysis
- 16.2.9.4. Recent Developments
- 16.2.9.5. Financials (Based on Availability)
- 16.2.10 CHINA ZHONGWANG HOLDINGS LIMITED
- 16.2.10.1. Overview
- 16.2.10.2. Products
- 16.2.10.3. SWOT Analysis
- 16.2.10.4. Recent Developments
- 16.2.10.5. Financials (Based on Availability)
- 16.2.11 RUSAL Plc
- 16.2.11.1. Overview
- 16.2.11.2. Products
- 16.2.11.3. SWOT Analysis
- 16.2.11.4. Recent Developments
- 16.2.11.5. Financials (Based on Availability)
- 16.2.12 Alcoa Inc
- 16.2.12.1. Overview
- 16.2.12.2. Products
- 16.2.12.3. SWOT Analysis
- 16.2.12.4. Recent Developments
- 16.2.12.5. Financials (Based on Availability)
- 16.2.13 Hindalco Industries Ltd
- 16.2.13.1. Overview
- 16.2.13.2. Products
- 16.2.13.3. SWOT Analysis
- 16.2.13.4. Recent Developments
- 16.2.13.5. Financials (Based on Availability)
- 16.2.14 Aluminium Bahrain
- 16.2.14.1. Overview
- 16.2.14.2. Products
- 16.2.14.3. SWOT Analysis
- 16.2.14.4. Recent Developments
- 16.2.14.5. Financials (Based on Availability)
- 16.2.1 SPIC Inc
List of Figures
- Figure 1: Global Aluminum Ingots Market Revenue Breakdown (Million, %) by Region 2024 & 2032
- Figure 2: Global Aluminum Ingots Market Volume Breakdown (K Tons, %) by Region 2024 & 2032
- Figure 3: North America Aluminum Ingots Market Revenue (Million), by Country 2024 & 2032
- Figure 4: North America Aluminum Ingots Market Volume (K Tons), by Country 2024 & 2032
- Figure 5: North America Aluminum Ingots Market Revenue Share (%), by Country 2024 & 2032
- Figure 6: North America Aluminum Ingots Market Volume Share (%), by Country 2024 & 2032
- Figure 7: Europe Aluminum Ingots Market Revenue (Million), by Country 2024 & 2032
- Figure 8: Europe Aluminum Ingots Market Volume (K Tons), by Country 2024 & 2032
- Figure 9: Europe Aluminum Ingots Market Revenue Share (%), by Country 2024 & 2032
- Figure 10: Europe Aluminum Ingots Market Volume Share (%), by Country 2024 & 2032
- Figure 11: Asia Pacific Aluminum Ingots Market Revenue (Million), by Country 2024 & 2032
- Figure 12: Asia Pacific Aluminum Ingots Market Volume (K Tons), by Country 2024 & 2032
- Figure 13: Asia Pacific Aluminum Ingots Market Revenue Share (%), by Country 2024 & 2032
- Figure 14: Asia Pacific Aluminum Ingots Market Volume Share (%), by Country 2024 & 2032
- Figure 15: South America Aluminum Ingots Market Revenue (Million), by Country 2024 & 2032
- Figure 16: South America Aluminum Ingots Market Volume (K Tons), by Country 2024 & 2032
- Figure 17: South America Aluminum Ingots Market Revenue Share (%), by Country 2024 & 2032
- Figure 18: South America Aluminum Ingots Market Volume Share (%), by Country 2024 & 2032
- Figure 19: MEA Aluminum Ingots Market Revenue (Million), by Country 2024 & 2032
- Figure 20: MEA Aluminum Ingots Market Volume (K Tons), by Country 2024 & 2032
- Figure 21: MEA Aluminum Ingots Market Revenue Share (%), by Country 2024 & 2032
- Figure 22: MEA Aluminum Ingots Market Volume Share (%), by Country 2024 & 2032
- Figure 23: Asia Pacific Aluminum Ingots Market Revenue (Million), by End-user Industry 2024 & 2032
- Figure 24: Asia Pacific Aluminum Ingots Market Volume (K Tons), by End-user Industry 2024 & 2032
- Figure 25: Asia Pacific Aluminum Ingots Market Revenue Share (%), by End-user Industry 2024 & 2032
- Figure 26: Asia Pacific Aluminum Ingots Market Volume Share (%), by End-user Industry 2024 & 2032
- Figure 27: Asia Pacific Aluminum Ingots Market Revenue (Million), by Country 2024 & 2032
- Figure 28: Asia Pacific Aluminum Ingots Market Volume (K Tons), by Country 2024 & 2032
- Figure 29: Asia Pacific Aluminum Ingots Market Revenue Share (%), by Country 2024 & 2032
- Figure 30: Asia Pacific Aluminum Ingots Market Volume Share (%), by Country 2024 & 2032
- Figure 31: North America Aluminum Ingots Market Revenue (Million), by End-user Industry 2024 & 2032
- Figure 32: North America Aluminum Ingots Market Volume (K Tons), by End-user Industry 2024 & 2032
- Figure 33: North America Aluminum Ingots Market Revenue Share (%), by End-user Industry 2024 & 2032
- Figure 34: North America Aluminum Ingots Market Volume Share (%), by End-user Industry 2024 & 2032
- Figure 35: North America Aluminum Ingots Market Revenue (Million), by Country 2024 & 2032
- Figure 36: North America Aluminum Ingots Market Volume (K Tons), by Country 2024 & 2032
- Figure 37: North America Aluminum Ingots Market Revenue Share (%), by Country 2024 & 2032
- Figure 38: North America Aluminum Ingots Market Volume Share (%), by Country 2024 & 2032
- Figure 39: Europe Aluminum Ingots Market Revenue (Million), by End-user Industry 2024 & 2032
- Figure 40: Europe Aluminum Ingots Market Volume (K Tons), by End-user Industry 2024 & 2032
- Figure 41: Europe Aluminum Ingots Market Revenue Share (%), by End-user Industry 2024 & 2032
- Figure 42: Europe Aluminum Ingots Market Volume Share (%), by End-user Industry 2024 & 2032
- Figure 43: Europe Aluminum Ingots Market Revenue (Million), by Country 2024 & 2032
- Figure 44: Europe Aluminum Ingots Market Volume (K Tons), by Country 2024 & 2032
- Figure 45: Europe Aluminum Ingots Market Revenue Share (%), by Country 2024 & 2032
- Figure 46: Europe Aluminum Ingots Market Volume Share (%), by Country 2024 & 2032
- Figure 47: South America Aluminum Ingots Market Revenue (Million), by End-user Industry 2024 & 2032
- Figure 48: South America Aluminum Ingots Market Volume (K Tons), by End-user Industry 2024 & 2032
- Figure 49: South America Aluminum Ingots Market Revenue Share (%), by End-user Industry 2024 & 2032
- Figure 50: South America Aluminum Ingots Market Volume Share (%), by End-user Industry 2024 & 2032
- Figure 51: South America Aluminum Ingots Market Revenue (Million), by Country 2024 & 2032
- Figure 52: South America Aluminum Ingots Market Volume (K Tons), by Country 2024 & 2032
- Figure 53: South America Aluminum Ingots Market Revenue Share (%), by Country 2024 & 2032
- Figure 54: South America Aluminum Ingots Market Volume Share (%), by Country 2024 & 2032
- Figure 55: Middle East and Africa Aluminum Ingots Market Revenue (Million), by End-user Industry 2024 & 2032
- Figure 56: Middle East and Africa Aluminum Ingots Market Volume (K Tons), by End-user Industry 2024 & 2032
- Figure 57: Middle East and Africa Aluminum Ingots Market Revenue Share (%), by End-user Industry 2024 & 2032
- Figure 58: Middle East and Africa Aluminum Ingots Market Volume Share (%), by End-user Industry 2024 & 2032
- Figure 59: Middle East and Africa Aluminum Ingots Market Revenue (Million), by Country 2024 & 2032
- Figure 60: Middle East and Africa Aluminum Ingots Market Volume (K Tons), by Country 2024 & 2032
- Figure 61: Middle East and Africa Aluminum Ingots Market Revenue Share (%), by Country 2024 & 2032
- Figure 62: Middle East and Africa Aluminum Ingots Market Volume Share (%), by Country 2024 & 2032
List of Tables
- Table 1: Global Aluminum Ingots Market Revenue Million Forecast, by Region 2019 & 2032
- Table 2: Global Aluminum Ingots Market Volume K Tons Forecast, by Region 2019 & 2032
- Table 3: Global Aluminum Ingots Market Revenue Million Forecast, by End-user Industry 2019 & 2032
- Table 4: Global Aluminum Ingots Market Volume K Tons Forecast, by End-user Industry 2019 & 2032
- Table 5: Global Aluminum Ingots Market Revenue Million Forecast, by Region 2019 & 2032
- Table 6: Global Aluminum Ingots Market Volume K Tons Forecast, by Region 2019 & 2032
- Table 7: Global Aluminum Ingots Market Revenue Million Forecast, by Country 2019 & 2032
- Table 8: Global Aluminum Ingots Market Volume K Tons Forecast, by Country 2019 & 2032
- Table 9: United States Aluminum Ingots Market Revenue (Million) Forecast, by Application 2019 & 2032
- Table 10: United States Aluminum Ingots Market Volume (K Tons) Forecast, by Application 2019 & 2032
- Table 11: Canada Aluminum Ingots Market Revenue (Million) Forecast, by Application 2019 & 2032
- Table 12: Canada Aluminum Ingots Market Volume (K Tons) Forecast, by Application 2019 & 2032
- Table 13: Mexico Aluminum Ingots Market Revenue (Million) Forecast, by Application 2019 & 2032
- Table 14: Mexico Aluminum Ingots Market Volume (K Tons) Forecast, by Application 2019 & 2032
- Table 15: Global Aluminum Ingots Market Revenue Million Forecast, by Country 2019 & 2032
- Table 16: Global Aluminum Ingots Market Volume K Tons Forecast, by Country 2019 & 2032
- Table 17: Germany Aluminum Ingots Market Revenue (Million) Forecast, by Application 2019 & 2032
- Table 18: Germany Aluminum Ingots Market Volume (K Tons) Forecast, by Application 2019 & 2032
- Table 19: France Aluminum Ingots Market Revenue (Million) Forecast, by Application 2019 & 2032
- Table 20: France Aluminum Ingots Market Volume (K Tons) Forecast, by Application 2019 & 2032
- Table 21: Italy Aluminum Ingots Market Revenue (Million) Forecast, by Application 2019 & 2032
- Table 22: Italy Aluminum Ingots Market Volume (K Tons) Forecast, by Application 2019 & 2032
- Table 23: United Kingdom Aluminum Ingots Market Revenue (Million) Forecast, by Application 2019 & 2032
- Table 24: United Kingdom Aluminum Ingots Market Volume (K Tons) Forecast, by Application 2019 & 2032
- Table 25: Netherlands Aluminum Ingots Market Revenue (Million) Forecast, by Application 2019 & 2032
- Table 26: Netherlands Aluminum Ingots Market Volume (K Tons) Forecast, by Application 2019 & 2032
- Table 27: Rest of Europe Aluminum Ingots Market Revenue (Million) Forecast, by Application 2019 & 2032
- Table 28: Rest of Europe Aluminum Ingots Market Volume (K Tons) Forecast, by Application 2019 & 2032
- Table 29: Global Aluminum Ingots Market Revenue Million Forecast, by Country 2019 & 2032
- Table 30: Global Aluminum Ingots Market Volume K Tons Forecast, by Country 2019 & 2032
- Table 31: China Aluminum Ingots Market Revenue (Million) Forecast, by Application 2019 & 2032
- Table 32: China Aluminum Ingots Market Volume (K Tons) Forecast, by Application 2019 & 2032
- Table 33: Japan Aluminum Ingots Market Revenue (Million) Forecast, by Application 2019 & 2032
- Table 34: Japan Aluminum Ingots Market Volume (K Tons) Forecast, by Application 2019 & 2032
- Table 35: India Aluminum Ingots Market Revenue (Million) Forecast, by Application 2019 & 2032
- Table 36: India Aluminum Ingots Market Volume (K Tons) Forecast, by Application 2019 & 2032
- Table 37: South Korea Aluminum Ingots Market Revenue (Million) Forecast, by Application 2019 & 2032
- Table 38: South Korea Aluminum Ingots Market Volume (K Tons) Forecast, by Application 2019 & 2032
- Table 39: Taiwan Aluminum Ingots Market Revenue (Million) Forecast, by Application 2019 & 2032
- Table 40: Taiwan Aluminum Ingots Market Volume (K Tons) Forecast, by Application 2019 & 2032
- Table 41: Australia Aluminum Ingots Market Revenue (Million) Forecast, by Application 2019 & 2032
- Table 42: Australia Aluminum Ingots Market Volume (K Tons) Forecast, by Application 2019 & 2032
- Table 43: Rest of Asia-Pacific Aluminum Ingots Market Revenue (Million) Forecast, by Application 2019 & 2032
- Table 44: Rest of Asia-Pacific Aluminum Ingots Market Volume (K Tons) Forecast, by Application 2019 & 2032
- Table 45: Global Aluminum Ingots Market Revenue Million Forecast, by Country 2019 & 2032
- Table 46: Global Aluminum Ingots Market Volume K Tons Forecast, by Country 2019 & 2032
- Table 47: Brazil Aluminum Ingots Market Revenue (Million) Forecast, by Application 2019 & 2032
- Table 48: Brazil Aluminum Ingots Market Volume (K Tons) Forecast, by Application 2019 & 2032
- Table 49: Argentina Aluminum Ingots Market Revenue (Million) Forecast, by Application 2019 & 2032
- Table 50: Argentina Aluminum Ingots Market Volume (K Tons) Forecast, by Application 2019 & 2032
- Table 51: Rest of South America Aluminum Ingots Market Revenue (Million) Forecast, by Application 2019 & 2032
- Table 52: Rest of South America Aluminum Ingots Market Volume (K Tons) Forecast, by Application 2019 & 2032
- Table 53: Global Aluminum Ingots Market Revenue Million Forecast, by Country 2019 & 2032
- Table 54: Global Aluminum Ingots Market Volume K Tons Forecast, by Country 2019 & 2032
- Table 55: Middle East Aluminum Ingots Market Revenue (Million) Forecast, by Application 2019 & 2032
- Table 56: Middle East Aluminum Ingots Market Volume (K Tons) Forecast, by Application 2019 & 2032
- Table 57: Africa Aluminum Ingots Market Revenue (Million) Forecast, by Application 2019 & 2032
- Table 58: Africa Aluminum Ingots Market Volume (K Tons) Forecast, by Application 2019 & 2032
- Table 59: Global Aluminum Ingots Market Revenue Million Forecast, by End-user Industry 2019 & 2032
- Table 60: Global Aluminum Ingots Market Volume K Tons Forecast, by End-user Industry 2019 & 2032
- Table 61: Global Aluminum Ingots Market Revenue Million Forecast, by Country 2019 & 2032
- Table 62: Global Aluminum Ingots Market Volume K Tons Forecast, by Country 2019 & 2032
- Table 63: China Aluminum Ingots Market Revenue (Million) Forecast, by Application 2019 & 2032
- Table 64: China Aluminum Ingots Market Volume (K Tons) Forecast, by Application 2019 & 2032
- Table 65: India Aluminum Ingots Market Revenue (Million) Forecast, by Application 2019 & 2032
- Table 66: India Aluminum Ingots Market Volume (K Tons) Forecast, by Application 2019 & 2032
- Table 67: Japan Aluminum Ingots Market Revenue (Million) Forecast, by Application 2019 & 2032
- Table 68: Japan Aluminum Ingots Market Volume (K Tons) Forecast, by Application 2019 & 2032
- Table 69: South Korea Aluminum Ingots Market Revenue (Million) Forecast, by Application 2019 & 2032
- Table 70: South Korea Aluminum Ingots Market Volume (K Tons) Forecast, by Application 2019 & 2032
- Table 71: Rest of Asia Pacific Aluminum Ingots Market Revenue (Million) Forecast, by Application 2019 & 2032
- Table 72: Rest of Asia Pacific Aluminum Ingots Market Volume (K Tons) Forecast, by Application 2019 & 2032
- Table 73: Global Aluminum Ingots Market Revenue Million Forecast, by End-user Industry 2019 & 2032
- Table 74: Global Aluminum Ingots Market Volume K Tons Forecast, by End-user Industry 2019 & 2032
- Table 75: Global Aluminum Ingots Market Revenue Million Forecast, by Country 2019 & 2032
- Table 76: Global Aluminum Ingots Market Volume K Tons Forecast, by Country 2019 & 2032
- Table 77: United States Aluminum Ingots Market Revenue (Million) Forecast, by Application 2019 & 2032
- Table 78: United States Aluminum Ingots Market Volume (K Tons) Forecast, by Application 2019 & 2032
- Table 79: Canada Aluminum Ingots Market Revenue (Million) Forecast, by Application 2019 & 2032
- Table 80: Canada Aluminum Ingots Market Volume (K Tons) Forecast, by Application 2019 & 2032
- Table 81: Mexico Aluminum Ingots Market Revenue (Million) Forecast, by Application 2019 & 2032
- Table 82: Mexico Aluminum Ingots Market Volume (K Tons) Forecast, by Application 2019 & 2032
- Table 83: Global Aluminum Ingots Market Revenue Million Forecast, by End-user Industry 2019 & 2032
- Table 84: Global Aluminum Ingots Market Volume K Tons Forecast, by End-user Industry 2019 & 2032
- Table 85: Global Aluminum Ingots Market Revenue Million Forecast, by Country 2019 & 2032
- Table 86: Global Aluminum Ingots Market Volume K Tons Forecast, by Country 2019 & 2032
- Table 87: Germany Aluminum Ingots Market Revenue (Million) Forecast, by Application 2019 & 2032
- Table 88: Germany Aluminum Ingots Market Volume (K Tons) Forecast, by Application 2019 & 2032
- Table 89: United Kingdom Aluminum Ingots Market Revenue (Million) Forecast, by Application 2019 & 2032
- Table 90: United Kingdom Aluminum Ingots Market Volume (K Tons) Forecast, by Application 2019 & 2032
- Table 91: Italy Aluminum Ingots Market Revenue (Million) Forecast, by Application 2019 & 2032
- Table 92: Italy Aluminum Ingots Market Volume (K Tons) Forecast, by Application 2019 & 2032
- Table 93: France Aluminum Ingots Market Revenue (Million) Forecast, by Application 2019 & 2032
- Table 94: France Aluminum Ingots Market Volume (K Tons) Forecast, by Application 2019 & 2032
- Table 95: Rest of Europe Aluminum Ingots Market Revenue (Million) Forecast, by Application 2019 & 2032
- Table 96: Rest of Europe Aluminum Ingots Market Volume (K Tons) Forecast, by Application 2019 & 2032
- Table 97: Global Aluminum Ingots Market Revenue Million Forecast, by End-user Industry 2019 & 2032
- Table 98: Global Aluminum Ingots Market Volume K Tons Forecast, by End-user Industry 2019 & 2032
- Table 99: Global Aluminum Ingots Market Revenue Million Forecast, by Country 2019 & 2032
- Table 100: Global Aluminum Ingots Market Volume K Tons Forecast, by Country 2019 & 2032
- Table 101: Brazil Aluminum Ingots Market Revenue (Million) Forecast, by Application 2019 & 2032
- Table 102: Brazil Aluminum Ingots Market Volume (K Tons) Forecast, by Application 2019 & 2032
- Table 103: Argentina Aluminum Ingots Market Revenue (Million) Forecast, by Application 2019 & 2032
- Table 104: Argentina Aluminum Ingots Market Volume (K Tons) Forecast, by Application 2019 & 2032
- Table 105: Rest of South America Aluminum Ingots Market Revenue (Million) Forecast, by Application 2019 & 2032
- Table 106: Rest of South America Aluminum Ingots Market Volume (K Tons) Forecast, by Application 2019 & 2032
- Table 107: Global Aluminum Ingots Market Revenue Million Forecast, by End-user Industry 2019 & 2032
- Table 108: Global Aluminum Ingots Market Volume K Tons Forecast, by End-user Industry 2019 & 2032
- Table 109: Global Aluminum Ingots Market Revenue Million Forecast, by Country 2019 & 2032
- Table 110: Global Aluminum Ingots Market Volume K Tons Forecast, by Country 2019 & 2032
- Table 111: Saudi Arabia Aluminum Ingots Market Revenue (Million) Forecast, by Application 2019 & 2032
- Table 112: Saudi Arabia Aluminum Ingots Market Volume (K Tons) Forecast, by Application 2019 & 2032
- Table 113: South Africa Aluminum Ingots Market Revenue (Million) Forecast, by Application 2019 & 2032
- Table 114: South Africa Aluminum Ingots Market Volume (K Tons) Forecast, by Application 2019 & 2032
- Table 115: Rest of Middle East and Africa Aluminum Ingots Market Revenue (Million) Forecast, by Application 2019 & 2032
- Table 116: Rest of Middle East and Africa Aluminum Ingots Market Volume (K Tons) Forecast, by Application 2019 & 2032
Frequently Asked Questions
1. What is the projected Compound Annual Growth Rate (CAGR) of the Aluminum Ingots Market?
The projected CAGR is approximately > 6.50%.
2. Which companies are prominent players in the Aluminum Ingots Market?
Key companies in the market include SPIC Inc, JBMI, Dubai Aluminium Company, Xinfa Group Co Ltd , Norsk Hydro ASA, Aluminum Corporation of China Limited (Chalco), BHP Billiton, United Company, Rio Tinto Group, CHINA ZHONGWANG HOLDINGS LIMITED, RUSAL Plc, Alcoa Inc, Hindalco Industries Ltd, Aluminium Bahrain.
3. What are the main segments of the Aluminum Ingots Market?
The market segments include End-user Industry.
4. Can you provide details about the market size?
The market size is estimated to be USD XX Million as of 2022.
5. What are some drivers contributing to market growth?
Surging Construction Activities in Developing Countries; Rising Application of Aluminum Ingots in the Automotive Industry.
6. What are the notable trends driving market growth?
Significant Growth in Building and Construction Segment.
7. Are there any restraints impacting market growth?
Fluctuating Prices of Raw Materials; Other Market Restraints.
8. Can you provide examples of recent developments in the market?
July 2022: Alcoa Corporation announced that it would soon start the project construction to increase the casting capabilities at its Deschambault smelter in Canada to include standard ingots. The new casting equipment will be constructed in an existing building, with the project fully completed in the first quarter of 2023.
9. What pricing options are available for accessing the report?
Pricing options include single-user, multi-user, and enterprise licenses priced at USD 4750, USD 5250, and USD 8750 respectively.
10. Is the market size provided in terms of value or volume?
The market size is provided in terms of value, measured in Million and volume, measured in K Tons.
11. Are there any specific market keywords associated with the report?
Yes, the market keyword associated with the report is "Aluminum Ingots Market," which aids in identifying and referencing the specific market segment covered.
12. How do I determine which pricing option suits my needs best?
The pricing options vary based on user requirements and access needs. Individual users may opt for single-user licenses, while businesses requiring broader access may choose multi-user or enterprise licenses for cost-effective access to the report.
13. Are there any additional resources or data provided in the Aluminum Ingots Market report?
While the report offers comprehensive insights, it's advisable to review the specific contents or supplementary materials provided to ascertain if additional resources or data are available.
14. How can I stay updated on further developments or reports in the Aluminum Ingots Market?
To stay informed about further developments, trends, and reports in the Aluminum Ingots Market, consider subscribing to industry newsletters, following relevant companies and organizations, or regularly checking reputable industry news sources and publications.
Methodology
Step 1 - Identification of Relevant Samples Size from Population Database


Step 2 - Approaches for Defining Global Market Size (Value, Volume* & Price*)

Note*: In applicable scenarios
Step 3 - Data Sources
Primary Research
- Web Analytics
- Survey Reports
- Research Institute
- Latest Research Reports
- Opinion Leaders
Secondary Research
- Annual Reports
- White Paper
- Latest Press Release
- Industry Association
- Paid Database
- Investor Presentations

Step 4 - Data Triangulation
Involves using different sources of information in order to increase the validity of a study
These sources are likely to be stakeholders in a program - participants, other researchers, program staff, other community members, and so on.
Then we put all data in single framework & apply various statistical tools to find out the dynamic on the market.
During the analysis stage, feedback from the stakeholder groups would be compared to determine areas of agreement as well as areas of divergence


