
Key Insights
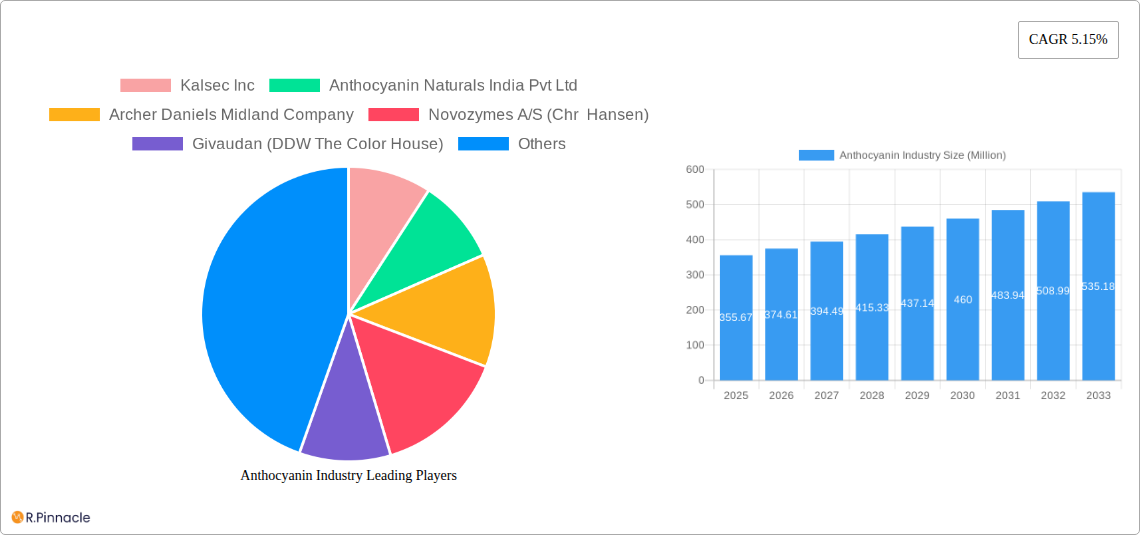
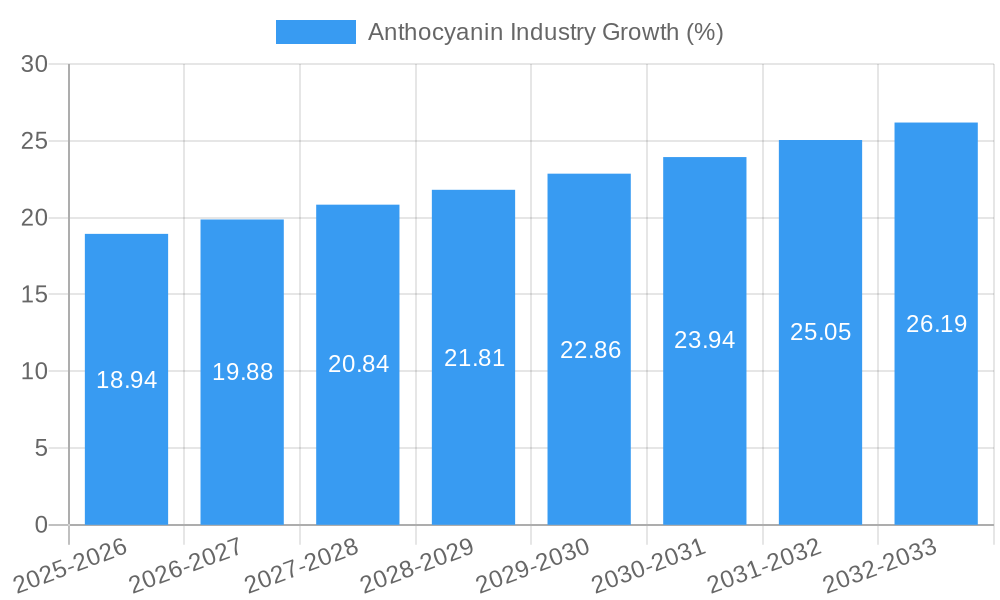
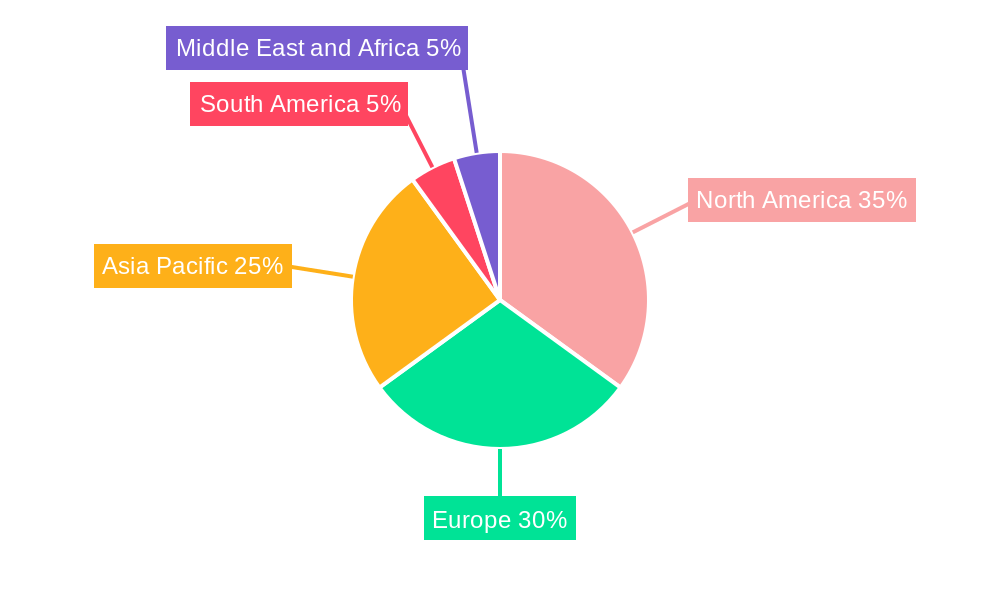
The global anthocyanin market, valued at $355.67 million in 2025, is projected to experience robust growth, driven by increasing consumer demand for natural food colorants and health-promoting ingredients. A compound annual growth rate (CAGR) of 5.15% from 2025 to 2033 indicates a significant expansion of the market over the forecast period. Key drivers include the rising preference for clean-label products in the food and beverage industry, coupled with the growing awareness of the health benefits associated with anthocyanins, such as antioxidant and anti-inflammatory properties. The pharmaceutical and personal care sectors also contribute significantly to market growth, utilizing anthocyanins in various formulations. Market segmentation reveals strong demand for cyanidin, malvidin, and delphinidin types, particularly within the food and beverage application. However, the market faces challenges from fluctuating raw material prices and the complexities of anthocyanin extraction and stabilization. The competitive landscape includes both established players like Kalsec Inc., Archer Daniels Midland Company, and Givaudan, and smaller, specialized companies, fostering innovation and driving product diversification. Geographic analysis suggests North America and Europe hold significant market shares, but the Asia-Pacific region demonstrates strong growth potential due to expanding consumer markets and increased adoption of natural food ingredients.
Continued growth in the anthocyanin market is anticipated due to ongoing research highlighting the potential health benefits of these pigments and the increasing investment in R&D for improved extraction and processing techniques. The market's expansion is further bolstered by increasing consumer demand for functional foods and beverages, as well as the growing preference for sustainable and naturally sourced ingredients. While challenges related to price volatility and standardization remain, the overall outlook for the anthocyanin market is positive, fueled by consistent innovation within the food and beverage industry, along with expanding applications in pharmaceuticals and personal care. The entrance of new players and collaborations between established industry leaders are also contributing to the dynamic and competitive market landscape. Regional variations in consumer preferences and regulatory frameworks will continue to shape market growth across different geographical areas.
Anthocyanin Industry Market Report: 2019-2033
This comprehensive report provides a detailed analysis of the global anthocyanin industry, offering invaluable insights for industry professionals, investors, and stakeholders. Covering the period 2019-2033, with a focus on 2025, this report projects a dynamic market poised for significant growth. The report leverages extensive market research and data analysis to present a clear and actionable understanding of market trends, competitive dynamics, and future opportunities. Expect detailed breakdowns by type (Cyanidin, Malvidin, Delphinidin, Peonidin, Other Types), application (Food & Beverage, Pharmaceutical, Personal Care, Animal Feed), and leading geographic regions. The report also highlights key players and their strategic moves, empowering you to make informed business decisions. The total market value is projected to reach xx Million by 2033.
Anthocyanin Industry Market Structure & Innovation Trends
The anthocyanin market exhibits a moderately consolidated structure, with key players such as Kalsec Inc, Anthocyanin Naturals India Pvt Ltd, Archer Daniels Midland Company, Novozymes A/S (Chr Hansen), Givaudan (DDW The Color House), GNT Group B.V., Synthite Industries Ltd, Symrise AG, Sensient Technologies Corporation, and Döhler Group SE holding significant market share. However, the presence of several smaller players indicates a competitive landscape. Market share data for 2024 shows Kalsec Inc holding approximately xx% market share, while GNT Group B.V. holds approximately xx%. The market is driven by innovation in extraction technologies, resulting in higher purity and yield of anthocyanins, and a focus on sustainable sourcing and production methods.
- Innovation Drivers: Demand for natural colors, health benefits associated with anthocyanins, and advancements in extraction and stabilization techniques.
- Regulatory Frameworks: Stringent regulations regarding food additives and labeling influence market dynamics.
- Product Substitutes: Synthetic colorants pose a competitive threat, although consumer preference for natural alternatives is increasing.
- End-User Demographics: Health-conscious consumers and the growing demand for natural and functional foods and beverages are key drivers.
- M&A Activities: The market has witnessed several mergers and acquisitions in recent years, with deal values ranging from USD 30 Million (GNT Group expansion) to xx Million in other transactions. These activities reflect the consolidation efforts within the industry.
Anthocyanin Industry Market Dynamics & Trends
The global anthocyanin market is experiencing robust growth, driven by several key factors. The compound annual growth rate (CAGR) during the forecast period (2025-2033) is projected at xx%. Increased consumer awareness regarding health and wellness fuels the demand for natural food colorants and functional food ingredients. Technological advancements in extraction, purification, and stabilization enhance the quality and availability of anthocyanins, driving market penetration. Market penetration within the Food & Beverage segment is particularly strong, exceeding xx%, while the Pharmaceutical and Personal Care sectors are showing promising growth, with penetration rates of approximately xx% and xx%, respectively. Competitive dynamics are intense, with companies focusing on product differentiation through innovation in both product formulation and sustainable sourcing. The shift towards clean-label products also supports this market's growth.
Dominant Regions & Segments in Anthocyanin Industry
Leading Region: North America currently holds the largest market share due to high consumer demand for natural products and a well-established food and beverage industry. Europe follows closely, with significant growth driven by similar factors. Asia-Pacific shows considerable growth potential driven by increasing disposable incomes and awareness of health and wellness.
Dominant Segments:
- Type: Cyanidin is currently the dominant type, representing roughly xx% of the market, due to its widespread availability and applications. However, other types, like Delphinidin and Malvidin are gaining traction.
- Application: Food & Beverage maintains the largest market share, accounting for about xx% of the total market value. This is largely due to the use of anthocyanins as natural colorants and antioxidants in a vast array of products. However, Pharmaceutical and Personal Care are emerging as significant segments with increased adoption of anthocyanins in health supplements and cosmetics.
Key Drivers by Region:
- North America: Strong regulatory support for natural ingredients, high consumer spending, and a developed food processing infrastructure.
- Europe: Growing demand for clean-label products, stringent regulations favoring natural colors, and a well-established market for functional foods.
- Asia-Pacific: Rising disposable incomes, increasing awareness of health benefits, and a burgeoning food and beverage industry.
Anthocyanin Industry Product Innovations
Recent product innovations focus on enhancing the stability and functionality of anthocyanins. Companies are developing novel extraction and encapsulation techniques to improve their color intensity, shelf life, and application in various products. For instance, Givaudan's launch of New Purple 2364 highlights the trend toward sustainable and vegan alternatives to synthetic pigments. This emphasis on natural sourcing and improved functionality positions anthocyanins as a compelling alternative to synthetic colorants.
Report Scope & Segmentation Analysis
This report provides a comprehensive segmentation analysis across multiple parameters:
Type: Cyanidin, Malvidin, Delphinidin, Peonidin, Other Types – Each segment's market size, growth projections, and competitive dynamics are detailed. Cyanidin exhibits the highest growth rate due to existing applications. Growth projections for other types are expected to be significantly driven by research and development efforts.
Application: Food & Beverage, Pharmaceutical, Personal Care, Animal Feed – Each application segment's market size, growth rate, and competitive intensity are analyzed. The Food & Beverage sector dominates, while Pharmaceutical and Personal Care are fast-growing. Animal feed applications are also gaining traction but represent a smaller market.
Key Drivers of Anthocyanin Industry Growth
The anthocyanin industry's growth is fueled by increasing demand for natural colors and functional food ingredients. The rising health consciousness of consumers drives the shift towards natural alternatives to synthetic pigments. Advances in extraction technologies improve the efficiency and cost-effectiveness of anthocyanin production, further enhancing market growth. Favorable regulatory frameworks in various regions supporting natural ingredients also contribute significantly.
Challenges in the Anthocyanin Industry Sector
Challenges include the inherent instability of anthocyanins, requiring sophisticated stabilization techniques. Fluctuations in raw material supply and prices impact profitability. Competition from synthetic colorants, particularly in price-sensitive markets, remains a concern. Strict regulations concerning food additives and labeling add complexity to market operations. These factors contribute to overall market volatility. The total estimated impact of these challenges results in an approximate xx Million loss annually for the industry.
Emerging Opportunities in Anthocyanin Industry
Growing interest in natural colorants within pharmaceutical and cosmetic applications opens significant opportunities. The development of novel delivery systems, like encapsulation, improves stability and expands application possibilities. Exploring new sources of anthocyanins and optimizing extraction processes present avenues for enhanced sustainability and reduced production costs. Expanding into emerging markets with a growing demand for natural ingredients presents significant potential for growth.
Leading Players in the Anthocyanin Industry Market
- Kalsec Inc
- Anthocyanin Naturals India Pvt Ltd
- Archer Daniels Midland Company
- Novozymes A/S (Chr Hansen)
- Givaudan (DDW The Color House)
- GNT Group B.V.
- Synthite Industries Ltd
- Symrise AG
- Sensient Technologies Corporation
- Döhler Group SE *List Not Exhaustive
Key Developments in Anthocyanin Industry
- September 2022: Givaudan Active Beauty launched New Purple 2364, a vegan, sustainable pigment for makeup, expanding its portfolio of sustainable alternatives.
- October 2021: GNT Group invested USD 30 Million to expand its North American operations, strengthening its position in the natural color market.
- April 2021: Chr. Hansen Natural Colors integrated SECNA Natural Ingredients Group S.L., furthering its growth and expanding its natural color portfolio.
Future Outlook for Anthocyanin Industry Market
The anthocyanin market is poised for continued growth, driven by the increasing demand for natural food colorants and functional ingredients. Innovation in extraction techniques and product formulation will further expand applications and market penetration. The shift towards sustainability and ethical sourcing will shape industry practices, creating opportunities for companies prioritizing these aspects. Continued research into the health benefits of anthocyanins will further support market expansion.
Anthocyanin Industry Segmentation
-
1. Type
- 1.1. Cyanidin
- 1.2. Malvidin
- 1.3. Delphinidin
- 1.4. Peonidin
- 1.5. Other Types
-
2. Application
-
2.1. Food & Beverage
- 2.1.1. Bakery & Confectionery
- 2.1.2. Dairy-based products
- 2.1.3. Beverages
- 2.1.4. Other Applications
- 2.2. Pharmaceutical
- 2.3. Personal Care
- 2.4. Animal Feed
-
2.1. Food & Beverage
Anthocyanin Industry Segmentation By Geography
-
1. North America
- 1.1. United States
- 1.2. Canada
- 1.3. Mexico
- 1.4. Rest of North America
-
2. Europe
- 2.1. Spain
- 2.2. United Kingdom
- 2.3. Germany
- 2.4. France
- 2.5. Italy
- 2.6. Russia
- 2.7. Rest of Europe
-
3. Asia Pacific
- 3.1. China
- 3.2. Japan
- 3.3. India
- 3.4. Australia
- 3.5. Rest of Asia Pacific
-
4. South America
- 4.1. Brazil
- 4.2. Argentina
- 4.3. Rest of South America
-
5. Middle East and Africa
- 5.1. South Africa
- 5.2. Saudi Arabia
- 5.3. Rest of Middle East and Africa
Anthocyanin Industry REPORT HIGHLIGHTS
| Aspects | Details |
|---|---|
| Study Period | 2019-2033 |
| Base Year | 2024 |
| Estimated Year | 2025 |
| Forecast Period | 2025-2033 |
| Historical Period | 2019-2024 |
| Growth Rate | CAGR of 5.15% from 2019-2033 |
| Segmentation |
|
Table of Contents
- 1. Introduction
- 1.1. Research Scope
- 1.2. Market Segmentation
- 1.3. Research Methodology
- 1.4. Definitions and Assumptions
- 2. Executive Summary
- 2.1. Introduction
- 3. Market Dynamics
- 3.1. Introduction
- 3.2. Market Drivers
- 3.2.1. Increasing Consumer Awareness Regarding Natural Products; Growing Demand for Anthocyanin in Pharmaceutical Industry
- 3.3. Market Restrains
- 3.3.1. Easy Availability of Synthetic Food Colorant
- 3.4. Market Trends
- 3.4.1. Increasing Consumer Awareness Regarding Natural Products
- 4. Market Factor Analysis
- 4.1. Porters Five Forces
- 4.2. Supply/Value Chain
- 4.3. PESTEL analysis
- 4.4. Market Entropy
- 4.5. Patent/Trademark Analysis
- 5. Global Anthocyanin Industry Analysis, Insights and Forecast, 2019-2031
- 5.1. Market Analysis, Insights and Forecast - by Type
- 5.1.1. Cyanidin
- 5.1.2. Malvidin
- 5.1.3. Delphinidin
- 5.1.4. Peonidin
- 5.1.5. Other Types
- 5.2. Market Analysis, Insights and Forecast - by Application
- 5.2.1. Food & Beverage
- 5.2.1.1. Bakery & Confectionery
- 5.2.1.2. Dairy-based products
- 5.2.1.3. Beverages
- 5.2.1.4. Other Applications
- 5.2.2. Pharmaceutical
- 5.2.3. Personal Care
- 5.2.4. Animal Feed
- 5.2.1. Food & Beverage
- 5.3. Market Analysis, Insights and Forecast - by Region
- 5.3.1. North America
- 5.3.2. Europe
- 5.3.3. Asia Pacific
- 5.3.4. South America
- 5.3.5. Middle East and Africa
- 5.1. Market Analysis, Insights and Forecast - by Type
- 6. North America Anthocyanin Industry Analysis, Insights and Forecast, 2019-2031
- 6.1. Market Analysis, Insights and Forecast - by Type
- 6.1.1. Cyanidin
- 6.1.2. Malvidin
- 6.1.3. Delphinidin
- 6.1.4. Peonidin
- 6.1.5. Other Types
- 6.2. Market Analysis, Insights and Forecast - by Application
- 6.2.1. Food & Beverage
- 6.2.1.1. Bakery & Confectionery
- 6.2.1.2. Dairy-based products
- 6.2.1.3. Beverages
- 6.2.1.4. Other Applications
- 6.2.2. Pharmaceutical
- 6.2.3. Personal Care
- 6.2.4. Animal Feed
- 6.2.1. Food & Beverage
- 6.1. Market Analysis, Insights and Forecast - by Type
- 7. Europe Anthocyanin Industry Analysis, Insights and Forecast, 2019-2031
- 7.1. Market Analysis, Insights and Forecast - by Type
- 7.1.1. Cyanidin
- 7.1.2. Malvidin
- 7.1.3. Delphinidin
- 7.1.4. Peonidin
- 7.1.5. Other Types
- 7.2. Market Analysis, Insights and Forecast - by Application
- 7.2.1. Food & Beverage
- 7.2.1.1. Bakery & Confectionery
- 7.2.1.2. Dairy-based products
- 7.2.1.3. Beverages
- 7.2.1.4. Other Applications
- 7.2.2. Pharmaceutical
- 7.2.3. Personal Care
- 7.2.4. Animal Feed
- 7.2.1. Food & Beverage
- 7.1. Market Analysis, Insights and Forecast - by Type
- 8. Asia Pacific Anthocyanin Industry Analysis, Insights and Forecast, 2019-2031
- 8.1. Market Analysis, Insights and Forecast - by Type
- 8.1.1. Cyanidin
- 8.1.2. Malvidin
- 8.1.3. Delphinidin
- 8.1.4. Peonidin
- 8.1.5. Other Types
- 8.2. Market Analysis, Insights and Forecast - by Application
- 8.2.1. Food & Beverage
- 8.2.1.1. Bakery & Confectionery
- 8.2.1.2. Dairy-based products
- 8.2.1.3. Beverages
- 8.2.1.4. Other Applications
- 8.2.2. Pharmaceutical
- 8.2.3. Personal Care
- 8.2.4. Animal Feed
- 8.2.1. Food & Beverage
- 8.1. Market Analysis, Insights and Forecast - by Type
- 9. South America Anthocyanin Industry Analysis, Insights and Forecast, 2019-2031
- 9.1. Market Analysis, Insights and Forecast - by Type
- 9.1.1. Cyanidin
- 9.1.2. Malvidin
- 9.1.3. Delphinidin
- 9.1.4. Peonidin
- 9.1.5. Other Types
- 9.2. Market Analysis, Insights and Forecast - by Application
- 9.2.1. Food & Beverage
- 9.2.1.1. Bakery & Confectionery
- 9.2.1.2. Dairy-based products
- 9.2.1.3. Beverages
- 9.2.1.4. Other Applications
- 9.2.2. Pharmaceutical
- 9.2.3. Personal Care
- 9.2.4. Animal Feed
- 9.2.1. Food & Beverage
- 9.1. Market Analysis, Insights and Forecast - by Type
- 10. Middle East and Africa Anthocyanin Industry Analysis, Insights and Forecast, 2019-2031
- 10.1. Market Analysis, Insights and Forecast - by Type
- 10.1.1. Cyanidin
- 10.1.2. Malvidin
- 10.1.3. Delphinidin
- 10.1.4. Peonidin
- 10.1.5. Other Types
- 10.2. Market Analysis, Insights and Forecast - by Application
- 10.2.1. Food & Beverage
- 10.2.1.1. Bakery & Confectionery
- 10.2.1.2. Dairy-based products
- 10.2.1.3. Beverages
- 10.2.1.4. Other Applications
- 10.2.2. Pharmaceutical
- 10.2.3. Personal Care
- 10.2.4. Animal Feed
- 10.2.1. Food & Beverage
- 10.1. Market Analysis, Insights and Forecast - by Type
- 11. North America Anthocyanin Industry Analysis, Insights and Forecast, 2019-2031
- 11.1. Market Analysis, Insights and Forecast - By Country/Sub-region
- 11.1.1 United States
- 11.1.2 Canada
- 11.1.3 Mexico
- 11.1.4 Rest of North America
- 12. Europe Anthocyanin Industry Analysis, Insights and Forecast, 2019-2031
- 12.1. Market Analysis, Insights and Forecast - By Country/Sub-region
- 12.1.1 Spain
- 12.1.2 United Kingdom
- 12.1.3 Germany
- 12.1.4 France
- 12.1.5 Italy
- 12.1.6 Russia
- 12.1.7 Rest of Europe
- 13. Asia Pacific Anthocyanin Industry Analysis, Insights and Forecast, 2019-2031
- 13.1. Market Analysis, Insights and Forecast - By Country/Sub-region
- 13.1.1 China
- 13.1.2 Japan
- 13.1.3 India
- 13.1.4 Australia
- 13.1.5 Rest of Asia Pacific
- 14. South America Anthocyanin Industry Analysis, Insights and Forecast, 2019-2031
- 14.1. Market Analysis, Insights and Forecast - By Country/Sub-region
- 14.1.1 Brazil
- 14.1.2 Argentina
- 14.1.3 Rest of South America
- 15. Middle East and Africa Anthocyanin Industry Analysis, Insights and Forecast, 2019-2031
- 15.1. Market Analysis, Insights and Forecast - By Country/Sub-region
- 15.1.1 South Africa
- 15.1.2 Saudi Arabia
- 15.1.3 Rest of Middle East and Africa
- 16. Competitive Analysis
- 16.1. Global Market Share Analysis 2024
- 16.2. Company Profiles
- 16.2.1 Kalsec Inc
- 16.2.1.1. Overview
- 16.2.1.2. Products
- 16.2.1.3. SWOT Analysis
- 16.2.1.4. Recent Developments
- 16.2.1.5. Financials (Based on Availability)
- 16.2.2 Anthocyanin Naturals India Pvt Ltd
- 16.2.2.1. Overview
- 16.2.2.2. Products
- 16.2.2.3. SWOT Analysis
- 16.2.2.4. Recent Developments
- 16.2.2.5. Financials (Based on Availability)
- 16.2.3 Archer Daniels Midland Company
- 16.2.3.1. Overview
- 16.2.3.2. Products
- 16.2.3.3. SWOT Analysis
- 16.2.3.4. Recent Developments
- 16.2.3.5. Financials (Based on Availability)
- 16.2.4 Novozymes A/S (Chr Hansen)
- 16.2.4.1. Overview
- 16.2.4.2. Products
- 16.2.4.3. SWOT Analysis
- 16.2.4.4. Recent Developments
- 16.2.4.5. Financials (Based on Availability)
- 16.2.5 Givaudan (DDW The Color House)
- 16.2.5.1. Overview
- 16.2.5.2. Products
- 16.2.5.3. SWOT Analysis
- 16.2.5.4. Recent Developments
- 16.2.5.5. Financials (Based on Availability)
- 16.2.6 GNT Group B V
- 16.2.6.1. Overview
- 16.2.6.2. Products
- 16.2.6.3. SWOT Analysis
- 16.2.6.4. Recent Developments
- 16.2.6.5. Financials (Based on Availability)
- 16.2.7 Synthite Industries Ltd
- 16.2.7.1. Overview
- 16.2.7.2. Products
- 16.2.7.3. SWOT Analysis
- 16.2.7.4. Recent Developments
- 16.2.7.5. Financials (Based on Availability)
- 16.2.8 Symrise AG
- 16.2.8.1. Overview
- 16.2.8.2. Products
- 16.2.8.3. SWOT Analysis
- 16.2.8.4. Recent Developments
- 16.2.8.5. Financials (Based on Availability)
- 16.2.9 Sensient Technologies Corporation
- 16.2.9.1. Overview
- 16.2.9.2. Products
- 16.2.9.3. SWOT Analysis
- 16.2.9.4. Recent Developments
- 16.2.9.5. Financials (Based on Availability)
- 16.2.10 Döhler Group SE*List Not Exhaustive
- 16.2.10.1. Overview
- 16.2.10.2. Products
- 16.2.10.3. SWOT Analysis
- 16.2.10.4. Recent Developments
- 16.2.10.5. Financials (Based on Availability)
- 16.2.1 Kalsec Inc
List of Figures
- Figure 1: Global Anthocyanin Industry Revenue Breakdown (Million, %) by Region 2024 & 2032
- Figure 2: North America Anthocyanin Industry Revenue (Million), by Country 2024 & 2032
- Figure 3: North America Anthocyanin Industry Revenue Share (%), by Country 2024 & 2032
- Figure 4: Europe Anthocyanin Industry Revenue (Million), by Country 2024 & 2032
- Figure 5: Europe Anthocyanin Industry Revenue Share (%), by Country 2024 & 2032
- Figure 6: Asia Pacific Anthocyanin Industry Revenue (Million), by Country 2024 & 2032
- Figure 7: Asia Pacific Anthocyanin Industry Revenue Share (%), by Country 2024 & 2032
- Figure 8: South America Anthocyanin Industry Revenue (Million), by Country 2024 & 2032
- Figure 9: South America Anthocyanin Industry Revenue Share (%), by Country 2024 & 2032
- Figure 10: Middle East and Africa Anthocyanin Industry Revenue (Million), by Country 2024 & 2032
- Figure 11: Middle East and Africa Anthocyanin Industry Revenue Share (%), by Country 2024 & 2032
- Figure 12: North America Anthocyanin Industry Revenue (Million), by Type 2024 & 2032
- Figure 13: North America Anthocyanin Industry Revenue Share (%), by Type 2024 & 2032
- Figure 14: North America Anthocyanin Industry Revenue (Million), by Application 2024 & 2032
- Figure 15: North America Anthocyanin Industry Revenue Share (%), by Application 2024 & 2032
- Figure 16: North America Anthocyanin Industry Revenue (Million), by Country 2024 & 2032
- Figure 17: North America Anthocyanin Industry Revenue Share (%), by Country 2024 & 2032
- Figure 18: Europe Anthocyanin Industry Revenue (Million), by Type 2024 & 2032
- Figure 19: Europe Anthocyanin Industry Revenue Share (%), by Type 2024 & 2032
- Figure 20: Europe Anthocyanin Industry Revenue (Million), by Application 2024 & 2032
- Figure 21: Europe Anthocyanin Industry Revenue Share (%), by Application 2024 & 2032
- Figure 22: Europe Anthocyanin Industry Revenue (Million), by Country 2024 & 2032
- Figure 23: Europe Anthocyanin Industry Revenue Share (%), by Country 2024 & 2032
- Figure 24: Asia Pacific Anthocyanin Industry Revenue (Million), by Type 2024 & 2032
- Figure 25: Asia Pacific Anthocyanin Industry Revenue Share (%), by Type 2024 & 2032
- Figure 26: Asia Pacific Anthocyanin Industry Revenue (Million), by Application 2024 & 2032
- Figure 27: Asia Pacific Anthocyanin Industry Revenue Share (%), by Application 2024 & 2032
- Figure 28: Asia Pacific Anthocyanin Industry Revenue (Million), by Country 2024 & 2032
- Figure 29: Asia Pacific Anthocyanin Industry Revenue Share (%), by Country 2024 & 2032
- Figure 30: South America Anthocyanin Industry Revenue (Million), by Type 2024 & 2032
- Figure 31: South America Anthocyanin Industry Revenue Share (%), by Type 2024 & 2032
- Figure 32: South America Anthocyanin Industry Revenue (Million), by Application 2024 & 2032
- Figure 33: South America Anthocyanin Industry Revenue Share (%), by Application 2024 & 2032
- Figure 34: South America Anthocyanin Industry Revenue (Million), by Country 2024 & 2032
- Figure 35: South America Anthocyanin Industry Revenue Share (%), by Country 2024 & 2032
- Figure 36: Middle East and Africa Anthocyanin Industry Revenue (Million), by Type 2024 & 2032
- Figure 37: Middle East and Africa Anthocyanin Industry Revenue Share (%), by Type 2024 & 2032
- Figure 38: Middle East and Africa Anthocyanin Industry Revenue (Million), by Application 2024 & 2032
- Figure 39: Middle East and Africa Anthocyanin Industry Revenue Share (%), by Application 2024 & 2032
- Figure 40: Middle East and Africa Anthocyanin Industry Revenue (Million), by Country 2024 & 2032
- Figure 41: Middle East and Africa Anthocyanin Industry Revenue Share (%), by Country 2024 & 2032
List of Tables
- Table 1: Global Anthocyanin Industry Revenue Million Forecast, by Region 2019 & 2032
- Table 2: Global Anthocyanin Industry Revenue Million Forecast, by Type 2019 & 2032
- Table 3: Global Anthocyanin Industry Revenue Million Forecast, by Application 2019 & 2032
- Table 4: Global Anthocyanin Industry Revenue Million Forecast, by Region 2019 & 2032
- Table 5: Global Anthocyanin Industry Revenue Million Forecast, by Country 2019 & 2032
- Table 6: United States Anthocyanin Industry Revenue (Million) Forecast, by Application 2019 & 2032
- Table 7: Canada Anthocyanin Industry Revenue (Million) Forecast, by Application 2019 & 2032
- Table 8: Mexico Anthocyanin Industry Revenue (Million) Forecast, by Application 2019 & 2032
- Table 9: Rest of North America Anthocyanin Industry Revenue (Million) Forecast, by Application 2019 & 2032
- Table 10: Global Anthocyanin Industry Revenue Million Forecast, by Country 2019 & 2032
- Table 11: Spain Anthocyanin Industry Revenue (Million) Forecast, by Application 2019 & 2032
- Table 12: United Kingdom Anthocyanin Industry Revenue (Million) Forecast, by Application 2019 & 2032
- Table 13: Germany Anthocyanin Industry Revenue (Million) Forecast, by Application 2019 & 2032
- Table 14: France Anthocyanin Industry Revenue (Million) Forecast, by Application 2019 & 2032
- Table 15: Italy Anthocyanin Industry Revenue (Million) Forecast, by Application 2019 & 2032
- Table 16: Russia Anthocyanin Industry Revenue (Million) Forecast, by Application 2019 & 2032
- Table 17: Rest of Europe Anthocyanin Industry Revenue (Million) Forecast, by Application 2019 & 2032
- Table 18: Global Anthocyanin Industry Revenue Million Forecast, by Country 2019 & 2032
- Table 19: China Anthocyanin Industry Revenue (Million) Forecast, by Application 2019 & 2032
- Table 20: Japan Anthocyanin Industry Revenue (Million) Forecast, by Application 2019 & 2032
- Table 21: India Anthocyanin Industry Revenue (Million) Forecast, by Application 2019 & 2032
- Table 22: Australia Anthocyanin Industry Revenue (Million) Forecast, by Application 2019 & 2032
- Table 23: Rest of Asia Pacific Anthocyanin Industry Revenue (Million) Forecast, by Application 2019 & 2032
- Table 24: Global Anthocyanin Industry Revenue Million Forecast, by Country 2019 & 2032
- Table 25: Brazil Anthocyanin Industry Revenue (Million) Forecast, by Application 2019 & 2032
- Table 26: Argentina Anthocyanin Industry Revenue (Million) Forecast, by Application 2019 & 2032
- Table 27: Rest of South America Anthocyanin Industry Revenue (Million) Forecast, by Application 2019 & 2032
- Table 28: Global Anthocyanin Industry Revenue Million Forecast, by Country 2019 & 2032
- Table 29: South Africa Anthocyanin Industry Revenue (Million) Forecast, by Application 2019 & 2032
- Table 30: Saudi Arabia Anthocyanin Industry Revenue (Million) Forecast, by Application 2019 & 2032
- Table 31: Rest of Middle East and Africa Anthocyanin Industry Revenue (Million) Forecast, by Application 2019 & 2032
- Table 32: Global Anthocyanin Industry Revenue Million Forecast, by Type 2019 & 2032
- Table 33: Global Anthocyanin Industry Revenue Million Forecast, by Application 2019 & 2032
- Table 34: Global Anthocyanin Industry Revenue Million Forecast, by Country 2019 & 2032
- Table 35: United States Anthocyanin Industry Revenue (Million) Forecast, by Application 2019 & 2032
- Table 36: Canada Anthocyanin Industry Revenue (Million) Forecast, by Application 2019 & 2032
- Table 37: Mexico Anthocyanin Industry Revenue (Million) Forecast, by Application 2019 & 2032
- Table 38: Rest of North America Anthocyanin Industry Revenue (Million) Forecast, by Application 2019 & 2032
- Table 39: Global Anthocyanin Industry Revenue Million Forecast, by Type 2019 & 2032
- Table 40: Global Anthocyanin Industry Revenue Million Forecast, by Application 2019 & 2032
- Table 41: Global Anthocyanin Industry Revenue Million Forecast, by Country 2019 & 2032
- Table 42: Spain Anthocyanin Industry Revenue (Million) Forecast, by Application 2019 & 2032
- Table 43: United Kingdom Anthocyanin Industry Revenue (Million) Forecast, by Application 2019 & 2032
- Table 44: Germany Anthocyanin Industry Revenue (Million) Forecast, by Application 2019 & 2032
- Table 45: France Anthocyanin Industry Revenue (Million) Forecast, by Application 2019 & 2032
- Table 46: Italy Anthocyanin Industry Revenue (Million) Forecast, by Application 2019 & 2032
- Table 47: Russia Anthocyanin Industry Revenue (Million) Forecast, by Application 2019 & 2032
- Table 48: Rest of Europe Anthocyanin Industry Revenue (Million) Forecast, by Application 2019 & 2032
- Table 49: Global Anthocyanin Industry Revenue Million Forecast, by Type 2019 & 2032
- Table 50: Global Anthocyanin Industry Revenue Million Forecast, by Application 2019 & 2032
- Table 51: Global Anthocyanin Industry Revenue Million Forecast, by Country 2019 & 2032
- Table 52: China Anthocyanin Industry Revenue (Million) Forecast, by Application 2019 & 2032
- Table 53: Japan Anthocyanin Industry Revenue (Million) Forecast, by Application 2019 & 2032
- Table 54: India Anthocyanin Industry Revenue (Million) Forecast, by Application 2019 & 2032
- Table 55: Australia Anthocyanin Industry Revenue (Million) Forecast, by Application 2019 & 2032
- Table 56: Rest of Asia Pacific Anthocyanin Industry Revenue (Million) Forecast, by Application 2019 & 2032
- Table 57: Global Anthocyanin Industry Revenue Million Forecast, by Type 2019 & 2032
- Table 58: Global Anthocyanin Industry Revenue Million Forecast, by Application 2019 & 2032
- Table 59: Global Anthocyanin Industry Revenue Million Forecast, by Country 2019 & 2032
- Table 60: Brazil Anthocyanin Industry Revenue (Million) Forecast, by Application 2019 & 2032
- Table 61: Argentina Anthocyanin Industry Revenue (Million) Forecast, by Application 2019 & 2032
- Table 62: Rest of South America Anthocyanin Industry Revenue (Million) Forecast, by Application 2019 & 2032
- Table 63: Global Anthocyanin Industry Revenue Million Forecast, by Type 2019 & 2032
- Table 64: Global Anthocyanin Industry Revenue Million Forecast, by Application 2019 & 2032
- Table 65: Global Anthocyanin Industry Revenue Million Forecast, by Country 2019 & 2032
- Table 66: South Africa Anthocyanin Industry Revenue (Million) Forecast, by Application 2019 & 2032
- Table 67: Saudi Arabia Anthocyanin Industry Revenue (Million) Forecast, by Application 2019 & 2032
- Table 68: Rest of Middle East and Africa Anthocyanin Industry Revenue (Million) Forecast, by Application 2019 & 2032
Frequently Asked Questions
1. What is the projected Compound Annual Growth Rate (CAGR) of the Anthocyanin Industry?
The projected CAGR is approximately 5.15%.
2. Which companies are prominent players in the Anthocyanin Industry?
Key companies in the market include Kalsec Inc, Anthocyanin Naturals India Pvt Ltd, Archer Daniels Midland Company, Novozymes A/S (Chr Hansen), Givaudan (DDW The Color House), GNT Group B V, Synthite Industries Ltd, Symrise AG, Sensient Technologies Corporation, Döhler Group SE*List Not Exhaustive.
3. What are the main segments of the Anthocyanin Industry?
The market segments include Type, Application.
4. Can you provide details about the market size?
The market size is estimated to be USD 355.67 Million as of 2022.
5. What are some drivers contributing to market growth?
Increasing Consumer Awareness Regarding Natural Products; Growing Demand for Anthocyanin in Pharmaceutical Industry.
6. What are the notable trends driving market growth?
Increasing Consumer Awareness Regarding Natural Products.
7. Are there any restraints impacting market growth?
Easy Availability of Synthetic Food Colorant.
8. Can you provide examples of recent developments in the market?
September 2022: Givaudan Active Beauty introduced New Purple 2364, a vegan pigment specifically designed for use in makeup formulations. This sustainable pigment is derived through green fractionation from Raphanus sativus L., adding to Givaudan's portfolio of sustainable alternatives to synthetic pigments. The company initially launched this portfolio in 2020 with the introduction of New Red 1805.
9. What pricing options are available for accessing the report?
Pricing options include single-user, multi-user, and enterprise licenses priced at USD 4750, USD 5250, and USD 8750 respectively.
10. Is the market size provided in terms of value or volume?
The market size is provided in terms of value, measured in Million.
11. Are there any specific market keywords associated with the report?
Yes, the market keyword associated with the report is "Anthocyanin Industry," which aids in identifying and referencing the specific market segment covered.
12. How do I determine which pricing option suits my needs best?
The pricing options vary based on user requirements and access needs. Individual users may opt for single-user licenses, while businesses requiring broader access may choose multi-user or enterprise licenses for cost-effective access to the report.
13. Are there any additional resources or data provided in the Anthocyanin Industry report?
While the report offers comprehensive insights, it's advisable to review the specific contents or supplementary materials provided to ascertain if additional resources or data are available.
14. How can I stay updated on further developments or reports in the Anthocyanin Industry?
To stay informed about further developments, trends, and reports in the Anthocyanin Industry, consider subscribing to industry newsletters, following relevant companies and organizations, or regularly checking reputable industry news sources and publications.
Methodology
Step 1 - Identification of Relevant Samples Size from Population Database


Step 2 - Approaches for Defining Global Market Size (Value, Volume* & Price*)

Note*: In applicable scenarios
Step 3 - Data Sources
Primary Research
- Web Analytics
- Survey Reports
- Research Institute
- Latest Research Reports
- Opinion Leaders
Secondary Research
- Annual Reports
- White Paper
- Latest Press Release
- Industry Association
- Paid Database
- Investor Presentations

Step 4 - Data Triangulation
Involves using different sources of information in order to increase the validity of a study
These sources are likely to be stakeholders in a program - participants, other researchers, program staff, other community members, and so on.
Then we put all data in single framework & apply various statistical tools to find out the dynamic on the market.
During the analysis stage, feedback from the stakeholder groups would be compared to determine areas of agreement as well as areas of divergence


