
Key Insights
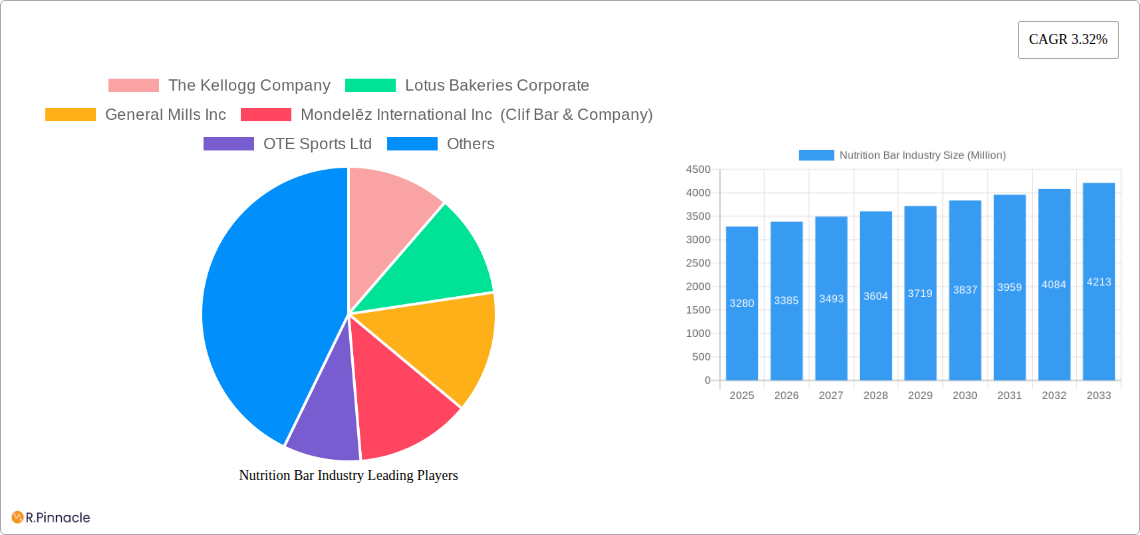
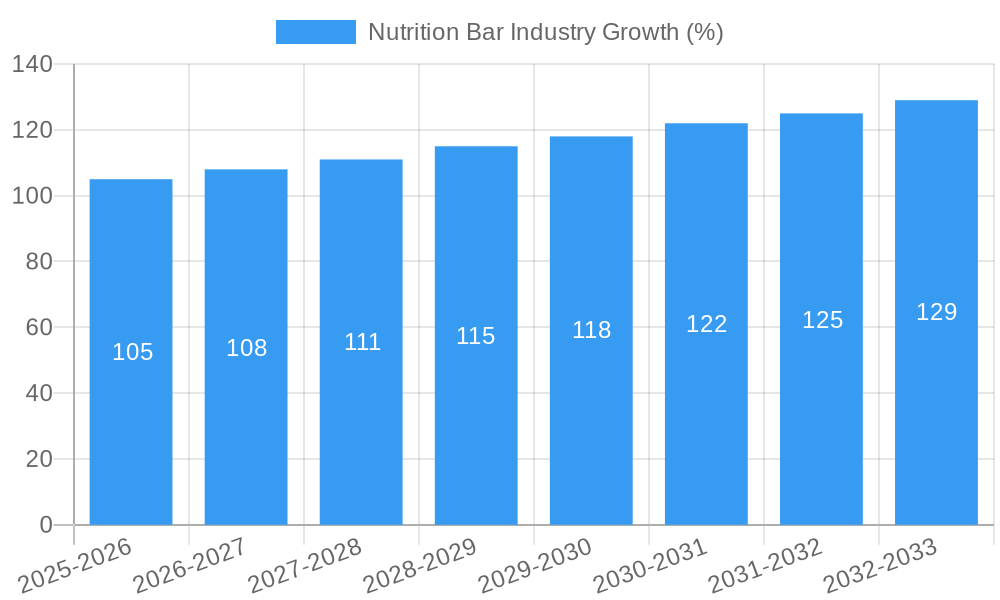
The global nutrition bar market, valued at $3.28 billion in 2025, is projected to experience steady growth, driven by increasing health consciousness and consumer demand for convenient, on-the-go nutrition solutions. A Compound Annual Growth Rate (CAGR) of 3.32% from 2025 to 2033 indicates a robust market expansion, reaching an estimated value exceeding $4.5 billion by 2033. This growth is fueled by several key factors. The rising prevalence of health conditions like obesity and diabetes is prompting consumers to seek healthier alternatives to traditional snacks. The increasing popularity of fitness and active lifestyles further supports this trend. Furthermore, the market is witnessing innovation in product offerings, with the emergence of bars catering to specific dietary needs, such as vegan, gluten-free, and high-protein options. Major players like Kellogg's, General Mills, and Mondelēz International are heavily invested in research and development to enhance product quality and expand their market share. However, factors like fluctuating raw material prices and intense competition could potentially restrain market growth in the coming years. Market segmentation by product type (e.g., protein bars, energy bars, meal replacement bars), distribution channels (e.g., supermarkets, online retailers), and target demographics (e.g., athletes, health-conscious individuals) will continue to be crucial in shaping future market dynamics.
The competitive landscape is characterized by both established giants and emerging players. Established players leverage extensive distribution networks and strong brand recognition, while smaller companies focus on niche markets and innovative product formulations. The strategic partnerships, acquisitions, and product launches observed in recent years are set to intensify competition and accelerate market innovation. Geographical expansion, particularly in developing economies, presents significant growth opportunities. The focus on sustainability and ethical sourcing practices is also shaping consumer preferences and influencing manufacturers’ strategies. Therefore, understanding the diverse consumer segments, evolving dietary trends, and the competitive dynamics is vital for companies to thrive in this dynamic and growing market.
Nutrition Bar Industry Report: 2019-2033
This comprehensive report provides a detailed analysis of the global nutrition bar industry, covering market size, segmentation, trends, key players, and future outlook. The study period spans from 2019 to 2033, with 2025 as the base and estimated year. This report is essential for industry professionals, investors, and anyone seeking a deep understanding of this dynamic market projected to be worth billions.
Nutrition Bar Industry Market Structure & Innovation Trends
The nutrition bar market is characterized by a mix of large multinational corporations and smaller, specialized brands. Market concentration is moderate, with a few key players holding significant market share, but a substantial number of smaller players contributing to overall market volume. The market is driven by innovation in ingredients, formulations, and product offerings to cater to diverse consumer needs. Health and wellness trends, along with increasing demand for convenient and portable snacks, significantly influence market growth. Regulatory frameworks vary by region, impacting ingredient sourcing and labeling requirements. Product substitutes include other convenient snack options like yogurt, fruit, and energy drinks. End-users are diverse, including athletes, health-conscious individuals, and busy professionals seeking a quick and nutritious meal replacement or snack. Mergers and acquisitions (M&A) activity is frequent, as larger companies seek to expand their product portfolios and market reach. For instance, the acquisition of Clif Bar & Company by Mondelez International in 2022 is projected to increase Mondelez's global snack bar business to over USD 1 billion. Key M&A deal values are in the range of hundreds of millions of USD, reflecting the considerable value placed on established brands and market share. Market share data for leading companies is unavailable, but significant market share is expected to be held by the likes of Kellogg's, General Mills, and Mondelez.
Nutrition Bar Industry Market Dynamics & Trends
The global nutrition bar market is experiencing robust growth, driven by several key factors. Rising health consciousness and increasing disposable incomes are fueling demand for healthier and more convenient snack options. The market is witnessing technological advancements in ingredients and manufacturing processes, leading to the introduction of innovative products with enhanced nutritional profiles and improved taste and texture. Consumer preferences are shifting towards bars with natural ingredients, reduced sugar content, and functional benefits, such as added protein or fiber. The competitive landscape is intense, with established players and emerging brands vying for market share through product differentiation, branding, and marketing strategies. The compound annual growth rate (CAGR) for the nutrition bar market during the forecast period (2025-2033) is estimated at xx%, indicating strong future growth potential. Market penetration is high in developed countries, but significant growth opportunities exist in emerging economies.
Dominant Regions & Segments in Nutrition Bar Industry
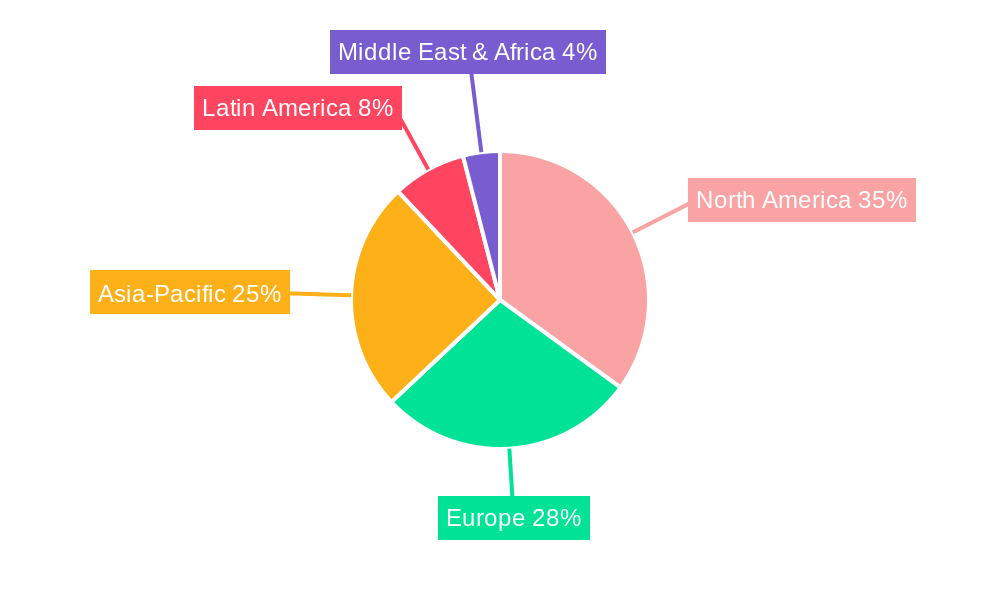
The North American market currently holds a dominant position in the global nutrition bar industry, driven by factors such as high consumer spending on health and wellness products and a strong preference for convenient snacks. The high level of disposable income coupled with strong marketing and distribution infrastructure in the region supports the industry.
- Key Drivers in North America:
- High consumer spending on health and wellness products.
- Strong preference for convenient snack options.
- Well-established distribution networks.
- High levels of disposable income.
Europe also holds a significant market share, with consumers demonstrating a growing interest in healthy and functional foods. Other regions like Asia-Pacific are witnessing rapid growth, driven by rising disposable incomes and increasing health consciousness. Market segmentation is driven by bar type (energy, protein, meal replacement), ingredients (organic, gluten-free), and target consumer (athletes, health-conscious individuals).
Nutrition Bar Industry Product Innovations
The nutrition bar market is witnessing continuous product innovation driven by consumer demand for healthier and more functional products. The industry is exploring new ingredient combinations, incorporating superfoods, adapting to dietary restrictions like vegan and gluten-free options, and creating innovative textures and flavors. These advancements cater to changing consumer preferences and provide competitive advantages in a saturated market. Technological trends focus on improved manufacturing processes for increased efficiency and sustainability. Market fit is achieved through carefully considered product formulations that meet specific nutritional and functional needs.
Report Scope & Segmentation Analysis
This report segments the nutrition bar market based on product type (energy bars, protein bars, meal replacement bars, etc.), distribution channel (supermarkets, convenience stores, online retailers), and geography (North America, Europe, Asia-Pacific, etc.). Each segment's growth projections, market size (in millions of USD), and competitive dynamics are analyzed in detail. Projected growth rates vary across segments, with some exhibiting faster growth than others. The competitive landscape in each segment is influenced by factors like brand recognition, product differentiation, and pricing strategies.
Key Drivers of Nutrition Bar Industry Growth
Several factors contribute to the growth of the nutrition bar industry. The rising health consciousness among consumers, coupled with the increasing demand for convenient and nutritious snack options, is a key driver. Technological advancements in product formulation and manufacturing processes enable the creation of healthier and tastier bars. Favorable economic conditions in several regions boost consumer spending, increasing the demand for premium nutrition bars. Government regulations regarding food labeling and health claims help maintain the quality and safety of the product, providing confidence to consumers. Examples include increased demand for vegan/vegetarian bars in line with wider lifestyle and dietary trends.
Challenges in the Nutrition Bar Industry Sector
The nutrition bar industry faces several challenges, including intense competition from both established and emerging brands, leading to price wars and reduced profit margins. Fluctuations in raw material prices, primarily ingredients, influence overall production costs and pricing strategies. Stringent regulatory requirements regarding food safety and labeling add complexity to product development and market entry. Supply chain disruptions can impact production and availability. The cumulative impact of these challenges can hinder market growth and profitability for some players.
Emerging Opportunities in Nutrition Bar Industry
The nutrition bar industry presents several exciting opportunities for growth. The rise in demand for functional foods, such as bars with added vitamins, minerals, or probiotics, is opening new market segments. Innovations in packaging technology, offering extended shelf life and improved sustainability, appeal to consumers. Expansion into emerging markets in Asia and Africa presents significant potential, as health consciousness and purchasing power rise in these regions. Focus on sustainable and ethically sourced ingredients further enhances the market potential of such products.
Leading Players in the Nutrition Bar Industry Market
- The Kellogg Company
- Lotus Bakeries Corporate
- General Mills Inc
- Mondelēz International Inc (Clif Bar & Company)
- OTE Sports Ltd
- Post Holdings Inc
- Mars Incorporated (Kind LLC)
- PepsiCo Inc
- Wholesome Habits Private Limited (EAT Anytime)
- ProBar LLC
- Nestlé S A
- *List Not Exhaustive
Key Developments in Nutrition Bar Industry
- August 2022: Mondelez International Inc. acquired Clif Bar & Company, significantly expanding its global snack bar business.
- August 2021: General Mills Inc. launched Performance Protein bars under its Cinnamon Toast Crunch and Golden Grahams brands.
- April 2021: Kellogg India launched K Energy bars to target the "in-between meal" segment.
Future Outlook for Nutrition Bar Industry Market
The future of the nutrition bar industry looks promising, with continued growth driven by evolving consumer preferences, technological innovations, and expansion into new markets. Strategic opportunities lie in developing customized products to cater to niche segments, leveraging digital marketing for enhanced brand visibility, and adopting sustainable practices throughout the value chain. Further innovation in product formulations, combined with effective marketing strategies targeting specific health needs will help drive future growth.
Nutrition Bar Industry Segmentation
-
1. Type
- 1.1. Organic
- 1.2. Conventional
-
2. Distribution Channel
- 2.1. Supermarkets/Hypermarkets
- 2.2. Convenience Stores
- 2.3. Specialty Stores
- 2.4. Online Retail Stores
- 2.5. Other Distribution Channels
Nutrition Bar Industry Segmentation By Geography
-
1. North America
- 1.1. United States
- 1.2. Canada
- 1.3. Mexico
- 1.4. Rest of North America
-
2. Europe
- 2.1. United Kingdom
- 2.2. Germany
- 2.3. Spain
- 2.4. France
- 2.5. Italy
- 2.6. Russia
- 2.7. Rest of Europe
-
3. Asia Pacific
- 3.1. China
- 3.2. Japan
- 3.3. India
- 3.4. Australia
- 3.5. Rest of Asia Pacific
-
4. South America
- 4.1. Brazil
- 4.2. Argentina
- 4.3. Rest of South America
-
5. Middle East and Africa
- 5.1. Saudi Arabia
- 5.2. South Africa
- 5.3. Rest Middle East and Africa
Nutrition Bar Industry REPORT HIGHLIGHTS
| Aspects | Details |
|---|---|
| Study Period | 2019-2033 |
| Base Year | 2024 |
| Estimated Year | 2025 |
| Forecast Period | 2025-2033 |
| Historical Period | 2019-2024 |
| Growth Rate | CAGR of 3.32% from 2019-2033 |
| Segmentation |
|
Table of Contents
- 1. Introduction
- 1.1. Research Scope
- 1.2. Market Segmentation
- 1.3. Research Methodology
- 1.4. Definitions and Assumptions
- 2. Executive Summary
- 2.1. Introduction
- 3. Market Dynamics
- 3.1. Introduction
- 3.2. Market Drivers
- 3.3. Market Restrains
- 3.4. Market Trends
- 3.4.1. Rising Demand for Healthy On-the-go Snacking
- 4. Market Factor Analysis
- 4.1. Porters Five Forces
- 4.2. Supply/Value Chain
- 4.3. PESTEL analysis
- 4.4. Market Entropy
- 4.5. Patent/Trademark Analysis
- 5. Global Nutrition Bar Industry Analysis, Insights and Forecast, 2019-2031
- 5.1. Market Analysis, Insights and Forecast - by Type
- 5.1.1. Organic
- 5.1.2. Conventional
- 5.2. Market Analysis, Insights and Forecast - by Distribution Channel
- 5.2.1. Supermarkets/Hypermarkets
- 5.2.2. Convenience Stores
- 5.2.3. Specialty Stores
- 5.2.4. Online Retail Stores
- 5.2.5. Other Distribution Channels
- 5.3. Market Analysis, Insights and Forecast - by Region
- 5.3.1. North America
- 5.3.2. Europe
- 5.3.3. Asia Pacific
- 5.3.4. South America
- 5.3.5. Middle East and Africa
- 5.1. Market Analysis, Insights and Forecast - by Type
- 6. North America Nutrition Bar Industry Analysis, Insights and Forecast, 2019-2031
- 6.1. Market Analysis, Insights and Forecast - by Type
- 6.1.1. Organic
- 6.1.2. Conventional
- 6.2. Market Analysis, Insights and Forecast - by Distribution Channel
- 6.2.1. Supermarkets/Hypermarkets
- 6.2.2. Convenience Stores
- 6.2.3. Specialty Stores
- 6.2.4. Online Retail Stores
- 6.2.5. Other Distribution Channels
- 6.1. Market Analysis, Insights and Forecast - by Type
- 7. Europe Nutrition Bar Industry Analysis, Insights and Forecast, 2019-2031
- 7.1. Market Analysis, Insights and Forecast - by Type
- 7.1.1. Organic
- 7.1.2. Conventional
- 7.2. Market Analysis, Insights and Forecast - by Distribution Channel
- 7.2.1. Supermarkets/Hypermarkets
- 7.2.2. Convenience Stores
- 7.2.3. Specialty Stores
- 7.2.4. Online Retail Stores
- 7.2.5. Other Distribution Channels
- 7.1. Market Analysis, Insights and Forecast - by Type
- 8. Asia Pacific Nutrition Bar Industry Analysis, Insights and Forecast, 2019-2031
- 8.1. Market Analysis, Insights and Forecast - by Type
- 8.1.1. Organic
- 8.1.2. Conventional
- 8.2. Market Analysis, Insights and Forecast - by Distribution Channel
- 8.2.1. Supermarkets/Hypermarkets
- 8.2.2. Convenience Stores
- 8.2.3. Specialty Stores
- 8.2.4. Online Retail Stores
- 8.2.5. Other Distribution Channels
- 8.1. Market Analysis, Insights and Forecast - by Type
- 9. South America Nutrition Bar Industry Analysis, Insights and Forecast, 2019-2031
- 9.1. Market Analysis, Insights and Forecast - by Type
- 9.1.1. Organic
- 9.1.2. Conventional
- 9.2. Market Analysis, Insights and Forecast - by Distribution Channel
- 9.2.1. Supermarkets/Hypermarkets
- 9.2.2. Convenience Stores
- 9.2.3. Specialty Stores
- 9.2.4. Online Retail Stores
- 9.2.5. Other Distribution Channels
- 9.1. Market Analysis, Insights and Forecast - by Type
- 10. Middle East and Africa Nutrition Bar Industry Analysis, Insights and Forecast, 2019-2031
- 10.1. Market Analysis, Insights and Forecast - by Type
- 10.1.1. Organic
- 10.1.2. Conventional
- 10.2. Market Analysis, Insights and Forecast - by Distribution Channel
- 10.2.1. Supermarkets/Hypermarkets
- 10.2.2. Convenience Stores
- 10.2.3. Specialty Stores
- 10.2.4. Online Retail Stores
- 10.2.5. Other Distribution Channels
- 10.1. Market Analysis, Insights and Forecast - by Type
- 11. Competitive Analysis
- 11.1. Global Market Share Analysis 2024
- 11.2. Company Profiles
- 11.2.1 The Kellogg Company
- 11.2.1.1. Overview
- 11.2.1.2. Products
- 11.2.1.3. SWOT Analysis
- 11.2.1.4. Recent Developments
- 11.2.1.5. Financials (Based on Availability)
- 11.2.2 Lotus Bakeries Corporate
- 11.2.2.1. Overview
- 11.2.2.2. Products
- 11.2.2.3. SWOT Analysis
- 11.2.2.4. Recent Developments
- 11.2.2.5. Financials (Based on Availability)
- 11.2.3 General Mills Inc
- 11.2.3.1. Overview
- 11.2.3.2. Products
- 11.2.3.3. SWOT Analysis
- 11.2.3.4. Recent Developments
- 11.2.3.5. Financials (Based on Availability)
- 11.2.4 Mondelēz International Inc (Clif Bar & Company)
- 11.2.4.1. Overview
- 11.2.4.2. Products
- 11.2.4.3. SWOT Analysis
- 11.2.4.4. Recent Developments
- 11.2.4.5. Financials (Based on Availability)
- 11.2.5 OTE Sports Ltd
- 11.2.5.1. Overview
- 11.2.5.2. Products
- 11.2.5.3. SWOT Analysis
- 11.2.5.4. Recent Developments
- 11.2.5.5. Financials (Based on Availability)
- 11.2.6 Post Holdings Inc
- 11.2.6.1. Overview
- 11.2.6.2. Products
- 11.2.6.3. SWOT Analysis
- 11.2.6.4. Recent Developments
- 11.2.6.5. Financials (Based on Availability)
- 11.2.7 Mars Incorporated (Kind LLC)
- 11.2.7.1. Overview
- 11.2.7.2. Products
- 11.2.7.3. SWOT Analysis
- 11.2.7.4. Recent Developments
- 11.2.7.5. Financials (Based on Availability)
- 11.2.8 PepsiCo Inc
- 11.2.8.1. Overview
- 11.2.8.2. Products
- 11.2.8.3. SWOT Analysis
- 11.2.8.4. Recent Developments
- 11.2.8.5. Financials (Based on Availability)
- 11.2.9 Wholesome Habits Private Limited (EAT Anytime)
- 11.2.9.1. Overview
- 11.2.9.2. Products
- 11.2.9.3. SWOT Analysis
- 11.2.9.4. Recent Developments
- 11.2.9.5. Financials (Based on Availability)
- 11.2.10 ProBar LLC
- 11.2.10.1. Overview
- 11.2.10.2. Products
- 11.2.10.3. SWOT Analysis
- 11.2.10.4. Recent Developments
- 11.2.10.5. Financials (Based on Availability)
- 11.2.11 Nestlé S A *List Not Exhaustive
- 11.2.11.1. Overview
- 11.2.11.2. Products
- 11.2.11.3. SWOT Analysis
- 11.2.11.4. Recent Developments
- 11.2.11.5. Financials (Based on Availability)
- 11.2.1 The Kellogg Company
List of Figures
- Figure 1: Global Nutrition Bar Industry Revenue Breakdown (Million, %) by Region 2024 & 2032
- Figure 2: Global Nutrition Bar Industry Volume Breakdown (Billion, %) by Region 2024 & 2032
- Figure 3: North America Nutrition Bar Industry Revenue (Million), by Type 2024 & 2032
- Figure 4: North America Nutrition Bar Industry Volume (Billion), by Type 2024 & 2032
- Figure 5: North America Nutrition Bar Industry Revenue Share (%), by Type 2024 & 2032
- Figure 6: North America Nutrition Bar Industry Volume Share (%), by Type 2024 & 2032
- Figure 7: North America Nutrition Bar Industry Revenue (Million), by Distribution Channel 2024 & 2032
- Figure 8: North America Nutrition Bar Industry Volume (Billion), by Distribution Channel 2024 & 2032
- Figure 9: North America Nutrition Bar Industry Revenue Share (%), by Distribution Channel 2024 & 2032
- Figure 10: North America Nutrition Bar Industry Volume Share (%), by Distribution Channel 2024 & 2032
- Figure 11: North America Nutrition Bar Industry Revenue (Million), by Country 2024 & 2032
- Figure 12: North America Nutrition Bar Industry Volume (Billion), by Country 2024 & 2032
- Figure 13: North America Nutrition Bar Industry Revenue Share (%), by Country 2024 & 2032
- Figure 14: North America Nutrition Bar Industry Volume Share (%), by Country 2024 & 2032
- Figure 15: Europe Nutrition Bar Industry Revenue (Million), by Type 2024 & 2032
- Figure 16: Europe Nutrition Bar Industry Volume (Billion), by Type 2024 & 2032
- Figure 17: Europe Nutrition Bar Industry Revenue Share (%), by Type 2024 & 2032
- Figure 18: Europe Nutrition Bar Industry Volume Share (%), by Type 2024 & 2032
- Figure 19: Europe Nutrition Bar Industry Revenue (Million), by Distribution Channel 2024 & 2032
- Figure 20: Europe Nutrition Bar Industry Volume (Billion), by Distribution Channel 2024 & 2032
- Figure 21: Europe Nutrition Bar Industry Revenue Share (%), by Distribution Channel 2024 & 2032
- Figure 22: Europe Nutrition Bar Industry Volume Share (%), by Distribution Channel 2024 & 2032
- Figure 23: Europe Nutrition Bar Industry Revenue (Million), by Country 2024 & 2032
- Figure 24: Europe Nutrition Bar Industry Volume (Billion), by Country 2024 & 2032
- Figure 25: Europe Nutrition Bar Industry Revenue Share (%), by Country 2024 & 2032
- Figure 26: Europe Nutrition Bar Industry Volume Share (%), by Country 2024 & 2032
- Figure 27: Asia Pacific Nutrition Bar Industry Revenue (Million), by Type 2024 & 2032
- Figure 28: Asia Pacific Nutrition Bar Industry Volume (Billion), by Type 2024 & 2032
- Figure 29: Asia Pacific Nutrition Bar Industry Revenue Share (%), by Type 2024 & 2032
- Figure 30: Asia Pacific Nutrition Bar Industry Volume Share (%), by Type 2024 & 2032
- Figure 31: Asia Pacific Nutrition Bar Industry Revenue (Million), by Distribution Channel 2024 & 2032
- Figure 32: Asia Pacific Nutrition Bar Industry Volume (Billion), by Distribution Channel 2024 & 2032
- Figure 33: Asia Pacific Nutrition Bar Industry Revenue Share (%), by Distribution Channel 2024 & 2032
- Figure 34: Asia Pacific Nutrition Bar Industry Volume Share (%), by Distribution Channel 2024 & 2032
- Figure 35: Asia Pacific Nutrition Bar Industry Revenue (Million), by Country 2024 & 2032
- Figure 36: Asia Pacific Nutrition Bar Industry Volume (Billion), by Country 2024 & 2032
- Figure 37: Asia Pacific Nutrition Bar Industry Revenue Share (%), by Country 2024 & 2032
- Figure 38: Asia Pacific Nutrition Bar Industry Volume Share (%), by Country 2024 & 2032
- Figure 39: South America Nutrition Bar Industry Revenue (Million), by Type 2024 & 2032
- Figure 40: South America Nutrition Bar Industry Volume (Billion), by Type 2024 & 2032
- Figure 41: South America Nutrition Bar Industry Revenue Share (%), by Type 2024 & 2032
- Figure 42: South America Nutrition Bar Industry Volume Share (%), by Type 2024 & 2032
- Figure 43: South America Nutrition Bar Industry Revenue (Million), by Distribution Channel 2024 & 2032
- Figure 44: South America Nutrition Bar Industry Volume (Billion), by Distribution Channel 2024 & 2032
- Figure 45: South America Nutrition Bar Industry Revenue Share (%), by Distribution Channel 2024 & 2032
- Figure 46: South America Nutrition Bar Industry Volume Share (%), by Distribution Channel 2024 & 2032
- Figure 47: South America Nutrition Bar Industry Revenue (Million), by Country 2024 & 2032
- Figure 48: South America Nutrition Bar Industry Volume (Billion), by Country 2024 & 2032
- Figure 49: South America Nutrition Bar Industry Revenue Share (%), by Country 2024 & 2032
- Figure 50: South America Nutrition Bar Industry Volume Share (%), by Country 2024 & 2032
- Figure 51: Middle East and Africa Nutrition Bar Industry Revenue (Million), by Type 2024 & 2032
- Figure 52: Middle East and Africa Nutrition Bar Industry Volume (Billion), by Type 2024 & 2032
- Figure 53: Middle East and Africa Nutrition Bar Industry Revenue Share (%), by Type 2024 & 2032
- Figure 54: Middle East and Africa Nutrition Bar Industry Volume Share (%), by Type 2024 & 2032
- Figure 55: Middle East and Africa Nutrition Bar Industry Revenue (Million), by Distribution Channel 2024 & 2032
- Figure 56: Middle East and Africa Nutrition Bar Industry Volume (Billion), by Distribution Channel 2024 & 2032
- Figure 57: Middle East and Africa Nutrition Bar Industry Revenue Share (%), by Distribution Channel 2024 & 2032
- Figure 58: Middle East and Africa Nutrition Bar Industry Volume Share (%), by Distribution Channel 2024 & 2032
- Figure 59: Middle East and Africa Nutrition Bar Industry Revenue (Million), by Country 2024 & 2032
- Figure 60: Middle East and Africa Nutrition Bar Industry Volume (Billion), by Country 2024 & 2032
- Figure 61: Middle East and Africa Nutrition Bar Industry Revenue Share (%), by Country 2024 & 2032
- Figure 62: Middle East and Africa Nutrition Bar Industry Volume Share (%), by Country 2024 & 2032
List of Tables
- Table 1: Global Nutrition Bar Industry Revenue Million Forecast, by Region 2019 & 2032
- Table 2: Global Nutrition Bar Industry Volume Billion Forecast, by Region 2019 & 2032
- Table 3: Global Nutrition Bar Industry Revenue Million Forecast, by Type 2019 & 2032
- Table 4: Global Nutrition Bar Industry Volume Billion Forecast, by Type 2019 & 2032
- Table 5: Global Nutrition Bar Industry Revenue Million Forecast, by Distribution Channel 2019 & 2032
- Table 6: Global Nutrition Bar Industry Volume Billion Forecast, by Distribution Channel 2019 & 2032
- Table 7: Global Nutrition Bar Industry Revenue Million Forecast, by Region 2019 & 2032
- Table 8: Global Nutrition Bar Industry Volume Billion Forecast, by Region 2019 & 2032
- Table 9: Global Nutrition Bar Industry Revenue Million Forecast, by Type 2019 & 2032
- Table 10: Global Nutrition Bar Industry Volume Billion Forecast, by Type 2019 & 2032
- Table 11: Global Nutrition Bar Industry Revenue Million Forecast, by Distribution Channel 2019 & 2032
- Table 12: Global Nutrition Bar Industry Volume Billion Forecast, by Distribution Channel 2019 & 2032
- Table 13: Global Nutrition Bar Industry Revenue Million Forecast, by Country 2019 & 2032
- Table 14: Global Nutrition Bar Industry Volume Billion Forecast, by Country 2019 & 2032
- Table 15: United States Nutrition Bar Industry Revenue (Million) Forecast, by Application 2019 & 2032
- Table 16: United States Nutrition Bar Industry Volume (Billion) Forecast, by Application 2019 & 2032
- Table 17: Canada Nutrition Bar Industry Revenue (Million) Forecast, by Application 2019 & 2032
- Table 18: Canada Nutrition Bar Industry Volume (Billion) Forecast, by Application 2019 & 2032
- Table 19: Mexico Nutrition Bar Industry Revenue (Million) Forecast, by Application 2019 & 2032
- Table 20: Mexico Nutrition Bar Industry Volume (Billion) Forecast, by Application 2019 & 2032
- Table 21: Rest of North America Nutrition Bar Industry Revenue (Million) Forecast, by Application 2019 & 2032
- Table 22: Rest of North America Nutrition Bar Industry Volume (Billion) Forecast, by Application 2019 & 2032
- Table 23: Global Nutrition Bar Industry Revenue Million Forecast, by Type 2019 & 2032
- Table 24: Global Nutrition Bar Industry Volume Billion Forecast, by Type 2019 & 2032
- Table 25: Global Nutrition Bar Industry Revenue Million Forecast, by Distribution Channel 2019 & 2032
- Table 26: Global Nutrition Bar Industry Volume Billion Forecast, by Distribution Channel 2019 & 2032
- Table 27: Global Nutrition Bar Industry Revenue Million Forecast, by Country 2019 & 2032
- Table 28: Global Nutrition Bar Industry Volume Billion Forecast, by Country 2019 & 2032
- Table 29: United Kingdom Nutrition Bar Industry Revenue (Million) Forecast, by Application 2019 & 2032
- Table 30: United Kingdom Nutrition Bar Industry Volume (Billion) Forecast, by Application 2019 & 2032
- Table 31: Germany Nutrition Bar Industry Revenue (Million) Forecast, by Application 2019 & 2032
- Table 32: Germany Nutrition Bar Industry Volume (Billion) Forecast, by Application 2019 & 2032
- Table 33: Spain Nutrition Bar Industry Revenue (Million) Forecast, by Application 2019 & 2032
- Table 34: Spain Nutrition Bar Industry Volume (Billion) Forecast, by Application 2019 & 2032
- Table 35: France Nutrition Bar Industry Revenue (Million) Forecast, by Application 2019 & 2032
- Table 36: France Nutrition Bar Industry Volume (Billion) Forecast, by Application 2019 & 2032
- Table 37: Italy Nutrition Bar Industry Revenue (Million) Forecast, by Application 2019 & 2032
- Table 38: Italy Nutrition Bar Industry Volume (Billion) Forecast, by Application 2019 & 2032
- Table 39: Russia Nutrition Bar Industry Revenue (Million) Forecast, by Application 2019 & 2032
- Table 40: Russia Nutrition Bar Industry Volume (Billion) Forecast, by Application 2019 & 2032
- Table 41: Rest of Europe Nutrition Bar Industry Revenue (Million) Forecast, by Application 2019 & 2032
- Table 42: Rest of Europe Nutrition Bar Industry Volume (Billion) Forecast, by Application 2019 & 2032
- Table 43: Global Nutrition Bar Industry Revenue Million Forecast, by Type 2019 & 2032
- Table 44: Global Nutrition Bar Industry Volume Billion Forecast, by Type 2019 & 2032
- Table 45: Global Nutrition Bar Industry Revenue Million Forecast, by Distribution Channel 2019 & 2032
- Table 46: Global Nutrition Bar Industry Volume Billion Forecast, by Distribution Channel 2019 & 2032
- Table 47: Global Nutrition Bar Industry Revenue Million Forecast, by Country 2019 & 2032
- Table 48: Global Nutrition Bar Industry Volume Billion Forecast, by Country 2019 & 2032
- Table 49: China Nutrition Bar Industry Revenue (Million) Forecast, by Application 2019 & 2032
- Table 50: China Nutrition Bar Industry Volume (Billion) Forecast, by Application 2019 & 2032
- Table 51: Japan Nutrition Bar Industry Revenue (Million) Forecast, by Application 2019 & 2032
- Table 52: Japan Nutrition Bar Industry Volume (Billion) Forecast, by Application 2019 & 2032
- Table 53: India Nutrition Bar Industry Revenue (Million) Forecast, by Application 2019 & 2032
- Table 54: India Nutrition Bar Industry Volume (Billion) Forecast, by Application 2019 & 2032
- Table 55: Australia Nutrition Bar Industry Revenue (Million) Forecast, by Application 2019 & 2032
- Table 56: Australia Nutrition Bar Industry Volume (Billion) Forecast, by Application 2019 & 2032
- Table 57: Rest of Asia Pacific Nutrition Bar Industry Revenue (Million) Forecast, by Application 2019 & 2032
- Table 58: Rest of Asia Pacific Nutrition Bar Industry Volume (Billion) Forecast, by Application 2019 & 2032
- Table 59: Global Nutrition Bar Industry Revenue Million Forecast, by Type 2019 & 2032
- Table 60: Global Nutrition Bar Industry Volume Billion Forecast, by Type 2019 & 2032
- Table 61: Global Nutrition Bar Industry Revenue Million Forecast, by Distribution Channel 2019 & 2032
- Table 62: Global Nutrition Bar Industry Volume Billion Forecast, by Distribution Channel 2019 & 2032
- Table 63: Global Nutrition Bar Industry Revenue Million Forecast, by Country 2019 & 2032
- Table 64: Global Nutrition Bar Industry Volume Billion Forecast, by Country 2019 & 2032
- Table 65: Brazil Nutrition Bar Industry Revenue (Million) Forecast, by Application 2019 & 2032
- Table 66: Brazil Nutrition Bar Industry Volume (Billion) Forecast, by Application 2019 & 2032
- Table 67: Argentina Nutrition Bar Industry Revenue (Million) Forecast, by Application 2019 & 2032
- Table 68: Argentina Nutrition Bar Industry Volume (Billion) Forecast, by Application 2019 & 2032
- Table 69: Rest of South America Nutrition Bar Industry Revenue (Million) Forecast, by Application 2019 & 2032
- Table 70: Rest of South America Nutrition Bar Industry Volume (Billion) Forecast, by Application 2019 & 2032
- Table 71: Global Nutrition Bar Industry Revenue Million Forecast, by Type 2019 & 2032
- Table 72: Global Nutrition Bar Industry Volume Billion Forecast, by Type 2019 & 2032
- Table 73: Global Nutrition Bar Industry Revenue Million Forecast, by Distribution Channel 2019 & 2032
- Table 74: Global Nutrition Bar Industry Volume Billion Forecast, by Distribution Channel 2019 & 2032
- Table 75: Global Nutrition Bar Industry Revenue Million Forecast, by Country 2019 & 2032
- Table 76: Global Nutrition Bar Industry Volume Billion Forecast, by Country 2019 & 2032
- Table 77: Saudi Arabia Nutrition Bar Industry Revenue (Million) Forecast, by Application 2019 & 2032
- Table 78: Saudi Arabia Nutrition Bar Industry Volume (Billion) Forecast, by Application 2019 & 2032
- Table 79: South Africa Nutrition Bar Industry Revenue (Million) Forecast, by Application 2019 & 2032
- Table 80: South Africa Nutrition Bar Industry Volume (Billion) Forecast, by Application 2019 & 2032
- Table 81: Rest Middle East and Africa Nutrition Bar Industry Revenue (Million) Forecast, by Application 2019 & 2032
- Table 82: Rest Middle East and Africa Nutrition Bar Industry Volume (Billion) Forecast, by Application 2019 & 2032
Frequently Asked Questions
1. What is the projected Compound Annual Growth Rate (CAGR) of the Nutrition Bar Industry?
The projected CAGR is approximately 3.32%.
2. Which companies are prominent players in the Nutrition Bar Industry?
Key companies in the market include The Kellogg Company, Lotus Bakeries Corporate, General Mills Inc, Mondelēz International Inc (Clif Bar & Company), OTE Sports Ltd, Post Holdings Inc, Mars Incorporated (Kind LLC), PepsiCo Inc, Wholesome Habits Private Limited (EAT Anytime), ProBar LLC, Nestlé S A *List Not Exhaustive.
3. What are the main segments of the Nutrition Bar Industry?
The market segments include Type, Distribution Channel.
4. Can you provide details about the market size?
The market size is estimated to be USD 3.28 Million as of 2022.
5. What are some drivers contributing to market growth?
N/A
6. What are the notable trends driving market growth?
Rising Demand for Healthy On-the-go Snacking.
7. Are there any restraints impacting market growth?
N/A
8. Can you provide examples of recent developments in the market?
August 2022: Clif Bar & Company, which offers a range of energy bars, was acquired by Mondelez International, Inc. With leading brands like CLIF, CLIF Kid, and LUNA complementing the company's refrigerated snacking business in the United States and popular performance nutrition business Grenade in the United Kingdom, the acquisition is anticipated to increase Mondelez International's global snack bar business to more than USD 1 billion.
9. What pricing options are available for accessing the report?
Pricing options include single-user, multi-user, and enterprise licenses priced at USD 4750, USD 5250, and USD 8750 respectively.
10. Is the market size provided in terms of value or volume?
The market size is provided in terms of value, measured in Million and volume, measured in Billion.
11. Are there any specific market keywords associated with the report?
Yes, the market keyword associated with the report is "Nutrition Bar Industry," which aids in identifying and referencing the specific market segment covered.
12. How do I determine which pricing option suits my needs best?
The pricing options vary based on user requirements and access needs. Individual users may opt for single-user licenses, while businesses requiring broader access may choose multi-user or enterprise licenses for cost-effective access to the report.
13. Are there any additional resources or data provided in the Nutrition Bar Industry report?
While the report offers comprehensive insights, it's advisable to review the specific contents or supplementary materials provided to ascertain if additional resources or data are available.
14. How can I stay updated on further developments or reports in the Nutrition Bar Industry?
To stay informed about further developments, trends, and reports in the Nutrition Bar Industry, consider subscribing to industry newsletters, following relevant companies and organizations, or regularly checking reputable industry news sources and publications.
Methodology
Step 1 - Identification of Relevant Samples Size from Population Database


Step 2 - Approaches for Defining Global Market Size (Value, Volume* & Price*)

Note*: In applicable scenarios
Step 3 - Data Sources
Primary Research
- Web Analytics
- Survey Reports
- Research Institute
- Latest Research Reports
- Opinion Leaders
Secondary Research
- Annual Reports
- White Paper
- Latest Press Release
- Industry Association
- Paid Database
- Investor Presentations

Step 4 - Data Triangulation
Involves using different sources of information in order to increase the validity of a study
These sources are likely to be stakeholders in a program - participants, other researchers, program staff, other community members, and so on.
Then we put all data in single framework & apply various statistical tools to find out the dynamic on the market.
During the analysis stage, feedback from the stakeholder groups would be compared to determine areas of agreement as well as areas of divergence


