
Key Insights
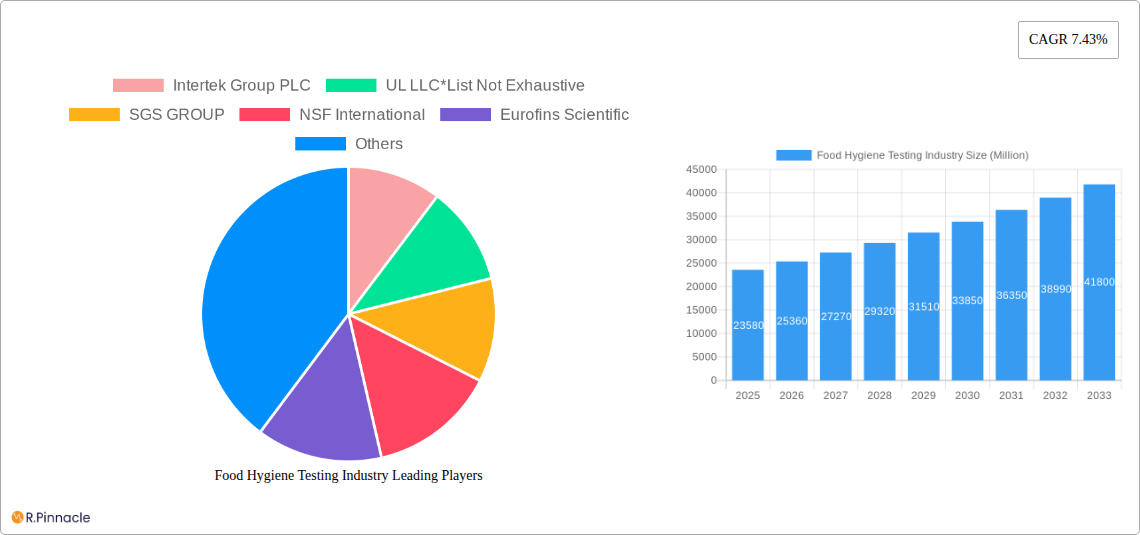
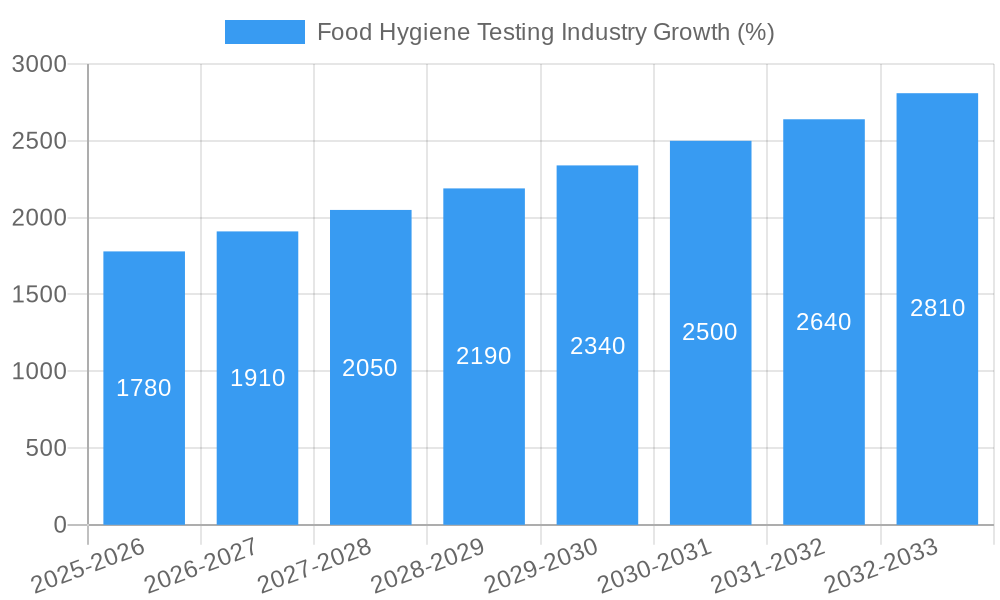
The global food hygiene testing market, valued at $23.58 billion in 2025, is projected to experience robust growth, driven by increasing consumer awareness of food safety, stringent government regulations, and the rising prevalence of foodborne illnesses. The market's Compound Annual Growth Rate (CAGR) of 7.43% from 2025 to 2033 signifies a considerable expansion, particularly fueled by the escalating demand for safe and high-quality food products across various sectors. Key drivers include the expanding processed food industry, particularly within segments like baby food and snack foods, where hygiene testing is paramount. Furthermore, advancements in testing technologies such as Polymerase Chain Reaction (PCR) and sophisticated chromatography techniques are enhancing the accuracy and speed of contaminant detection, fostering market growth. The increasing adoption of these advanced technologies is also driving the market, while factors such as the high cost of advanced testing methodologies and the need for skilled personnel may pose challenges to market expansion. Growth is expected to be particularly strong in developing economies in Asia-Pacific and South America, where food safety infrastructure is rapidly improving and consumer demand for safer food is rising.
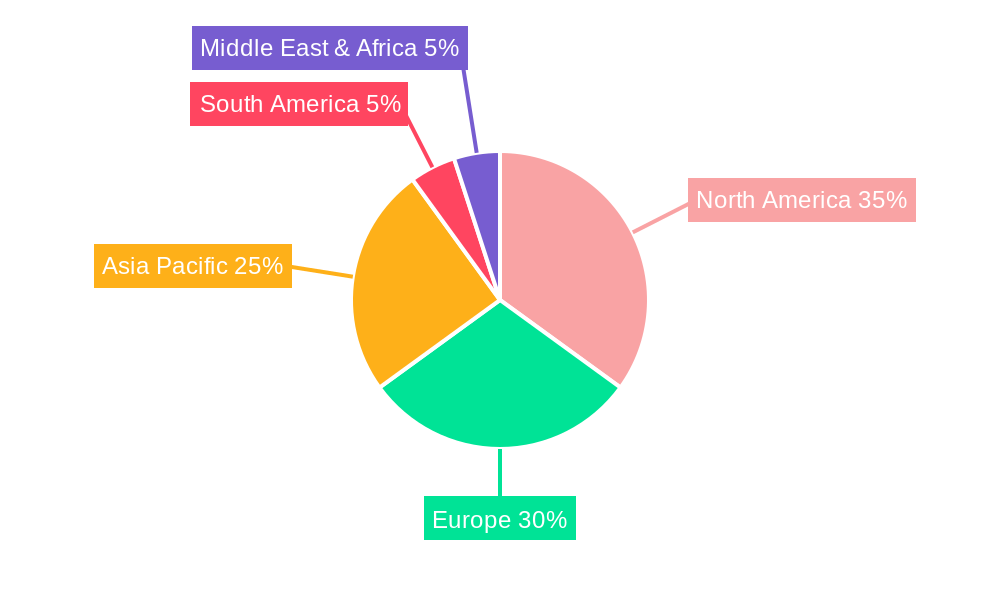
The market segmentation reveals significant opportunities across various testing types, including pathogen, pesticide residue, mycotoxin, GMO, and allergen testing. The application of these tests spans the food and animal feed sectors, with the food sector being the primary driver, encompassing diverse segments like processed food, bakery products, and dietary supplements. Leading players like Intertek, UL, SGS, and Eurofins are shaping the market landscape through their comprehensive testing services and global reach. Geographic variations in regulations and market maturity will influence regional growth patterns, with North America and Europe expected to maintain significant market shares, while Asia-Pacific demonstrates considerable potential for future expansion due to its growing middle class and increasing food consumption. The market's future trajectory hinges on continued advancements in testing technologies, the enforcement of stricter food safety regulations, and evolving consumer preferences for safe and healthy food.
Food Hygiene Testing Industry Market Report: 2019-2033
This comprehensive report provides an in-depth analysis of the global food hygiene testing industry, projecting a market valued at $XX Million by 2033. The study covers the period from 2019 to 2033, with a base year of 2025 and a forecast period of 2025-2033. It offers invaluable insights for industry professionals, investors, and stakeholders seeking to understand the market dynamics, technological advancements, and future growth prospects within this critical sector. Discover actionable strategies to navigate the evolving landscape of food safety and quality assurance.
Food Hygiene Testing Industry Market Structure & Innovation Trends
The food hygiene testing market is moderately consolidated, with several multinational players dominating the landscape. Key players include Intertek Group PLC, UL LLC, SGS GROUP, NSF International, Eurofins Scientific, Merieux Nutrisciences, ALS Limited, Asurequality Limited, and TÜV SÜD. However, smaller niche players and regional laboratories also contribute significantly. Market share estimations for 2025 indicate that the top 5 players hold approximately 60% of the global market, while the remaining share is divided among numerous competitors. Mergers and acquisitions (M&A) activity has been robust, driving consolidation and expansion. For example, Mérieux NutriSciences' acquisitions of Hortec and Aralab in 2022 demonstrate a strategic move to enhance geographical reach and service offerings. The total value of M&A deals within the industry during 2019-2024 was estimated at $XX Million. Innovation is driven by the increasing demand for rapid and accurate testing methods, stringent regulatory requirements, and growing consumer awareness of food safety. The regulatory framework varies across regions, influencing the demand for specific testing services and technologies. Product substitutes are limited, as accurate and reliable testing is crucial for ensuring food safety and compliance.
Food Hygiene Testing Industry Market Dynamics & Trends
The food hygiene testing market is experiencing substantial growth, driven by several factors. Rising consumer awareness of foodborne illnesses, stricter government regulations, and globalization of food supply chains are key contributors. The market is projected to register a Compound Annual Growth Rate (CAGR) of XX% during the forecast period (2025-2033). Technological advancements, such as the widespread adoption of PCR and immunoassay-based technologies, are significantly enhancing testing speed, accuracy, and efficiency. The market penetration of advanced technologies is steadily increasing, with a projected XX% market share by 2033. Consumer preferences are increasingly shifting towards safer and healthier food products, leading to higher demand for thorough testing. The competitive landscape is characterized by intense rivalry among established players and the emergence of innovative startups. This rivalry is driving the development of new technologies and services, benefiting consumers and maintaining stringent food safety standards.
Dominant Regions & Segments in Food Hygiene Testing Industry
Leading Region: North America currently holds the largest market share, driven by stringent regulations, high consumer awareness, and a well-established food processing industry. Europe follows closely, with a significant market driven by similar factors. Asia-Pacific is experiencing rapid growth due to increasing economic development and rising food consumption.
Leading Segments:
- Contaminant Testing: Pathogen testing holds the largest segment share due to the significant health risks associated with pathogenic contamination. Pesticide residue testing is also a significant segment, driven by growing consumer concerns regarding pesticide exposure.
- Technology: Polymerase Chain Reaction (PCR) technology dominates due to its speed, accuracy, and sensitivity. Chromatography and spectrometry techniques are also widely used.
- Application: The food segment dominates, followed by processed food (baby food, bakery products, snacks, etc.) and animal feed.
Key drivers for these dominant regions and segments include robust economies, stringent regulatory landscapes, and strong consumer demand for food safety and quality assurance. In contrast, developing regions present both challenges (lack of infrastructure, lower awareness) and opportunities (rapid growth of food processing industries).
Food Hygiene Testing Industry Product Innovations
Recent product innovations focus on rapid, portable, and high-throughput testing technologies. Miniaturized devices and point-of-care testing systems are gaining traction. Companies are developing advanced software and data analytics to improve data management and interpretation. These advancements enhance speed, accuracy, and efficiency, allowing for quicker decision-making and improved food safety across the supply chain. The market fit is excellent, addressing the industry’s need for faster, more convenient, and cost-effective testing solutions.
Report Scope & Segmentation Analysis
This report segments the market by contaminant type (pathogen, pesticide residue, mycotoxin, GMO, allergen, other), technology (PCR, immunoassay, chromatography & spectrometry, other), and application (animal feed, food, processed food - including baby food, bakery products, snacks, and dietary supplements). Each segment's growth projection, market size, and competitive landscape are analyzed in detail, revealing the current and future market dynamics and offering valuable insights for strategic decision-making. For instance, the pathogen testing segment is expected to show the highest CAGR due to increasing regulatory pressure and rising health consciousness.
Key Drivers of Food Hygiene Testing Industry Growth
The food hygiene testing market is propelled by several key factors. Stricter government regulations regarding food safety and quality standards are pushing businesses to adopt more rigorous testing protocols. The rising incidence of foodborne illnesses necessitates enhanced hygiene and testing. Technological advancements, particularly in rapid and automated testing methods, drive cost reductions and increased efficiency. Growing consumer awareness of food safety and associated health risks is also driving demand for comprehensive testing services.
Challenges in the Food Hygiene Testing Industry Sector
Challenges include high testing costs, especially for advanced technologies. Maintaining consistent quality control across diverse testing facilities and geographical locations is also complex. The need for skilled personnel and ongoing training can also hinder growth. Finally, the industry faces competitive pressures from numerous players of varying sizes and capabilities.
Emerging Opportunities in Food Hygiene Testing Industry
Emerging opportunities lie in developing affordable and accessible testing solutions for small-scale food producers, particularly in developing countries. Advanced technologies like blockchain and AI can enhance traceability and transparency in the food supply chain. Developing standardized testing methods and expanding collaborations across sectors will contribute to a more robust and reliable food safety system.
Leading Players in the Food Hygiene Testing Industry Market
- Intertek Group PLC
- UL LLC
- SGS GROUP
- NSF International
- Eurofins Scientific
- Merieux Nutrisciences
- ALS Limited
- Asurequality Limited
- TÜV SÜD
Key Developments in Food Hygiene Testing Industry
- July 2022: SGS launched a new food analysis laboratory in Naucalpan, Mexico, enhancing testing capabilities in the region and supporting regulatory compliance.
- May 2022: Bureau Veritas opened its third US microbiology laboratory in Reno, Nevada, increasing rapid pathogen testing capacity for the agri-food sector.
- April 2022: Mérieux NutriSciences acquired Hortec Pty Ltd (South Africa) and Laboratorios Bromatológicos Araba SA (Spain), expanding its geographic reach and service offerings, particularly in pesticide testing.
Future Outlook for Food Hygiene Testing Industry Market
The future of the food hygiene testing industry looks bright, driven by continuous technological advancements, increasing regulatory stringency, and growing consumer demand for safe and high-quality food. The market is expected to experience significant growth in the coming years, driven by factors such as the rising adoption of advanced technologies, increasing investments in R&D, and the expansion of the global food supply chain. Companies that adapt to these trends by investing in innovation and expanding their service portfolios will be best positioned for success in this dynamic market.
Food Hygiene Testing Industry Segmentation
-
1. Contaminant Testing
- 1.1. Pathogen Testing
- 1.2. Pesticide and Residue Testing
- 1.3. Mycotoxin Testing
- 1.4. GMO Testing
- 1.5. Allergen Testing
- 1.6. Other Contaminant Testing
-
2. Technology
- 2.1. Polymerase Chain Reaction (PCR)
- 2.2. Immunoassay-based
-
2.3. Chromatography and Spectrometry
- 2.3.1. HPLC Based
- 2.3.2. LC-MS/MS-Based
- 2.3.3. Other Chromatography and Spectrometry
- 2.4. Other Technologies
-
3. Application
- 3.1. Animal Feed and Pet Food
- 3.2. Meat and Poultry
- 3.3. Dairy
- 3.4. Fruits and Vegetables
-
3.5. Processed Food
- 3.5.1. Baby Food
- 3.5.2. Bakery Products
- 3.5.3. Savory and Sweet Snacks
- 3.5.4. Dietary Supplements
- 3.6. Crops
- 3.7. Other Foods
Food Hygiene Testing Industry Segmentation By Geography
-
1. North America
- 1.1. United States
- 1.2. Canada
- 1.3. Mexico
- 1.4. Rest of North America
-
2. Europe
- 2.1. United Kingdom
- 2.2. Germany
- 2.3. France
- 2.4. Russia
- 2.5. Italy
- 2.6. Spain
- 2.7. Rest of Europe
-
3. Asia Pacific
- 3.1. India
- 3.2. China
- 3.3. Japan
- 3.4. Australia
- 3.5. Rest of Asia Pacific
-
4. South America
- 4.1. Brazil
- 4.2. Argentina
- 4.3. Rest of South America
- 5. Middle East
-
6. South Africa
- 6.1. Saudi Arabia
- 6.2. Rest of Middle East
Food Hygiene Testing Industry REPORT HIGHLIGHTS
| Aspects | Details |
|---|---|
| Study Period | 2019-2033 |
| Base Year | 2024 |
| Estimated Year | 2025 |
| Forecast Period | 2025-2033 |
| Historical Period | 2019-2024 |
| Growth Rate | CAGR of 7.43% from 2019-2033 |
| Segmentation |
|
Table of Contents
- 1. Introduction
- 1.1. Research Scope
- 1.2. Market Segmentation
- 1.3. Research Methodology
- 1.4. Definitions and Assumptions
- 2. Executive Summary
- 2.1. Introduction
- 3. Market Dynamics
- 3.1. Introduction
- 3.2. Market Drivers
- 3.2.1. Growing Demand for Convenience and Processed Foods Drives Demand; Expanding Cosmetic and Personal Care Industries Utilize Gelatin for Various Purposes
- 3.3. Market Restrains
- 3.3.1. Fluctuations in Raw Material Proces Affecting Production Costs
- 3.4. Market Trends
- 3.4.1. Growing Consumer Interest in Food Safety and Quality
- 4. Market Factor Analysis
- 4.1. Porters Five Forces
- 4.2. Supply/Value Chain
- 4.3. PESTEL analysis
- 4.4. Market Entropy
- 4.5. Patent/Trademark Analysis
- 5. Global Food Hygiene Testing Industry Analysis, Insights and Forecast, 2019-2031
- 5.1. Market Analysis, Insights and Forecast - by Contaminant Testing
- 5.1.1. Pathogen Testing
- 5.1.2. Pesticide and Residue Testing
- 5.1.3. Mycotoxin Testing
- 5.1.4. GMO Testing
- 5.1.5. Allergen Testing
- 5.1.6. Other Contaminant Testing
- 5.2. Market Analysis, Insights and Forecast - by Technology
- 5.2.1. Polymerase Chain Reaction (PCR)
- 5.2.2. Immunoassay-based
- 5.2.3. Chromatography and Spectrometry
- 5.2.3.1. HPLC Based
- 5.2.3.2. LC-MS/MS-Based
- 5.2.3.3. Other Chromatography and Spectrometry
- 5.2.4. Other Technologies
- 5.3. Market Analysis, Insights and Forecast - by Application
- 5.3.1. Animal Feed and Pet Food
- 5.3.2. Meat and Poultry
- 5.3.3. Dairy
- 5.3.4. Fruits and Vegetables
- 5.3.5. Processed Food
- 5.3.5.1. Baby Food
- 5.3.5.2. Bakery Products
- 5.3.5.3. Savory and Sweet Snacks
- 5.3.5.4. Dietary Supplements
- 5.3.6. Crops
- 5.3.7. Other Foods
- 5.4. Market Analysis, Insights and Forecast - by Region
- 5.4.1. North America
- 5.4.2. Europe
- 5.4.3. Asia Pacific
- 5.4.4. South America
- 5.4.5. Middle East
- 5.4.6. South Africa
- 5.1. Market Analysis, Insights and Forecast - by Contaminant Testing
- 6. North America Food Hygiene Testing Industry Analysis, Insights and Forecast, 2019-2031
- 6.1. Market Analysis, Insights and Forecast - by Contaminant Testing
- 6.1.1. Pathogen Testing
- 6.1.2. Pesticide and Residue Testing
- 6.1.3. Mycotoxin Testing
- 6.1.4. GMO Testing
- 6.1.5. Allergen Testing
- 6.1.6. Other Contaminant Testing
- 6.2. Market Analysis, Insights and Forecast - by Technology
- 6.2.1. Polymerase Chain Reaction (PCR)
- 6.2.2. Immunoassay-based
- 6.2.3. Chromatography and Spectrometry
- 6.2.3.1. HPLC Based
- 6.2.3.2. LC-MS/MS-Based
- 6.2.3.3. Other Chromatography and Spectrometry
- 6.2.4. Other Technologies
- 6.3. Market Analysis, Insights and Forecast - by Application
- 6.3.1. Animal Feed and Pet Food
- 6.3.2. Meat and Poultry
- 6.3.3. Dairy
- 6.3.4. Fruits and Vegetables
- 6.3.5. Processed Food
- 6.3.5.1. Baby Food
- 6.3.5.2. Bakery Products
- 6.3.5.3. Savory and Sweet Snacks
- 6.3.5.4. Dietary Supplements
- 6.3.6. Crops
- 6.3.7. Other Foods
- 6.1. Market Analysis, Insights and Forecast - by Contaminant Testing
- 7. Europe Food Hygiene Testing Industry Analysis, Insights and Forecast, 2019-2031
- 7.1. Market Analysis, Insights and Forecast - by Contaminant Testing
- 7.1.1. Pathogen Testing
- 7.1.2. Pesticide and Residue Testing
- 7.1.3. Mycotoxin Testing
- 7.1.4. GMO Testing
- 7.1.5. Allergen Testing
- 7.1.6. Other Contaminant Testing
- 7.2. Market Analysis, Insights and Forecast - by Technology
- 7.2.1. Polymerase Chain Reaction (PCR)
- 7.2.2. Immunoassay-based
- 7.2.3. Chromatography and Spectrometry
- 7.2.3.1. HPLC Based
- 7.2.3.2. LC-MS/MS-Based
- 7.2.3.3. Other Chromatography and Spectrometry
- 7.2.4. Other Technologies
- 7.3. Market Analysis, Insights and Forecast - by Application
- 7.3.1. Animal Feed and Pet Food
- 7.3.2. Meat and Poultry
- 7.3.3. Dairy
- 7.3.4. Fruits and Vegetables
- 7.3.5. Processed Food
- 7.3.5.1. Baby Food
- 7.3.5.2. Bakery Products
- 7.3.5.3. Savory and Sweet Snacks
- 7.3.5.4. Dietary Supplements
- 7.3.6. Crops
- 7.3.7. Other Foods
- 7.1. Market Analysis, Insights and Forecast - by Contaminant Testing
- 8. Asia Pacific Food Hygiene Testing Industry Analysis, Insights and Forecast, 2019-2031
- 8.1. Market Analysis, Insights and Forecast - by Contaminant Testing
- 8.1.1. Pathogen Testing
- 8.1.2. Pesticide and Residue Testing
- 8.1.3. Mycotoxin Testing
- 8.1.4. GMO Testing
- 8.1.5. Allergen Testing
- 8.1.6. Other Contaminant Testing
- 8.2. Market Analysis, Insights and Forecast - by Technology
- 8.2.1. Polymerase Chain Reaction (PCR)
- 8.2.2. Immunoassay-based
- 8.2.3. Chromatography and Spectrometry
- 8.2.3.1. HPLC Based
- 8.2.3.2. LC-MS/MS-Based
- 8.2.3.3. Other Chromatography and Spectrometry
- 8.2.4. Other Technologies
- 8.3. Market Analysis, Insights and Forecast - by Application
- 8.3.1. Animal Feed and Pet Food
- 8.3.2. Meat and Poultry
- 8.3.3. Dairy
- 8.3.4. Fruits and Vegetables
- 8.3.5. Processed Food
- 8.3.5.1. Baby Food
- 8.3.5.2. Bakery Products
- 8.3.5.3. Savory and Sweet Snacks
- 8.3.5.4. Dietary Supplements
- 8.3.6. Crops
- 8.3.7. Other Foods
- 8.1. Market Analysis, Insights and Forecast - by Contaminant Testing
- 9. South America Food Hygiene Testing Industry Analysis, Insights and Forecast, 2019-2031
- 9.1. Market Analysis, Insights and Forecast - by Contaminant Testing
- 9.1.1. Pathogen Testing
- 9.1.2. Pesticide and Residue Testing
- 9.1.3. Mycotoxin Testing
- 9.1.4. GMO Testing
- 9.1.5. Allergen Testing
- 9.1.6. Other Contaminant Testing
- 9.2. Market Analysis, Insights and Forecast - by Technology
- 9.2.1. Polymerase Chain Reaction (PCR)
- 9.2.2. Immunoassay-based
- 9.2.3. Chromatography and Spectrometry
- 9.2.3.1. HPLC Based
- 9.2.3.2. LC-MS/MS-Based
- 9.2.3.3. Other Chromatography and Spectrometry
- 9.2.4. Other Technologies
- 9.3. Market Analysis, Insights and Forecast - by Application
- 9.3.1. Animal Feed and Pet Food
- 9.3.2. Meat and Poultry
- 9.3.3. Dairy
- 9.3.4. Fruits and Vegetables
- 9.3.5. Processed Food
- 9.3.5.1. Baby Food
- 9.3.5.2. Bakery Products
- 9.3.5.3. Savory and Sweet Snacks
- 9.3.5.4. Dietary Supplements
- 9.3.6. Crops
- 9.3.7. Other Foods
- 9.1. Market Analysis, Insights and Forecast - by Contaminant Testing
- 10. Middle East Food Hygiene Testing Industry Analysis, Insights and Forecast, 2019-2031
- 10.1. Market Analysis, Insights and Forecast - by Contaminant Testing
- 10.1.1. Pathogen Testing
- 10.1.2. Pesticide and Residue Testing
- 10.1.3. Mycotoxin Testing
- 10.1.4. GMO Testing
- 10.1.5. Allergen Testing
- 10.1.6. Other Contaminant Testing
- 10.2. Market Analysis, Insights and Forecast - by Technology
- 10.2.1. Polymerase Chain Reaction (PCR)
- 10.2.2. Immunoassay-based
- 10.2.3. Chromatography and Spectrometry
- 10.2.3.1. HPLC Based
- 10.2.3.2. LC-MS/MS-Based
- 10.2.3.3. Other Chromatography and Spectrometry
- 10.2.4. Other Technologies
- 10.3. Market Analysis, Insights and Forecast - by Application
- 10.3.1. Animal Feed and Pet Food
- 10.3.2. Meat and Poultry
- 10.3.3. Dairy
- 10.3.4. Fruits and Vegetables
- 10.3.5. Processed Food
- 10.3.5.1. Baby Food
- 10.3.5.2. Bakery Products
- 10.3.5.3. Savory and Sweet Snacks
- 10.3.5.4. Dietary Supplements
- 10.3.6. Crops
- 10.3.7. Other Foods
- 10.1. Market Analysis, Insights and Forecast - by Contaminant Testing
- 11. South Africa Food Hygiene Testing Industry Analysis, Insights and Forecast, 2019-2031
- 11.1. Market Analysis, Insights and Forecast - by Contaminant Testing
- 11.1.1. Pathogen Testing
- 11.1.2. Pesticide and Residue Testing
- 11.1.3. Mycotoxin Testing
- 11.1.4. GMO Testing
- 11.1.5. Allergen Testing
- 11.1.6. Other Contaminant Testing
- 11.2. Market Analysis, Insights and Forecast - by Technology
- 11.2.1. Polymerase Chain Reaction (PCR)
- 11.2.2. Immunoassay-based
- 11.2.3. Chromatography and Spectrometry
- 11.2.3.1. HPLC Based
- 11.2.3.2. LC-MS/MS-Based
- 11.2.3.3. Other Chromatography and Spectrometry
- 11.2.4. Other Technologies
- 11.3. Market Analysis, Insights and Forecast - by Application
- 11.3.1. Animal Feed and Pet Food
- 11.3.2. Meat and Poultry
- 11.3.3. Dairy
- 11.3.4. Fruits and Vegetables
- 11.3.5. Processed Food
- 11.3.5.1. Baby Food
- 11.3.5.2. Bakery Products
- 11.3.5.3. Savory and Sweet Snacks
- 11.3.5.4. Dietary Supplements
- 11.3.6. Crops
- 11.3.7. Other Foods
- 11.1. Market Analysis, Insights and Forecast - by Contaminant Testing
- 12. North America Food Hygiene Testing Industry Analysis, Insights and Forecast, 2019-2031
- 12.1. Market Analysis, Insights and Forecast - By Country/Sub-region
- 12.1.1 United States
- 12.1.2 Canada
- 12.1.3 Mexico
- 12.1.4 Rest of North America
- 13. Europe Food Hygiene Testing Industry Analysis, Insights and Forecast, 2019-2031
- 13.1. Market Analysis, Insights and Forecast - By Country/Sub-region
- 13.1.1 United Kingdom
- 13.1.2 Germany
- 13.1.3 France
- 13.1.4 Russia
- 13.1.5 Italy
- 13.1.6 Spain
- 13.1.7 Rest of Europe
- 14. Asia Pacific Food Hygiene Testing Industry Analysis, Insights and Forecast, 2019-2031
- 14.1. Market Analysis, Insights and Forecast - By Country/Sub-region
- 14.1.1 India
- 14.1.2 China
- 14.1.3 Japan
- 14.1.4 Australia
- 14.1.5 Rest of Asia Pacific
- 15. South America Food Hygiene Testing Industry Analysis, Insights and Forecast, 2019-2031
- 15.1. Market Analysis, Insights and Forecast - By Country/Sub-region
- 15.1.1 Brazil
- 15.1.2 Argentina
- 15.1.3 Rest of South America
- 16. Middle East & Africa Food Hygiene Testing Industry Analysis, Insights and Forecast, 2019-2031
- 16.1. Market Analysis, Insights and Forecast - By Country/Sub-region
- 16.1.1 UAE
- 16.1.2 South Africa
- 16.1.3 Saudi Arabia
- 16.1.4 Rest of MEA
- 17. Competitive Analysis
- 17.1. Global Market Share Analysis 2024
- 17.2. Company Profiles
- 17.2.1 Intertek Group PLC
- 17.2.1.1. Overview
- 17.2.1.2. Products
- 17.2.1.3. SWOT Analysis
- 17.2.1.4. Recent Developments
- 17.2.1.5. Financials (Based on Availability)
- 17.2.2 UL LLC*List Not Exhaustive
- 17.2.2.1. Overview
- 17.2.2.2. Products
- 17.2.2.3. SWOT Analysis
- 17.2.2.4. Recent Developments
- 17.2.2.5. Financials (Based on Availability)
- 17.2.3 SGS GROUP
- 17.2.3.1. Overview
- 17.2.3.2. Products
- 17.2.3.3. SWOT Analysis
- 17.2.3.4. Recent Developments
- 17.2.3.5. Financials (Based on Availability)
- 17.2.4 NSF International
- 17.2.4.1. Overview
- 17.2.4.2. Products
- 17.2.4.3. SWOT Analysis
- 17.2.4.4. Recent Developments
- 17.2.4.5. Financials (Based on Availability)
- 17.2.5 Eurofins Scientific
- 17.2.5.1. Overview
- 17.2.5.2. Products
- 17.2.5.3. SWOT Analysis
- 17.2.5.4. Recent Developments
- 17.2.5.5. Financials (Based on Availability)
- 17.2.6 Merieux Nutrisciences
- 17.2.6.1. Overview
- 17.2.6.2. Products
- 17.2.6.3. SWOT Analysis
- 17.2.6.4. Recent Developments
- 17.2.6.5. Financials (Based on Availability)
- 17.2.7 ALS Limited
- 17.2.7.1. Overview
- 17.2.7.2. Products
- 17.2.7.3. SWOT Analysis
- 17.2.7.4. Recent Developments
- 17.2.7.5. Financials (Based on Availability)
- 17.2.8 Asurequality Limited
- 17.2.8.1. Overview
- 17.2.8.2. Products
- 17.2.8.3. SWOT Analysis
- 17.2.8.4. Recent Developments
- 17.2.8.5. Financials (Based on Availability)
- 17.2.9 TUV SUD
- 17.2.9.1. Overview
- 17.2.9.2. Products
- 17.2.9.3. SWOT Analysis
- 17.2.9.4. Recent Developments
- 17.2.9.5. Financials (Based on Availability)
- 17.2.1 Intertek Group PLC
List of Figures
- Figure 1: Global Food Hygiene Testing Industry Revenue Breakdown (Million, %) by Region 2024 & 2032
- Figure 2: North America Food Hygiene Testing Industry Revenue (Million), by Country 2024 & 2032
- Figure 3: North America Food Hygiene Testing Industry Revenue Share (%), by Country 2024 & 2032
- Figure 4: Europe Food Hygiene Testing Industry Revenue (Million), by Country 2024 & 2032
- Figure 5: Europe Food Hygiene Testing Industry Revenue Share (%), by Country 2024 & 2032
- Figure 6: Asia Pacific Food Hygiene Testing Industry Revenue (Million), by Country 2024 & 2032
- Figure 7: Asia Pacific Food Hygiene Testing Industry Revenue Share (%), by Country 2024 & 2032
- Figure 8: South America Food Hygiene Testing Industry Revenue (Million), by Country 2024 & 2032
- Figure 9: South America Food Hygiene Testing Industry Revenue Share (%), by Country 2024 & 2032
- Figure 10: Middle East & Africa Food Hygiene Testing Industry Revenue (Million), by Country 2024 & 2032
- Figure 11: Middle East & Africa Food Hygiene Testing Industry Revenue Share (%), by Country 2024 & 2032
- Figure 12: North America Food Hygiene Testing Industry Revenue (Million), by Contaminant Testing 2024 & 2032
- Figure 13: North America Food Hygiene Testing Industry Revenue Share (%), by Contaminant Testing 2024 & 2032
- Figure 14: North America Food Hygiene Testing Industry Revenue (Million), by Technology 2024 & 2032
- Figure 15: North America Food Hygiene Testing Industry Revenue Share (%), by Technology 2024 & 2032
- Figure 16: North America Food Hygiene Testing Industry Revenue (Million), by Application 2024 & 2032
- Figure 17: North America Food Hygiene Testing Industry Revenue Share (%), by Application 2024 & 2032
- Figure 18: North America Food Hygiene Testing Industry Revenue (Million), by Country 2024 & 2032
- Figure 19: North America Food Hygiene Testing Industry Revenue Share (%), by Country 2024 & 2032
- Figure 20: Europe Food Hygiene Testing Industry Revenue (Million), by Contaminant Testing 2024 & 2032
- Figure 21: Europe Food Hygiene Testing Industry Revenue Share (%), by Contaminant Testing 2024 & 2032
- Figure 22: Europe Food Hygiene Testing Industry Revenue (Million), by Technology 2024 & 2032
- Figure 23: Europe Food Hygiene Testing Industry Revenue Share (%), by Technology 2024 & 2032
- Figure 24: Europe Food Hygiene Testing Industry Revenue (Million), by Application 2024 & 2032
- Figure 25: Europe Food Hygiene Testing Industry Revenue Share (%), by Application 2024 & 2032
- Figure 26: Europe Food Hygiene Testing Industry Revenue (Million), by Country 2024 & 2032
- Figure 27: Europe Food Hygiene Testing Industry Revenue Share (%), by Country 2024 & 2032
- Figure 28: Asia Pacific Food Hygiene Testing Industry Revenue (Million), by Contaminant Testing 2024 & 2032
- Figure 29: Asia Pacific Food Hygiene Testing Industry Revenue Share (%), by Contaminant Testing 2024 & 2032
- Figure 30: Asia Pacific Food Hygiene Testing Industry Revenue (Million), by Technology 2024 & 2032
- Figure 31: Asia Pacific Food Hygiene Testing Industry Revenue Share (%), by Technology 2024 & 2032
- Figure 32: Asia Pacific Food Hygiene Testing Industry Revenue (Million), by Application 2024 & 2032
- Figure 33: Asia Pacific Food Hygiene Testing Industry Revenue Share (%), by Application 2024 & 2032
- Figure 34: Asia Pacific Food Hygiene Testing Industry Revenue (Million), by Country 2024 & 2032
- Figure 35: Asia Pacific Food Hygiene Testing Industry Revenue Share (%), by Country 2024 & 2032
- Figure 36: South America Food Hygiene Testing Industry Revenue (Million), by Contaminant Testing 2024 & 2032
- Figure 37: South America Food Hygiene Testing Industry Revenue Share (%), by Contaminant Testing 2024 & 2032
- Figure 38: South America Food Hygiene Testing Industry Revenue (Million), by Technology 2024 & 2032
- Figure 39: South America Food Hygiene Testing Industry Revenue Share (%), by Technology 2024 & 2032
- Figure 40: South America Food Hygiene Testing Industry Revenue (Million), by Application 2024 & 2032
- Figure 41: South America Food Hygiene Testing Industry Revenue Share (%), by Application 2024 & 2032
- Figure 42: South America Food Hygiene Testing Industry Revenue (Million), by Country 2024 & 2032
- Figure 43: South America Food Hygiene Testing Industry Revenue Share (%), by Country 2024 & 2032
- Figure 44: Middle East Food Hygiene Testing Industry Revenue (Million), by Contaminant Testing 2024 & 2032
- Figure 45: Middle East Food Hygiene Testing Industry Revenue Share (%), by Contaminant Testing 2024 & 2032
- Figure 46: Middle East Food Hygiene Testing Industry Revenue (Million), by Technology 2024 & 2032
- Figure 47: Middle East Food Hygiene Testing Industry Revenue Share (%), by Technology 2024 & 2032
- Figure 48: Middle East Food Hygiene Testing Industry Revenue (Million), by Application 2024 & 2032
- Figure 49: Middle East Food Hygiene Testing Industry Revenue Share (%), by Application 2024 & 2032
- Figure 50: Middle East Food Hygiene Testing Industry Revenue (Million), by Country 2024 & 2032
- Figure 51: Middle East Food Hygiene Testing Industry Revenue Share (%), by Country 2024 & 2032
- Figure 52: South Africa Food Hygiene Testing Industry Revenue (Million), by Contaminant Testing 2024 & 2032
- Figure 53: South Africa Food Hygiene Testing Industry Revenue Share (%), by Contaminant Testing 2024 & 2032
- Figure 54: South Africa Food Hygiene Testing Industry Revenue (Million), by Technology 2024 & 2032
- Figure 55: South Africa Food Hygiene Testing Industry Revenue Share (%), by Technology 2024 & 2032
- Figure 56: South Africa Food Hygiene Testing Industry Revenue (Million), by Application 2024 & 2032
- Figure 57: South Africa Food Hygiene Testing Industry Revenue Share (%), by Application 2024 & 2032
- Figure 58: South Africa Food Hygiene Testing Industry Revenue (Million), by Country 2024 & 2032
- Figure 59: South Africa Food Hygiene Testing Industry Revenue Share (%), by Country 2024 & 2032
List of Tables
- Table 1: Global Food Hygiene Testing Industry Revenue Million Forecast, by Region 2019 & 2032
- Table 2: Global Food Hygiene Testing Industry Revenue Million Forecast, by Contaminant Testing 2019 & 2032
- Table 3: Global Food Hygiene Testing Industry Revenue Million Forecast, by Technology 2019 & 2032
- Table 4: Global Food Hygiene Testing Industry Revenue Million Forecast, by Application 2019 & 2032
- Table 5: Global Food Hygiene Testing Industry Revenue Million Forecast, by Region 2019 & 2032
- Table 6: Global Food Hygiene Testing Industry Revenue Million Forecast, by Country 2019 & 2032
- Table 7: United States Food Hygiene Testing Industry Revenue (Million) Forecast, by Application 2019 & 2032
- Table 8: Canada Food Hygiene Testing Industry Revenue (Million) Forecast, by Application 2019 & 2032
- Table 9: Mexico Food Hygiene Testing Industry Revenue (Million) Forecast, by Application 2019 & 2032
- Table 10: Rest of North America Food Hygiene Testing Industry Revenue (Million) Forecast, by Application 2019 & 2032
- Table 11: Global Food Hygiene Testing Industry Revenue Million Forecast, by Country 2019 & 2032
- Table 12: United Kingdom Food Hygiene Testing Industry Revenue (Million) Forecast, by Application 2019 & 2032
- Table 13: Germany Food Hygiene Testing Industry Revenue (Million) Forecast, by Application 2019 & 2032
- Table 14: France Food Hygiene Testing Industry Revenue (Million) Forecast, by Application 2019 & 2032
- Table 15: Russia Food Hygiene Testing Industry Revenue (Million) Forecast, by Application 2019 & 2032
- Table 16: Italy Food Hygiene Testing Industry Revenue (Million) Forecast, by Application 2019 & 2032
- Table 17: Spain Food Hygiene Testing Industry Revenue (Million) Forecast, by Application 2019 & 2032
- Table 18: Rest of Europe Food Hygiene Testing Industry Revenue (Million) Forecast, by Application 2019 & 2032
- Table 19: Global Food Hygiene Testing Industry Revenue Million Forecast, by Country 2019 & 2032
- Table 20: India Food Hygiene Testing Industry Revenue (Million) Forecast, by Application 2019 & 2032
- Table 21: China Food Hygiene Testing Industry Revenue (Million) Forecast, by Application 2019 & 2032
- Table 22: Japan Food Hygiene Testing Industry Revenue (Million) Forecast, by Application 2019 & 2032
- Table 23: Australia Food Hygiene Testing Industry Revenue (Million) Forecast, by Application 2019 & 2032
- Table 24: Rest of Asia Pacific Food Hygiene Testing Industry Revenue (Million) Forecast, by Application 2019 & 2032
- Table 25: Global Food Hygiene Testing Industry Revenue Million Forecast, by Country 2019 & 2032
- Table 26: Brazil Food Hygiene Testing Industry Revenue (Million) Forecast, by Application 2019 & 2032
- Table 27: Argentina Food Hygiene Testing Industry Revenue (Million) Forecast, by Application 2019 & 2032
- Table 28: Rest of South America Food Hygiene Testing Industry Revenue (Million) Forecast, by Application 2019 & 2032
- Table 29: Global Food Hygiene Testing Industry Revenue Million Forecast, by Country 2019 & 2032
- Table 30: UAE Food Hygiene Testing Industry Revenue (Million) Forecast, by Application 2019 & 2032
- Table 31: South Africa Food Hygiene Testing Industry Revenue (Million) Forecast, by Application 2019 & 2032
- Table 32: Saudi Arabia Food Hygiene Testing Industry Revenue (Million) Forecast, by Application 2019 & 2032
- Table 33: Rest of MEA Food Hygiene Testing Industry Revenue (Million) Forecast, by Application 2019 & 2032
- Table 34: Global Food Hygiene Testing Industry Revenue Million Forecast, by Contaminant Testing 2019 & 2032
- Table 35: Global Food Hygiene Testing Industry Revenue Million Forecast, by Technology 2019 & 2032
- Table 36: Global Food Hygiene Testing Industry Revenue Million Forecast, by Application 2019 & 2032
- Table 37: Global Food Hygiene Testing Industry Revenue Million Forecast, by Country 2019 & 2032
- Table 38: United States Food Hygiene Testing Industry Revenue (Million) Forecast, by Application 2019 & 2032
- Table 39: Canada Food Hygiene Testing Industry Revenue (Million) Forecast, by Application 2019 & 2032
- Table 40: Mexico Food Hygiene Testing Industry Revenue (Million) Forecast, by Application 2019 & 2032
- Table 41: Rest of North America Food Hygiene Testing Industry Revenue (Million) Forecast, by Application 2019 & 2032
- Table 42: Global Food Hygiene Testing Industry Revenue Million Forecast, by Contaminant Testing 2019 & 2032
- Table 43: Global Food Hygiene Testing Industry Revenue Million Forecast, by Technology 2019 & 2032
- Table 44: Global Food Hygiene Testing Industry Revenue Million Forecast, by Application 2019 & 2032
- Table 45: Global Food Hygiene Testing Industry Revenue Million Forecast, by Country 2019 & 2032
- Table 46: United Kingdom Food Hygiene Testing Industry Revenue (Million) Forecast, by Application 2019 & 2032
- Table 47: Germany Food Hygiene Testing Industry Revenue (Million) Forecast, by Application 2019 & 2032
- Table 48: France Food Hygiene Testing Industry Revenue (Million) Forecast, by Application 2019 & 2032
- Table 49: Russia Food Hygiene Testing Industry Revenue (Million) Forecast, by Application 2019 & 2032
- Table 50: Italy Food Hygiene Testing Industry Revenue (Million) Forecast, by Application 2019 & 2032
- Table 51: Spain Food Hygiene Testing Industry Revenue (Million) Forecast, by Application 2019 & 2032
- Table 52: Rest of Europe Food Hygiene Testing Industry Revenue (Million) Forecast, by Application 2019 & 2032
- Table 53: Global Food Hygiene Testing Industry Revenue Million Forecast, by Contaminant Testing 2019 & 2032
- Table 54: Global Food Hygiene Testing Industry Revenue Million Forecast, by Technology 2019 & 2032
- Table 55: Global Food Hygiene Testing Industry Revenue Million Forecast, by Application 2019 & 2032
- Table 56: Global Food Hygiene Testing Industry Revenue Million Forecast, by Country 2019 & 2032
- Table 57: India Food Hygiene Testing Industry Revenue (Million) Forecast, by Application 2019 & 2032
- Table 58: China Food Hygiene Testing Industry Revenue (Million) Forecast, by Application 2019 & 2032
- Table 59: Japan Food Hygiene Testing Industry Revenue (Million) Forecast, by Application 2019 & 2032
- Table 60: Australia Food Hygiene Testing Industry Revenue (Million) Forecast, by Application 2019 & 2032
- Table 61: Rest of Asia Pacific Food Hygiene Testing Industry Revenue (Million) Forecast, by Application 2019 & 2032
- Table 62: Global Food Hygiene Testing Industry Revenue Million Forecast, by Contaminant Testing 2019 & 2032
- Table 63: Global Food Hygiene Testing Industry Revenue Million Forecast, by Technology 2019 & 2032
- Table 64: Global Food Hygiene Testing Industry Revenue Million Forecast, by Application 2019 & 2032
- Table 65: Global Food Hygiene Testing Industry Revenue Million Forecast, by Country 2019 & 2032
- Table 66: Brazil Food Hygiene Testing Industry Revenue (Million) Forecast, by Application 2019 & 2032
- Table 67: Argentina Food Hygiene Testing Industry Revenue (Million) Forecast, by Application 2019 & 2032
- Table 68: Rest of South America Food Hygiene Testing Industry Revenue (Million) Forecast, by Application 2019 & 2032
- Table 69: Global Food Hygiene Testing Industry Revenue Million Forecast, by Contaminant Testing 2019 & 2032
- Table 70: Global Food Hygiene Testing Industry Revenue Million Forecast, by Technology 2019 & 2032
- Table 71: Global Food Hygiene Testing Industry Revenue Million Forecast, by Application 2019 & 2032
- Table 72: Global Food Hygiene Testing Industry Revenue Million Forecast, by Country 2019 & 2032
- Table 73: Global Food Hygiene Testing Industry Revenue Million Forecast, by Contaminant Testing 2019 & 2032
- Table 74: Global Food Hygiene Testing Industry Revenue Million Forecast, by Technology 2019 & 2032
- Table 75: Global Food Hygiene Testing Industry Revenue Million Forecast, by Application 2019 & 2032
- Table 76: Global Food Hygiene Testing Industry Revenue Million Forecast, by Country 2019 & 2032
- Table 77: Saudi Arabia Food Hygiene Testing Industry Revenue (Million) Forecast, by Application 2019 & 2032
- Table 78: Rest of Middle East Food Hygiene Testing Industry Revenue (Million) Forecast, by Application 2019 & 2032
Frequently Asked Questions
1. What is the projected Compound Annual Growth Rate (CAGR) of the Food Hygiene Testing Industry?
The projected CAGR is approximately 7.43%.
2. Which companies are prominent players in the Food Hygiene Testing Industry?
Key companies in the market include Intertek Group PLC, UL LLC*List Not Exhaustive, SGS GROUP, NSF International, Eurofins Scientific, Merieux Nutrisciences, ALS Limited, Asurequality Limited, TUV SUD.
3. What are the main segments of the Food Hygiene Testing Industry?
The market segments include Contaminant Testing, Technology, Application.
4. Can you provide details about the market size?
The market size is estimated to be USD 23.58 Million as of 2022.
5. What are some drivers contributing to market growth?
Growing Demand for Convenience and Processed Foods Drives Demand; Expanding Cosmetic and Personal Care Industries Utilize Gelatin for Various Purposes.
6. What are the notable trends driving market growth?
Growing Consumer Interest in Food Safety and Quality.
7. Are there any restraints impacting market growth?
Fluctuations in Raw Material Proces Affecting Production Costs.
8. Can you provide examples of recent developments in the market?
July 2022: SGS launched a new food analysis laboratory in Mexico. The new Naucalpan laboratory will support the Mexican food industry, assisting organizations with quality control and regulatory compliance.
9. What pricing options are available for accessing the report?
Pricing options include single-user, multi-user, and enterprise licenses priced at USD 4750, USD 5250, and USD 8750 respectively.
10. Is the market size provided in terms of value or volume?
The market size is provided in terms of value, measured in Million.
11. Are there any specific market keywords associated with the report?
Yes, the market keyword associated with the report is "Food Hygiene Testing Industry," which aids in identifying and referencing the specific market segment covered.
12. How do I determine which pricing option suits my needs best?
The pricing options vary based on user requirements and access needs. Individual users may opt for single-user licenses, while businesses requiring broader access may choose multi-user or enterprise licenses for cost-effective access to the report.
13. Are there any additional resources or data provided in the Food Hygiene Testing Industry report?
While the report offers comprehensive insights, it's advisable to review the specific contents or supplementary materials provided to ascertain if additional resources or data are available.
14. How can I stay updated on further developments or reports in the Food Hygiene Testing Industry?
To stay informed about further developments, trends, and reports in the Food Hygiene Testing Industry, consider subscribing to industry newsletters, following relevant companies and organizations, or regularly checking reputable industry news sources and publications.
Methodology
Step 1 - Identification of Relevant Samples Size from Population Database


Step 2 - Approaches for Defining Global Market Size (Value, Volume* & Price*)

Note*: In applicable scenarios
Step 3 - Data Sources
Primary Research
- Web Analytics
- Survey Reports
- Research Institute
- Latest Research Reports
- Opinion Leaders
Secondary Research
- Annual Reports
- White Paper
- Latest Press Release
- Industry Association
- Paid Database
- Investor Presentations

Step 4 - Data Triangulation
Involves using different sources of information in order to increase the validity of a study
These sources are likely to be stakeholders in a program - participants, other researchers, program staff, other community members, and so on.
Then we put all data in single framework & apply various statistical tools to find out the dynamic on the market.
During the analysis stage, feedback from the stakeholder groups would be compared to determine areas of agreement as well as areas of divergence


