
Key Insights
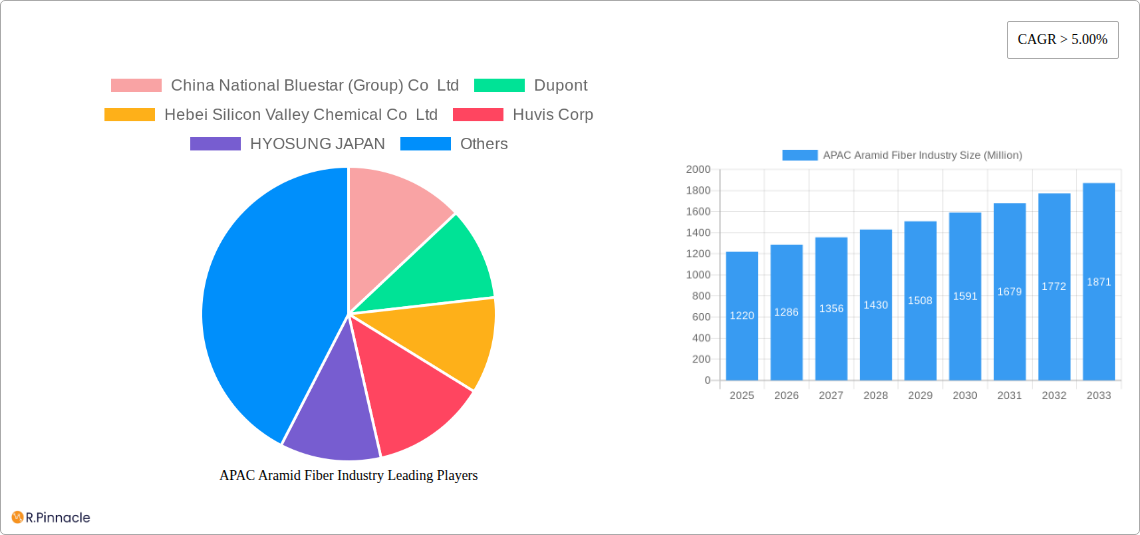
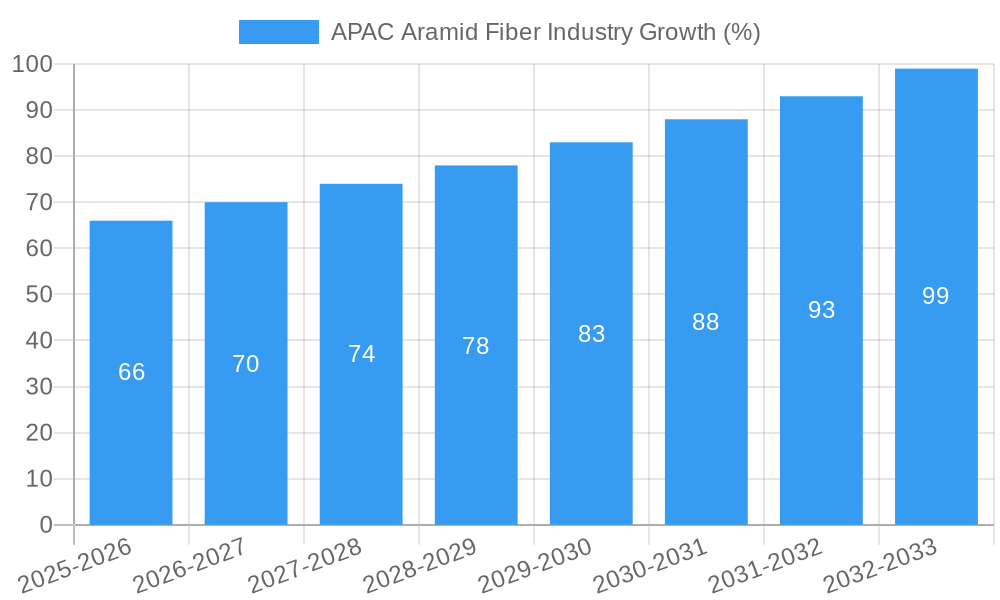
The APAC aramid fiber market, valued at $1.22 billion in 2025, is projected to experience robust growth with a Compound Annual Growth Rate (CAGR) exceeding 5% from 2025 to 2033. This expansion is driven by increasing demand from diverse sectors including aerospace, automotive, and protective apparel. The region's burgeoning infrastructure development, coupled with a rising focus on high-performance materials in various applications, fuels market growth. Key drivers include the escalating adoption of lightweight yet high-strength materials in vehicles to enhance fuel efficiency and safety, and the increasing use of aramid fibers in protective gear across various industries, including military and law enforcement. Furthermore, advancements in aramid fiber manufacturing technologies, leading to improved properties and reduced production costs, contribute positively to market expansion. While challenges such as fluctuating raw material prices and stringent environmental regulations exist, the overall market outlook remains positive, fueled by sustained investment in research and development and the continuous exploration of new applications for aramid fibers.
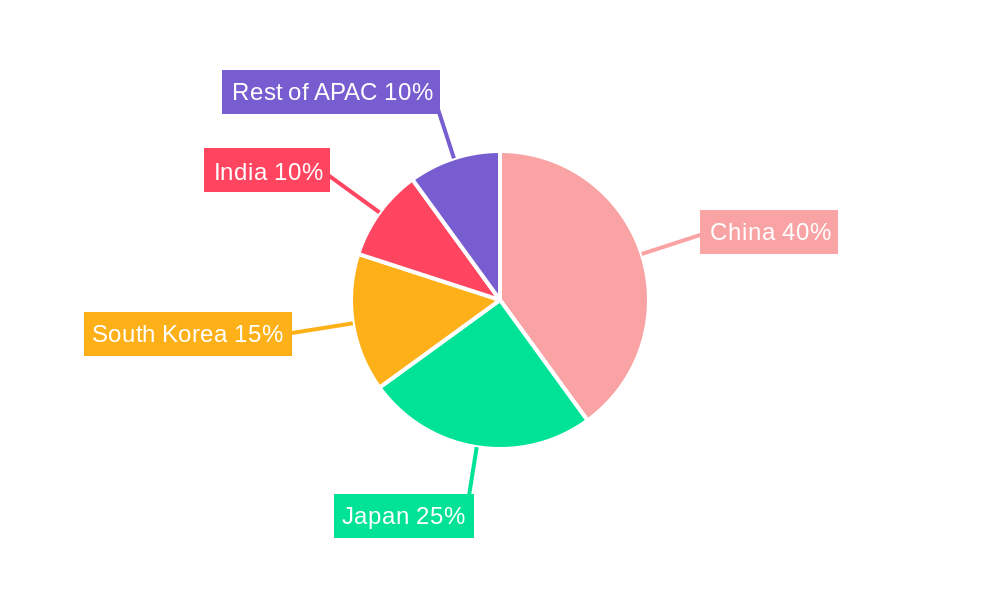
Significant growth is expected across various APAC nations, with China, Japan, and South Korea anticipated to remain key contributors due to their robust manufacturing sectors and established supply chains. The market segmentation within APAC likely reflects the diversity of applications, with para-aramid fibers dominating due to their superior strength-to-weight ratio, followed by meta-aramid fibers, which offer a balance of strength and flexibility. Competition among key players such as China National Bluestar, DuPont, and Toray Industries, along with several regional manufacturers, is fierce, promoting innovation and driving down prices. The ongoing expansion of the aerospace and automotive industries, particularly in emerging economies within APAC, presents significant opportunities for growth in the coming years. However, companies must adapt to evolving consumer preferences, prioritize sustainability, and navigate geopolitical factors to maintain their market position.
APAC Aramid Fiber Industry Market Report: 2019-2033 Forecast
This comprehensive report provides a detailed analysis of the Asia-Pacific (APAC) aramid fiber industry, offering invaluable insights for industry professionals, investors, and strategic decision-makers. Covering the period 2019-2033, with a base year of 2025 and a forecast period of 2025-2033, this report delves into market dynamics, competitive landscapes, and future growth potential. The study incorporates data from the historical period (2019-2024) and leverages extensive primary and secondary research to provide accurate and actionable intelligence. Key players like China National Bluestar (Group) Co Ltd, DuPont, Hebei Silicon Valley Chemical Co Ltd, Huvis Corp, HYOSUNG JAPAN, KERMEL, Kolon Industries Inc, Shanghai J&S New Materials Co ltd, Teijin Aramid, TORAY INDUSTRIES INC, X-FIPER New Material Co Ltd, and Yantai Tayho Advanced Materials Co Ltd are analyzed, though the list is not exhaustive. The report's total market value estimations are presented in Millions.
APAC Aramid Fiber Industry Market Structure & Innovation Trends
This section analyzes the APAC aramid fiber market structure, focusing on market concentration, innovation drivers, regulatory frameworks, and competitive activity. The report examines the market share held by key players, revealing the degree of market consolidation. For instance, it is estimated that the top three players hold approximately xx% of the market share in 2025. Innovation drivers, including advancements in fiber technology and expansion into new applications, are thoroughly explored. The impact of regulatory frameworks on market growth, along with the role of product substitutes and end-user demographics (e.g., automotive, aerospace, protective apparel), are also assessed. The report further includes an analysis of Mergers & Acquisitions (M&A) activities within the industry, estimating the total value of M&A deals during the study period at approximately xx Million.
- Market Concentration: High, with a few dominant players.
- Innovation Drivers: Advancements in fiber technology, expansion into new applications.
- Regulatory Frameworks: Impact on market growth and sustainability.
- Product Substitutes: Analysis of potential substitutes and their market impact.
- End-User Demographics: Breakdown of demand across key industries (automotive, aerospace, etc.).
- M&A Activities: Estimated value of M&A deals: xx Million.
APAC Aramid Fiber Industry Market Dynamics & Trends
This section examines the key dynamics shaping the APAC aramid fiber market. Market growth drivers such as increasing demand from key end-use sectors, technological advancements leading to improved fiber properties, and favorable government policies are analyzed. The CAGR for the forecast period (2025-2033) is projected to be xx%. The report investigates technological disruptions, including the emergence of new fiber types and manufacturing processes. Consumer preferences and their influence on market trends are also detailed. Finally, the competitive dynamics within the industry, including pricing strategies, product differentiation, and market share fluctuations, are thoroughly explored. The market penetration of aramid fibers in various applications is estimated at xx% in 2025, projected to reach xx% by 2033.
Dominant Regions & Segments in APAC Aramid Fiber Industry
This section identifies the dominant regions and segments within the APAC aramid fiber market. The report pinpoints the leading region (e.g., China) and explains its dominance through a detailed analysis. This analysis considers several factors influencing regional growth:
- Economic Policies: Government initiatives supporting industrial growth and technological advancements.
- Infrastructure Development: Investments in infrastructure projects driving demand for aramid fibers.
- Manufacturing Capacity: Analysis of production capacity across different regions.
The report further segments the market based on fiber type, application, and end-use industry, providing a comprehensive understanding of the dynamics within each segment. China is identified as the dominant region due to its robust manufacturing capabilities, government support, and large domestic market. The para-aramid segment is expected to dominate by value due to higher demand and pricing.
APAC Aramid Fiber Industry Product Innovations
Recent advancements in aramid fiber technology include the development of high-strength, high-modulus fibers and improved processing techniques for enhanced performance characteristics. These innovations cater to the growing demands of various industries, such as aerospace, automotive, and protective gear manufacturing. The development of new applications, improved durability, and enhanced cost-effectiveness drive market competitiveness and foster the adoption of aramid fibers across various sectors.
Report Scope & Segmentation Analysis
This report provides a comprehensive segmentation of the APAC aramid fiber market, analyzing its various segments: by fiber type (para-aramid, meta-aramid), by application (tire cord, protective apparel, composites, etc.), by end-use industry (automotive, aerospace, industrial, etc.), and by region. Each segment is analyzed in detail, including growth projections, market sizes, and competitive dynamics. For example, the para-aramid segment is anticipated to demonstrate faster growth due to its superior strength and heat resistance, while the automotive segment is expected to be the largest end-use industry by value.
Key Drivers of APAC Aramid Fiber Industry Growth
The APAC aramid fiber industry's growth is fueled by several key factors. Firstly, the rising demand from the automotive and aerospace industries for lightweight, high-strength materials drives significant market expansion. Secondly, favorable government policies, including incentives for advanced material adoption, support industry growth. Finally, continuous technological advancements, leading to improved fiber properties and processing techniques, enhance market appeal and broaden applications.
Challenges in the APAC Aramid Fiber Industry Sector
The APAC aramid fiber industry faces several challenges including the fluctuating prices of raw materials, impacting profitability. Strict environmental regulations and supply chain complexities also present significant obstacles. Furthermore, intense competition from both domestic and international players necessitates continuous innovation and cost-optimization strategies to maintain market share.
Emerging Opportunities in APAC Aramid Fiber Industry
Emerging opportunities arise from the expanding application of aramid fibers in sectors such as renewable energy (wind turbines) and construction (high-performance composites). The development of new high-performance fiber types and the exploration of innovative processing methods offer significant growth avenues. Moreover, an increasing awareness of safety and protection drives demand for aramid-based protective apparel in various industries, thus presenting a significant opportunity for market expansion.
Leading Players in the APAC Aramid Fiber Industry Market
- China National Bluestar (Group) Co Ltd
- Dupont
- Hebei Silicon Valley Chemical Co Ltd
- Huvis Corp
- HYOSUNG JAPAN
- KERMEL
- Kolon Industries Inc
- Shanghai J&S New Materials Co ltd
- Teijin Aramid
- TORAY INDUSTRIES INC
- X-FIPER New Material Co Ltd
- Yantai Tayho Advanced Materials Co Ltd
Key Developments in APAC Aramid Fiber Industry Industry
- 2022 Q4: Teijin Aramid announced a significant investment in expanding its production capacity.
- 2023 Q1: DuPont launched a new high-performance aramid fiber for the automotive industry.
- 2023 Q3: A major merger between two mid-sized aramid fiber producers was finalized. (Further details are included in the full report.)
Future Outlook for APAC Aramid Fiber Industry Market
The APAC aramid fiber market is poised for substantial growth, driven by increasing demand from diverse end-use sectors, technological advancements, and supportive government policies. Strategic partnerships, investments in R&D, and expansion into new applications are expected to shape the industry's future landscape. The development of sustainable and cost-effective production methods will be crucial for maintaining competitiveness and driving long-term growth.
APAC Aramid Fiber Industry Segmentation
-
1. Product Type
- 1.1. Para-aramid
- 1.2. Meta-aramid
-
2. End-user Industry
- 2.1. Aerospace and Defense
- 2.2. Automotive
- 2.3. Electrical and Electronics
- 2.4. Sporting Goods
- 2.5. Other En
-
3. Geography
-
3.1. Asia-Pacific
- 3.1.1. China
- 3.1.2. India
- 3.1.3. Japan
- 3.1.4. South Korea
- 3.1.5. Malaysia
- 3.1.6. Thailand
- 3.1.7. Indonesia
- 3.1.8. Vietnam
- 3.1.9. Rest of Asia-Pacific
-
3.1. Asia-Pacific
APAC Aramid Fiber Industry Segmentation By Geography
-
1. Asia Pacific
- 1.1. China
- 1.2. India
- 1.3. Japan
- 1.4. South Korea
- 1.5. Malaysia
- 1.6. Thailand
- 1.7. Indonesia
- 1.8. Vietnam
- 1.9. Rest of Asia Pacific
APAC Aramid Fiber Industry REPORT HIGHLIGHTS
| Aspects | Details |
|---|---|
| Study Period | 2019-2033 |
| Base Year | 2024 |
| Estimated Year | 2025 |
| Forecast Period | 2025-2033 |
| Historical Period | 2019-2024 |
| Growth Rate | CAGR of > 5.00% from 2019-2033 |
| Segmentation |
|
Table of Contents
- 1. Introduction
- 1.1. Research Scope
- 1.2. Market Segmentation
- 1.3. Research Methodology
- 1.4. Definitions and Assumptions
- 2. Executive Summary
- 2.1. Introduction
- 3. Market Dynamics
- 3.1. Introduction
- 3.2. Market Drivers
- 3.2.1. The Increase in Demand for Light Weight Materials in Automotive Industry; The Rising Defense Expenditure of India and China; The Increase in Usage of Aramid Fibers as a Potential Substitute for Steel Materials
- 3.3. Market Restrains
- 3.3.1. The Increase in Demand for Light Weight Materials in Automotive Industry; The Rising Defense Expenditure of India and China; The Increase in Usage of Aramid Fibers as a Potential Substitute for Steel Materials
- 3.4. Market Trends
- 3.4.1. Aerospace and Defense End-User Industry to Dominated the Market
- 4. Market Factor Analysis
- 4.1. Porters Five Forces
- 4.2. Supply/Value Chain
- 4.3. PESTEL analysis
- 4.4. Market Entropy
- 4.5. Patent/Trademark Analysis
- 5. Global APAC Aramid Fiber Industry Analysis, Insights and Forecast, 2019-2031
- 5.1. Market Analysis, Insights and Forecast - by Product Type
- 5.1.1. Para-aramid
- 5.1.2. Meta-aramid
- 5.2. Market Analysis, Insights and Forecast - by End-user Industry
- 5.2.1. Aerospace and Defense
- 5.2.2. Automotive
- 5.2.3. Electrical and Electronics
- 5.2.4. Sporting Goods
- 5.2.5. Other En
- 5.3. Market Analysis, Insights and Forecast - by Geography
- 5.3.1. Asia-Pacific
- 5.3.1.1. China
- 5.3.1.2. India
- 5.3.1.3. Japan
- 5.3.1.4. South Korea
- 5.3.1.5. Malaysia
- 5.3.1.6. Thailand
- 5.3.1.7. Indonesia
- 5.3.1.8. Vietnam
- 5.3.1.9. Rest of Asia-Pacific
- 5.3.1. Asia-Pacific
- 5.4. Market Analysis, Insights and Forecast - by Region
- 5.4.1. Asia Pacific
- 5.1. Market Analysis, Insights and Forecast - by Product Type
- 6. Competitive Analysis
- 6.1. Global Market Share Analysis 2024
- 6.2. Company Profiles
- 6.2.1 China National Bluestar (Group) Co Ltd
- 6.2.1.1. Overview
- 6.2.1.2. Products
- 6.2.1.3. SWOT Analysis
- 6.2.1.4. Recent Developments
- 6.2.1.5. Financials (Based on Availability)
- 6.2.2 Dupont
- 6.2.2.1. Overview
- 6.2.2.2. Products
- 6.2.2.3. SWOT Analysis
- 6.2.2.4. Recent Developments
- 6.2.2.5. Financials (Based on Availability)
- 6.2.3 Hebei Silicon Valley Chemical Co Ltd
- 6.2.3.1. Overview
- 6.2.3.2. Products
- 6.2.3.3. SWOT Analysis
- 6.2.3.4. Recent Developments
- 6.2.3.5. Financials (Based on Availability)
- 6.2.4 Huvis Corp
- 6.2.4.1. Overview
- 6.2.4.2. Products
- 6.2.4.3. SWOT Analysis
- 6.2.4.4. Recent Developments
- 6.2.4.5. Financials (Based on Availability)
- 6.2.5 HYOSUNG JAPAN
- 6.2.5.1. Overview
- 6.2.5.2. Products
- 6.2.5.3. SWOT Analysis
- 6.2.5.4. Recent Developments
- 6.2.5.5. Financials (Based on Availability)
- 6.2.6 KERMEL
- 6.2.6.1. Overview
- 6.2.6.2. Products
- 6.2.6.3. SWOT Analysis
- 6.2.6.4. Recent Developments
- 6.2.6.5. Financials (Based on Availability)
- 6.2.7 Kolon Industries Inc
- 6.2.7.1. Overview
- 6.2.7.2. Products
- 6.2.7.3. SWOT Analysis
- 6.2.7.4. Recent Developments
- 6.2.7.5. Financials (Based on Availability)
- 6.2.8 Shanghai J&S New Materials Co ltd
- 6.2.8.1. Overview
- 6.2.8.2. Products
- 6.2.8.3. SWOT Analysis
- 6.2.8.4. Recent Developments
- 6.2.8.5. Financials (Based on Availability)
- 6.2.9 Teijin Aramid
- 6.2.9.1. Overview
- 6.2.9.2. Products
- 6.2.9.3. SWOT Analysis
- 6.2.9.4. Recent Developments
- 6.2.9.5. Financials (Based on Availability)
- 6.2.10 TORAY INDUSTRIES INC
- 6.2.10.1. Overview
- 6.2.10.2. Products
- 6.2.10.3. SWOT Analysis
- 6.2.10.4. Recent Developments
- 6.2.10.5. Financials (Based on Availability)
- 6.2.11 X-FIPER New Material Co Ltd
- 6.2.11.1. Overview
- 6.2.11.2. Products
- 6.2.11.3. SWOT Analysis
- 6.2.11.4. Recent Developments
- 6.2.11.5. Financials (Based on Availability)
- 6.2.12 Yantai Tayho Advanced Materials Co Ltd *List Not Exhaustive
- 6.2.12.1. Overview
- 6.2.12.2. Products
- 6.2.12.3. SWOT Analysis
- 6.2.12.4. Recent Developments
- 6.2.12.5. Financials (Based on Availability)
- 6.2.1 China National Bluestar (Group) Co Ltd
List of Figures
- Figure 1: Global APAC Aramid Fiber Industry Revenue Breakdown (Million, %) by Region 2024 & 2032
- Figure 2: Global APAC Aramid Fiber Industry Volume Breakdown (Billion, %) by Region 2024 & 2032
- Figure 3: Asia Pacific APAC Aramid Fiber Industry Revenue (Million), by Product Type 2024 & 2032
- Figure 4: Asia Pacific APAC Aramid Fiber Industry Volume (Billion), by Product Type 2024 & 2032
- Figure 5: Asia Pacific APAC Aramid Fiber Industry Revenue Share (%), by Product Type 2024 & 2032
- Figure 6: Asia Pacific APAC Aramid Fiber Industry Volume Share (%), by Product Type 2024 & 2032
- Figure 7: Asia Pacific APAC Aramid Fiber Industry Revenue (Million), by End-user Industry 2024 & 2032
- Figure 8: Asia Pacific APAC Aramid Fiber Industry Volume (Billion), by End-user Industry 2024 & 2032
- Figure 9: Asia Pacific APAC Aramid Fiber Industry Revenue Share (%), by End-user Industry 2024 & 2032
- Figure 10: Asia Pacific APAC Aramid Fiber Industry Volume Share (%), by End-user Industry 2024 & 2032
- Figure 11: Asia Pacific APAC Aramid Fiber Industry Revenue (Million), by Geography 2024 & 2032
- Figure 12: Asia Pacific APAC Aramid Fiber Industry Volume (Billion), by Geography 2024 & 2032
- Figure 13: Asia Pacific APAC Aramid Fiber Industry Revenue Share (%), by Geography 2024 & 2032
- Figure 14: Asia Pacific APAC Aramid Fiber Industry Volume Share (%), by Geography 2024 & 2032
- Figure 15: Asia Pacific APAC Aramid Fiber Industry Revenue (Million), by Country 2024 & 2032
- Figure 16: Asia Pacific APAC Aramid Fiber Industry Volume (Billion), by Country 2024 & 2032
- Figure 17: Asia Pacific APAC Aramid Fiber Industry Revenue Share (%), by Country 2024 & 2032
- Figure 18: Asia Pacific APAC Aramid Fiber Industry Volume Share (%), by Country 2024 & 2032
List of Tables
- Table 1: Global APAC Aramid Fiber Industry Revenue Million Forecast, by Region 2019 & 2032
- Table 2: Global APAC Aramid Fiber Industry Volume Billion Forecast, by Region 2019 & 2032
- Table 3: Global APAC Aramid Fiber Industry Revenue Million Forecast, by Product Type 2019 & 2032
- Table 4: Global APAC Aramid Fiber Industry Volume Billion Forecast, by Product Type 2019 & 2032
- Table 5: Global APAC Aramid Fiber Industry Revenue Million Forecast, by End-user Industry 2019 & 2032
- Table 6: Global APAC Aramid Fiber Industry Volume Billion Forecast, by End-user Industry 2019 & 2032
- Table 7: Global APAC Aramid Fiber Industry Revenue Million Forecast, by Geography 2019 & 2032
- Table 8: Global APAC Aramid Fiber Industry Volume Billion Forecast, by Geography 2019 & 2032
- Table 9: Global APAC Aramid Fiber Industry Revenue Million Forecast, by Region 2019 & 2032
- Table 10: Global APAC Aramid Fiber Industry Volume Billion Forecast, by Region 2019 & 2032
- Table 11: Global APAC Aramid Fiber Industry Revenue Million Forecast, by Product Type 2019 & 2032
- Table 12: Global APAC Aramid Fiber Industry Volume Billion Forecast, by Product Type 2019 & 2032
- Table 13: Global APAC Aramid Fiber Industry Revenue Million Forecast, by End-user Industry 2019 & 2032
- Table 14: Global APAC Aramid Fiber Industry Volume Billion Forecast, by End-user Industry 2019 & 2032
- Table 15: Global APAC Aramid Fiber Industry Revenue Million Forecast, by Geography 2019 & 2032
- Table 16: Global APAC Aramid Fiber Industry Volume Billion Forecast, by Geography 2019 & 2032
- Table 17: Global APAC Aramid Fiber Industry Revenue Million Forecast, by Country 2019 & 2032
- Table 18: Global APAC Aramid Fiber Industry Volume Billion Forecast, by Country 2019 & 2032
- Table 19: China APAC Aramid Fiber Industry Revenue (Million) Forecast, by Application 2019 & 2032
- Table 20: China APAC Aramid Fiber Industry Volume (Billion) Forecast, by Application 2019 & 2032
- Table 21: India APAC Aramid Fiber Industry Revenue (Million) Forecast, by Application 2019 & 2032
- Table 22: India APAC Aramid Fiber Industry Volume (Billion) Forecast, by Application 2019 & 2032
- Table 23: Japan APAC Aramid Fiber Industry Revenue (Million) Forecast, by Application 2019 & 2032
- Table 24: Japan APAC Aramid Fiber Industry Volume (Billion) Forecast, by Application 2019 & 2032
- Table 25: South Korea APAC Aramid Fiber Industry Revenue (Million) Forecast, by Application 2019 & 2032
- Table 26: South Korea APAC Aramid Fiber Industry Volume (Billion) Forecast, by Application 2019 & 2032
- Table 27: Malaysia APAC Aramid Fiber Industry Revenue (Million) Forecast, by Application 2019 & 2032
- Table 28: Malaysia APAC Aramid Fiber Industry Volume (Billion) Forecast, by Application 2019 & 2032
- Table 29: Thailand APAC Aramid Fiber Industry Revenue (Million) Forecast, by Application 2019 & 2032
- Table 30: Thailand APAC Aramid Fiber Industry Volume (Billion) Forecast, by Application 2019 & 2032
- Table 31: Indonesia APAC Aramid Fiber Industry Revenue (Million) Forecast, by Application 2019 & 2032
- Table 32: Indonesia APAC Aramid Fiber Industry Volume (Billion) Forecast, by Application 2019 & 2032
- Table 33: Vietnam APAC Aramid Fiber Industry Revenue (Million) Forecast, by Application 2019 & 2032
- Table 34: Vietnam APAC Aramid Fiber Industry Volume (Billion) Forecast, by Application 2019 & 2032
- Table 35: Rest of Asia Pacific APAC Aramid Fiber Industry Revenue (Million) Forecast, by Application 2019 & 2032
- Table 36: Rest of Asia Pacific APAC Aramid Fiber Industry Volume (Billion) Forecast, by Application 2019 & 2032
Frequently Asked Questions
1. What is the projected Compound Annual Growth Rate (CAGR) of the APAC Aramid Fiber Industry?
The projected CAGR is approximately > 5.00%.
2. Which companies are prominent players in the APAC Aramid Fiber Industry?
Key companies in the market include China National Bluestar (Group) Co Ltd, Dupont, Hebei Silicon Valley Chemical Co Ltd, Huvis Corp, HYOSUNG JAPAN, KERMEL, Kolon Industries Inc, Shanghai J&S New Materials Co ltd, Teijin Aramid, TORAY INDUSTRIES INC, X-FIPER New Material Co Ltd, Yantai Tayho Advanced Materials Co Ltd *List Not Exhaustive.
3. What are the main segments of the APAC Aramid Fiber Industry?
The market segments include Product Type, End-user Industry, Geography.
4. Can you provide details about the market size?
The market size is estimated to be USD 1.22 Million as of 2022.
5. What are some drivers contributing to market growth?
The Increase in Demand for Light Weight Materials in Automotive Industry; The Rising Defense Expenditure of India and China; The Increase in Usage of Aramid Fibers as a Potential Substitute for Steel Materials.
6. What are the notable trends driving market growth?
Aerospace and Defense End-User Industry to Dominated the Market.
7. Are there any restraints impacting market growth?
The Increase in Demand for Light Weight Materials in Automotive Industry; The Rising Defense Expenditure of India and China; The Increase in Usage of Aramid Fibers as a Potential Substitute for Steel Materials.
8. Can you provide examples of recent developments in the market?
The recent developments pertaining to the major players in the market are being covered in the complete study.
9. What pricing options are available for accessing the report?
Pricing options include single-user, multi-user, and enterprise licenses priced at USD 4750, USD 5250, and USD 8750 respectively.
10. Is the market size provided in terms of value or volume?
The market size is provided in terms of value, measured in Million and volume, measured in Billion.
11. Are there any specific market keywords associated with the report?
Yes, the market keyword associated with the report is "APAC Aramid Fiber Industry," which aids in identifying and referencing the specific market segment covered.
12. How do I determine which pricing option suits my needs best?
The pricing options vary based on user requirements and access needs. Individual users may opt for single-user licenses, while businesses requiring broader access may choose multi-user or enterprise licenses for cost-effective access to the report.
13. Are there any additional resources or data provided in the APAC Aramid Fiber Industry report?
While the report offers comprehensive insights, it's advisable to review the specific contents or supplementary materials provided to ascertain if additional resources or data are available.
14. How can I stay updated on further developments or reports in the APAC Aramid Fiber Industry?
To stay informed about further developments, trends, and reports in the APAC Aramid Fiber Industry, consider subscribing to industry newsletters, following relevant companies and organizations, or regularly checking reputable industry news sources and publications.
Methodology
Step 1 - Identification of Relevant Samples Size from Population Database


Step 2 - Approaches for Defining Global Market Size (Value, Volume* & Price*)

Note*: In applicable scenarios
Step 3 - Data Sources
Primary Research
- Web Analytics
- Survey Reports
- Research Institute
- Latest Research Reports
- Opinion Leaders
Secondary Research
- Annual Reports
- White Paper
- Latest Press Release
- Industry Association
- Paid Database
- Investor Presentations

Step 4 - Data Triangulation
Involves using different sources of information in order to increase the validity of a study
These sources are likely to be stakeholders in a program - participants, other researchers, program staff, other community members, and so on.
Then we put all data in single framework & apply various statistical tools to find out the dynamic on the market.
During the analysis stage, feedback from the stakeholder groups would be compared to determine areas of agreement as well as areas of divergence


