
Key Insights
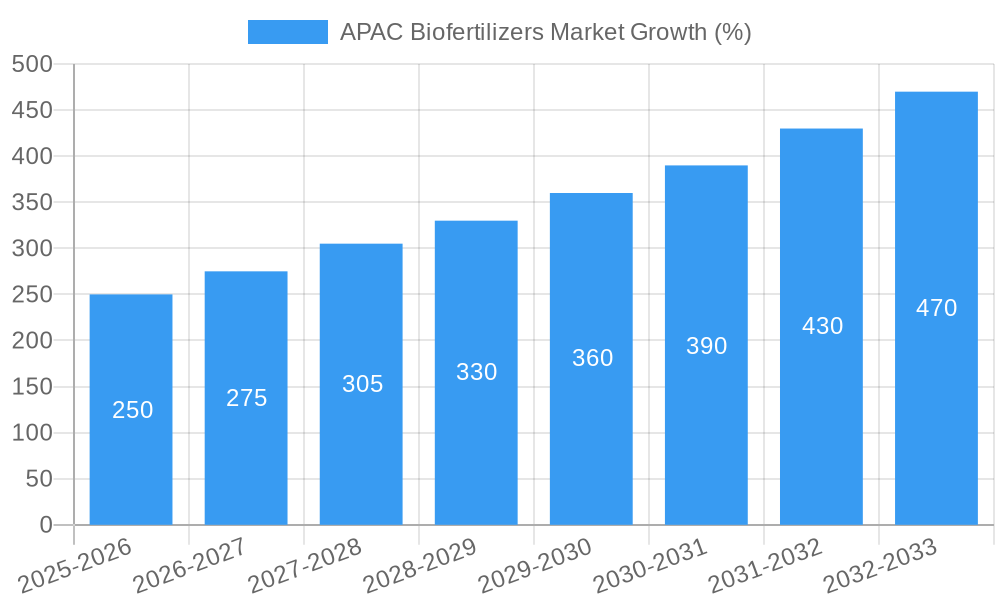
The Asia-Pacific (APAC) biofertilizers market is experiencing robust growth, driven by increasing demand for sustainable agriculture practices and a rising global population requiring enhanced food security. The market's Compound Annual Growth Rate (CAGR) of 10.80% from 2019 to 2024 suggests a significant upward trajectory, projected to continue into the forecast period (2025-2033). Key drivers include the growing awareness of the environmental impact of chemical fertilizers, government initiatives promoting sustainable farming, and the rising adoption of precision agriculture techniques. Within APAC, India and China represent significant market segments, fueled by large agricultural sectors and supportive governmental policies. The market is segmented by various microorganisms (Rhizobium, Azospirillum, Azotobacter, etc.) and applications (grains & cereals, pulses & oilseeds, etc.), offering diverse growth opportunities. While challenges exist, such as inconsistent product efficacy and limited awareness in certain regions, the overall market outlook remains positive. The increasing adoption of biofertilizers in commercial crops, driven by higher yields and improved crop quality, is a prominent trend, while factors like fluctuating raw material prices and a lack of standardized quality control measures pose some restraints.
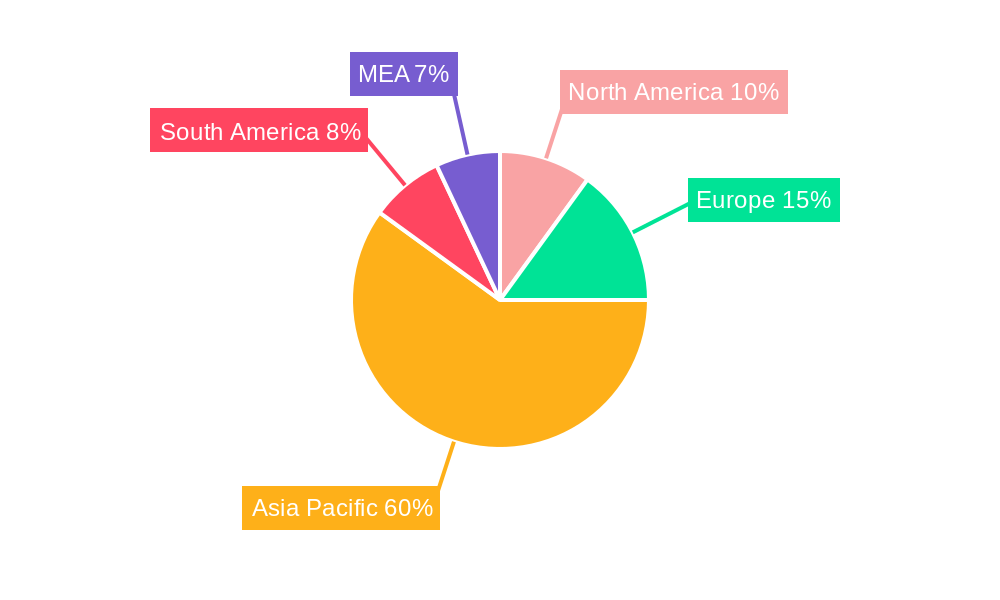
The APAC region’s dominance in the global biofertilizers market stems from its vast agricultural land and a large farming population. The rising disposable income in several APAC countries is also leading to increased consumer demand for organic and sustainably produced food, thereby increasing the demand for biofertilizers. Furthermore, several governments in the region are actively promoting sustainable agricultural practices through subsidies and incentives, further boosting market growth. However, the market faces challenges related to technological advancements needed to improve efficacy and consistency, as well as logistical hurdles in effectively distributing biofertilizers to remote farming communities. Despite these challenges, continuous innovation in biofertilizer technology, coupled with supportive government policies and increasing consumer awareness, is expected to propel the APAC biofertilizer market towards substantial expansion in the coming years. The market is ripe for investment and offers lucrative opportunities for both established players and new entrants.
APAC Biofertilizers Market: A Comprehensive Report (2019-2033)
This comprehensive report provides an in-depth analysis of the Asia-Pacific biofertilizers market, offering invaluable insights for industry professionals, investors, and stakeholders. Covering the period from 2019 to 2033, with 2025 as the base year, this report forecasts market trends and growth opportunities across various segments. The report value is estimated at xx Million for the year 2025.
APAC Biofertilizers Market Structure & Innovation Trends
The APAC biofertilizers market exhibits a moderately fragmented structure, with several key players vying for market share. Market concentration is influenced by factors such as technological advancements, regulatory landscapes, and the increasing adoption of sustainable agricultural practices. Innovation is driven primarily by the development of novel biofertilizer formulations, enhanced production technologies, and a growing focus on precision agriculture. Key trends include the rising demand for eco-friendly agricultural inputs, government initiatives promoting sustainable farming, and strategic mergers and acquisitions (M&A) among industry players.
- Market Share: The top five players collectively hold an estimated xx% market share in 2025, with the remaining share distributed among numerous smaller companies.
- M&A Activity: The past five years have witnessed significant M&A activity, with deal values exceeding xx Million in total. These deals primarily focused on expanding product portfolios, enhancing distribution networks, and securing access to new technologies.
- Regulatory Framework: Varying regulatory frameworks across different APAC countries influence market dynamics. Stringent regulations related to biofertilizer production and usage impact market growth and access to market for the small players.
- Product Substitutes: Chemical fertilizers remain the primary substitute for biofertilizers, posing a significant challenge to market penetration. However, growing environmental concerns and the increasing awareness of the benefits of biofertilizers are steadily driving market adoption.
- End-User Demographics: The market is primarily driven by smallholder and commercial farmers, with increasing adoption among larger agricultural enterprises.
APAC Biofertilizers Market Dynamics & Trends
The APAC biofertilizers market is poised for significant growth, driven by a confluence of factors. The rising demand for sustainable and eco-friendly agricultural practices is a major catalyst, alongside increasing awareness of the environmental hazards associated with conventional chemical fertilizers. Technological advancements are leading to the development of more efficient and effective biofertilizers, further accelerating market growth. Consumer preferences are shifting towards organically produced food, which indirectly boosts the demand for biofertilizers. Intense competitive dynamics, characterized by innovation, pricing strategies, and distribution network expansion, shape the market landscape.
- CAGR: The market is expected to witness a CAGR of xx% during the forecast period (2025-2033).
- Market Penetration: Market penetration remains relatively low in several APAC countries, presenting significant growth opportunities.
- Technological Disruptions: The development of novel biofertilizer formulations using advanced biotechnology techniques is disrupting traditional methods, enhancing product efficacy and market attractiveness.
Dominant Regions & Segments in APAC Biofertilizers Market
The APAC biofertilizers market demonstrates significant regional variations in growth and adoption. India and China are currently the leading markets, owing to their large agricultural sectors and supportive government policies. Other significant markets include Australia, Japan, South Korea, etc. Among the various microorganisms, Rhizobium and Phosphate Solubilizing Bacteria hold significant market share, reflecting their effectiveness in enhancing nutrient uptake in various crops. The Grains & Cereals and Pulses & Oilseeds segments represent the largest application areas, driven by the high demand for these crops across the region.
Key Drivers for Dominant Regions:
- India: Government initiatives promoting sustainable agriculture, large agricultural landmass, and a growing awareness of the benefits of biofertilizers.
- China: Significant investments in agricultural research and development, a supportive policy environment, and substantial demand from the growing population.
- Australia: Focus on sustainable agricultural practices, high adoption of advanced farming techniques, and favorable regulatory environment.
Dominant Microorganism Segments: The higher efficacy and wide applicability of Rhizobium and Phosphate Solubilizing Bacteria are contributing to their higher market share in the APAC region. Mycorrhizae are also witnessing significant growth.
Dominant Application Segments: The Grains & Cereals and Pulses & Oilseeds segments dominate the market due to high acreage and demand for these products.
APAC Biofertilizers Market Product Innovations
Recent product innovations focus on enhancing the efficacy of biofertilizers through advanced formulations, improved delivery systems, and the incorporation of multiple microorganisms for synergistic effects. These innovations are designed to address specific crop needs and optimize nutrient utilization, leading to higher crop yields and improved soil health. Competitive advantages are derived from patented formulations, superior efficacy, and established distribution networks. The market is witnessing a gradual shift from liquid biofertilizers to granular and powder formulations for ease of application and transportation.
Report Scope & Segmentation Analysis
This report segments the APAC biofertilizers market based on Microorganism type (Rhizobium, Azospirillum, Azotobacter, Blue-Green Algae, Phosphate Solubilizing Bacteria, Mycorrhiza, Other Microorganisms) and Application (Grains & Cereals, Pulses & Oilseeds, Commercial Crops, Fruits & Vegetables, Other Applications). Each segment is analyzed based on its market size, growth rate, and competitive landscape. Growth projections indicate significant potential for all segments, with variations based on specific crop demands and regional conditions. Competitive dynamics are shaped by factors such as product innovation, pricing strategies, and market penetration efforts.
Key Drivers of APAC Biofertilizers Market Growth
The APAC biofertilizers market is propelled by several key factors. Government initiatives promoting sustainable agriculture and policies incentivizing the adoption of biofertilizers play a significant role. The growing awareness among farmers regarding the benefits of biofertilizers, including improved soil health, enhanced crop yields, and reduced environmental impact, is a crucial driver. Technological advancements resulting in more efficient and effective biofertilizer formulations further contribute to market expansion. The increasing demand for organic and sustainably produced food also fuels the market's growth.
Challenges in the APAC Biofertilizers Market Sector
Despite significant growth potential, the APAC biofertilizers market faces certain challenges. The relatively high cost of biofertilizers compared to chemical fertilizers limits wider adoption, especially among smallholder farmers. Maintaining the quality and efficacy of biofertilizers during storage and transportation presents logistical difficulties. Competition from established chemical fertilizer manufacturers also poses a challenge. Furthermore, the lack of awareness and farmer education in certain regions hinders market penetration.
Emerging Opportunities in APAC Biofertilizers Market
The APAC biofertilizers market presents several exciting opportunities. The increasing adoption of precision agriculture techniques creates opportunities for targeted biofertilizer applications. The development of novel biofertilizer formulations tailored for specific crops and soil conditions offers significant potential. Expanding into new markets with untapped potential, particularly in Southeast Asia, represents a substantial opportunity. Investment in research and development to enhance biofertilizer efficacy and develop new formulations will also drive future growth.
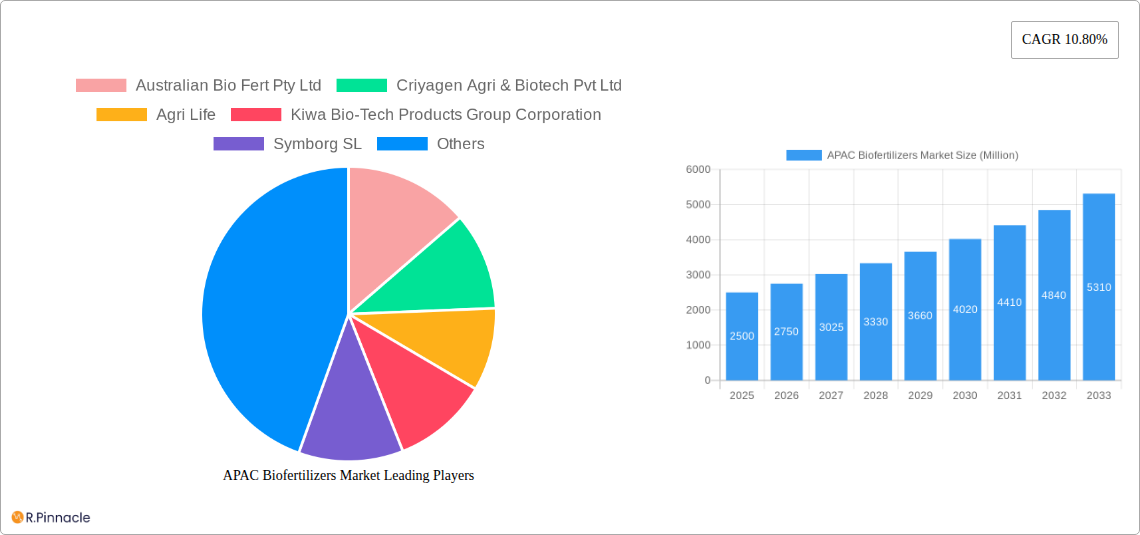
Leading Players in the APAC Biofertilizers Market Market
- Australian Bio Fert Pty Ltd
- Criyagen Agri & Biotech Pvt Ltd
- Agri Life
- Kiwa Bio-Tech Products Group Corporation
- Symborg SL
- CBF China Biofertilizers AG
- Biomax Naturals
- Agrinos AS
- BioAg Pty Ltd
- Camson Biotechnologies Limited
- National Fertilizer Ltd
Key Developments in APAP Biofertilizers Market Industry
- January 2023: Company X launched a new biofertilizer formulation for rice cultivation.
- March 2022: Company Y acquired Company Z, expanding its product portfolio and market reach.
- June 2021: Government of Country A launched a subsidy program to promote biofertilizer adoption.
- (Further details on specific developments with dates need to be added here)
Future Outlook for APAC Biofertilizers Market Market
The future of the APAC biofertilizers market looks bright, with several factors indicating strong growth potential. Continued government support, technological advancements, and increasing consumer demand for sustainable agricultural practices will drive market expansion. The development of innovative biofertilizer formulations and targeted marketing strategies will further enhance market penetration. The market is expected to reach xx Million by 2033. Strategic partnerships and collaborations among industry players will be essential in shaping future market dynamics.
APAC Biofertilizers Market Segmentation
- 1. Production Analysis
- 2. Consumption Analysis
- 3. Import Market Analysis (Value & Volume)
- 4. Export Market Analysis (Value & Volume)
- 5. Price Trend Analysis
APAC Biofertilizers Market Segmentation By Geography
-
1. North America
- 1.1. United States
- 1.2. Canada
- 1.3. Mexico
-
2. South America
- 2.1. Brazil
- 2.2. Argentina
- 2.3. Rest of South America
-
3. Europe
- 3.1. United Kingdom
- 3.2. Germany
- 3.3. France
- 3.4. Italy
- 3.5. Spain
- 3.6. Russia
- 3.7. Benelux
- 3.8. Nordics
- 3.9. Rest of Europe
-
4. Middle East & Africa
- 4.1. Turkey
- 4.2. Israel
- 4.3. GCC
- 4.4. North Africa
- 4.5. South Africa
- 4.6. Rest of Middle East & Africa
-
5. Asia Pacific
- 5.1. China
- 5.2. India
- 5.3. Japan
- 5.4. South Korea
- 5.5. ASEAN
- 5.6. Oceania
- 5.7. Rest of Asia Pacific
APAC Biofertilizers Market REPORT HIGHLIGHTS
| Aspects | Details |
|---|---|
| Study Period | 2019-2033 |
| Base Year | 2024 |
| Estimated Year | 2025 |
| Forecast Period | 2025-2033 |
| Historical Period | 2019-2024 |
| Growth Rate | CAGR of 10.80% from 2019-2033 |
| Segmentation |
|
Table of Contents
- 1. Introduction
- 1.1. Research Scope
- 1.2. Market Segmentation
- 1.3. Research Methodology
- 1.4. Definitions and Assumptions
- 2. Executive Summary
- 2.1. Introduction
- 3. Market Dynamics
- 3.1. Introduction
- 3.2. Market Drivers
- 3.2.1. Seed Treatment As A Solution To Enhance Yield; Growing Awareness For Seed Treatment Among The Farmers; Rising Trend Of Organic Farming
- 3.3. Market Restrains
- 3.3.1. Limitations Across Farm-Level Seed Treatment; Rising Environmental Concerns
- 3.4. Market Trends
- 3.4.1. Increased Practice for Organic Farming
- 4. Market Factor Analysis
- 4.1. Porters Five Forces
- 4.2. Supply/Value Chain
- 4.3. PESTEL analysis
- 4.4. Market Entropy
- 4.5. Patent/Trademark Analysis
- 5. Global APAC Biofertilizers Market Analysis, Insights and Forecast, 2019-2031
- 5.1. Market Analysis, Insights and Forecast - by Production Analysis
- 5.2. Market Analysis, Insights and Forecast - by Consumption Analysis
- 5.3. Market Analysis, Insights and Forecast - by Import Market Analysis (Value & Volume)
- 5.4. Market Analysis, Insights and Forecast - by Export Market Analysis (Value & Volume)
- 5.5. Market Analysis, Insights and Forecast - by Price Trend Analysis
- 5.6. Market Analysis, Insights and Forecast - by Region
- 5.6.1. North America
- 5.6.2. South America
- 5.6.3. Europe
- 5.6.4. Middle East & Africa
- 5.6.5. Asia Pacific
- 5.1. Market Analysis, Insights and Forecast - by Production Analysis
- 6. North America APAC Biofertilizers Market Analysis, Insights and Forecast, 2019-2031
- 6.1. Market Analysis, Insights and Forecast - by Production Analysis
- 6.2. Market Analysis, Insights and Forecast - by Consumption Analysis
- 6.3. Market Analysis, Insights and Forecast - by Import Market Analysis (Value & Volume)
- 6.4. Market Analysis, Insights and Forecast - by Export Market Analysis (Value & Volume)
- 6.5. Market Analysis, Insights and Forecast - by Price Trend Analysis
- 6.1. Market Analysis, Insights and Forecast - by Production Analysis
- 7. South America APAC Biofertilizers Market Analysis, Insights and Forecast, 2019-2031
- 7.1. Market Analysis, Insights and Forecast - by Production Analysis
- 7.2. Market Analysis, Insights and Forecast - by Consumption Analysis
- 7.3. Market Analysis, Insights and Forecast - by Import Market Analysis (Value & Volume)
- 7.4. Market Analysis, Insights and Forecast - by Export Market Analysis (Value & Volume)
- 7.5. Market Analysis, Insights and Forecast - by Price Trend Analysis
- 7.1. Market Analysis, Insights and Forecast - by Production Analysis
- 8. Europe APAC Biofertilizers Market Analysis, Insights and Forecast, 2019-2031
- 8.1. Market Analysis, Insights and Forecast - by Production Analysis
- 8.2. Market Analysis, Insights and Forecast - by Consumption Analysis
- 8.3. Market Analysis, Insights and Forecast - by Import Market Analysis (Value & Volume)
- 8.4. Market Analysis, Insights and Forecast - by Export Market Analysis (Value & Volume)
- 8.5. Market Analysis, Insights and Forecast - by Price Trend Analysis
- 8.1. Market Analysis, Insights and Forecast - by Production Analysis
- 9. Middle East & Africa APAC Biofertilizers Market Analysis, Insights and Forecast, 2019-2031
- 9.1. Market Analysis, Insights and Forecast - by Production Analysis
- 9.2. Market Analysis, Insights and Forecast - by Consumption Analysis
- 9.3. Market Analysis, Insights and Forecast - by Import Market Analysis (Value & Volume)
- 9.4. Market Analysis, Insights and Forecast - by Export Market Analysis (Value & Volume)
- 9.5. Market Analysis, Insights and Forecast - by Price Trend Analysis
- 9.1. Market Analysis, Insights and Forecast - by Production Analysis
- 10. Asia Pacific APAC Biofertilizers Market Analysis, Insights and Forecast, 2019-2031
- 10.1. Market Analysis, Insights and Forecast - by Production Analysis
- 10.2. Market Analysis, Insights and Forecast - by Consumption Analysis
- 10.3. Market Analysis, Insights and Forecast - by Import Market Analysis (Value & Volume)
- 10.4. Market Analysis, Insights and Forecast - by Export Market Analysis (Value & Volume)
- 10.5. Market Analysis, Insights and Forecast - by Price Trend Analysis
- 10.1. Market Analysis, Insights and Forecast - by Production Analysis
- 11. North America APAC Biofertilizers Market Analysis, Insights and Forecast, 2019-2031
- 11.1. Market Analysis, Insights and Forecast - By Country/Sub-region
- 11.1.1 United States
- 11.1.2 Canada
- 11.1.3 Mexico
- 12. Europe APAC Biofertilizers Market Analysis, Insights and Forecast, 2019-2031
- 12.1. Market Analysis, Insights and Forecast - By Country/Sub-region
- 12.1.1 Germany
- 12.1.2 United Kingdom
- 12.1.3 France
- 12.1.4 Spain
- 12.1.5 Italy
- 12.1.6 Spain
- 12.1.7 Belgium
- 12.1.8 Netherland
- 12.1.9 Nordics
- 12.1.10 Rest of Europe
- 13. Asia Pacific APAC Biofertilizers Market Analysis, Insights and Forecast, 2019-2031
- 13.1. Market Analysis, Insights and Forecast - By Country/Sub-region
- 13.1.1 China
- 13.1.2 Japan
- 13.1.3 India
- 13.1.4 South Korea
- 13.1.5 Taiwan
- 13.1.6 Australia
- 13.1.7 Rest of Asia-Pacific
- 14. South America APAC Biofertilizers Market Analysis, Insights and Forecast, 2019-2031
- 14.1. Market Analysis, Insights and Forecast - By Country/Sub-region
- 14.1.1 Brazil
- 14.1.2 Argentina
- 14.1.3 Peru
- 14.1.4 Chile
- 14.1.5 Colombia
- 14.1.6 Ecuador
- 14.1.7 Venezuela
- 14.1.8 Rest of South America
- 15. MEA APAC Biofertilizers Market Analysis, Insights and Forecast, 2019-2031
- 15.1. Market Analysis, Insights and Forecast - By Country/Sub-region
- 15.1.1 United Arab Emirates
- 15.1.2 Saudi Arabia
- 15.1.3 South Africa
- 15.1.4 Rest of Middle East and Africa
- 16. Competitive Analysis
- 16.1. Global Market Share Analysis 2024
- 16.2. Company Profiles
- 16.2.1 Australian Bio Fert Pty Ltd
- 16.2.1.1. Overview
- 16.2.1.2. Products
- 16.2.1.3. SWOT Analysis
- 16.2.1.4. Recent Developments
- 16.2.1.5. Financials (Based on Availability)
- 16.2.2 Criyagen Agri & Biotech Pvt Ltd
- 16.2.2.1. Overview
- 16.2.2.2. Products
- 16.2.2.3. SWOT Analysis
- 16.2.2.4. Recent Developments
- 16.2.2.5. Financials (Based on Availability)
- 16.2.3 Agri Life
- 16.2.3.1. Overview
- 16.2.3.2. Products
- 16.2.3.3. SWOT Analysis
- 16.2.3.4. Recent Developments
- 16.2.3.5. Financials (Based on Availability)
- 16.2.4 Kiwa Bio-Tech Products Group Corporation
- 16.2.4.1. Overview
- 16.2.4.2. Products
- 16.2.4.3. SWOT Analysis
- 16.2.4.4. Recent Developments
- 16.2.4.5. Financials (Based on Availability)
- 16.2.5 Symborg SL
- 16.2.5.1. Overview
- 16.2.5.2. Products
- 16.2.5.3. SWOT Analysis
- 16.2.5.4. Recent Developments
- 16.2.5.5. Financials (Based on Availability)
- 16.2.6 CBF China Biofertilizers AG
- 16.2.6.1. Overview
- 16.2.6.2. Products
- 16.2.6.3. SWOT Analysis
- 16.2.6.4. Recent Developments
- 16.2.6.5. Financials (Based on Availability)
- 16.2.7 Biomax Naturals
- 16.2.7.1. Overview
- 16.2.7.2. Products
- 16.2.7.3. SWOT Analysis
- 16.2.7.4. Recent Developments
- 16.2.7.5. Financials (Based on Availability)
- 16.2.8 Agrinos AS
- 16.2.8.1. Overview
- 16.2.8.2. Products
- 16.2.8.3. SWOT Analysis
- 16.2.8.4. Recent Developments
- 16.2.8.5. Financials (Based on Availability)
- 16.2.9 BioAg Pty Ltd
- 16.2.9.1. Overview
- 16.2.9.2. Products
- 16.2.9.3. SWOT Analysis
- 16.2.9.4. Recent Developments
- 16.2.9.5. Financials (Based on Availability)
- 16.2.10 Camson Biotechnologies Limited
- 16.2.10.1. Overview
- 16.2.10.2. Products
- 16.2.10.3. SWOT Analysis
- 16.2.10.4. Recent Developments
- 16.2.10.5. Financials (Based on Availability)
- 16.2.11 National Fertilizer Ltd
- 16.2.11.1. Overview
- 16.2.11.2. Products
- 16.2.11.3. SWOT Analysis
- 16.2.11.4. Recent Developments
- 16.2.11.5. Financials (Based on Availability)
- 16.2.1 Australian Bio Fert Pty Ltd
List of Figures
- Figure 1: Global APAC Biofertilizers Market Revenue Breakdown (Million, %) by Region 2024 & 2032
- Figure 2: Global APAC Biofertilizers Market Volume Breakdown (Kiloton, %) by Region 2024 & 2032
- Figure 3: North America APAC Biofertilizers Market Revenue (Million), by Country 2024 & 2032
- Figure 4: North America APAC Biofertilizers Market Volume (Kiloton), by Country 2024 & 2032
- Figure 5: North America APAC Biofertilizers Market Revenue Share (%), by Country 2024 & 2032
- Figure 6: North America APAC Biofertilizers Market Volume Share (%), by Country 2024 & 2032
- Figure 7: Europe APAC Biofertilizers Market Revenue (Million), by Country 2024 & 2032
- Figure 8: Europe APAC Biofertilizers Market Volume (Kiloton), by Country 2024 & 2032
- Figure 9: Europe APAC Biofertilizers Market Revenue Share (%), by Country 2024 & 2032
- Figure 10: Europe APAC Biofertilizers Market Volume Share (%), by Country 2024 & 2032
- Figure 11: Asia Pacific APAC Biofertilizers Market Revenue (Million), by Country 2024 & 2032
- Figure 12: Asia Pacific APAC Biofertilizers Market Volume (Kiloton), by Country 2024 & 2032
- Figure 13: Asia Pacific APAC Biofertilizers Market Revenue Share (%), by Country 2024 & 2032
- Figure 14: Asia Pacific APAC Biofertilizers Market Volume Share (%), by Country 2024 & 2032
- Figure 15: South America APAC Biofertilizers Market Revenue (Million), by Country 2024 & 2032
- Figure 16: South America APAC Biofertilizers Market Volume (Kiloton), by Country 2024 & 2032
- Figure 17: South America APAC Biofertilizers Market Revenue Share (%), by Country 2024 & 2032
- Figure 18: South America APAC Biofertilizers Market Volume Share (%), by Country 2024 & 2032
- Figure 19: MEA APAC Biofertilizers Market Revenue (Million), by Country 2024 & 2032
- Figure 20: MEA APAC Biofertilizers Market Volume (Kiloton), by Country 2024 & 2032
- Figure 21: MEA APAC Biofertilizers Market Revenue Share (%), by Country 2024 & 2032
- Figure 22: MEA APAC Biofertilizers Market Volume Share (%), by Country 2024 & 2032
- Figure 23: North America APAC Biofertilizers Market Revenue (Million), by Production Analysis 2024 & 2032
- Figure 24: North America APAC Biofertilizers Market Volume (Kiloton), by Production Analysis 2024 & 2032
- Figure 25: North America APAC Biofertilizers Market Revenue Share (%), by Production Analysis 2024 & 2032
- Figure 26: North America APAC Biofertilizers Market Volume Share (%), by Production Analysis 2024 & 2032
- Figure 27: North America APAC Biofertilizers Market Revenue (Million), by Consumption Analysis 2024 & 2032
- Figure 28: North America APAC Biofertilizers Market Volume (Kiloton), by Consumption Analysis 2024 & 2032
- Figure 29: North America APAC Biofertilizers Market Revenue Share (%), by Consumption Analysis 2024 & 2032
- Figure 30: North America APAC Biofertilizers Market Volume Share (%), by Consumption Analysis 2024 & 2032
- Figure 31: North America APAC Biofertilizers Market Revenue (Million), by Import Market Analysis (Value & Volume) 2024 & 2032
- Figure 32: North America APAC Biofertilizers Market Volume (Kiloton), by Import Market Analysis (Value & Volume) 2024 & 2032
- Figure 33: North America APAC Biofertilizers Market Revenue Share (%), by Import Market Analysis (Value & Volume) 2024 & 2032
- Figure 34: North America APAC Biofertilizers Market Volume Share (%), by Import Market Analysis (Value & Volume) 2024 & 2032
- Figure 35: North America APAC Biofertilizers Market Revenue (Million), by Export Market Analysis (Value & Volume) 2024 & 2032
- Figure 36: North America APAC Biofertilizers Market Volume (Kiloton), by Export Market Analysis (Value & Volume) 2024 & 2032
- Figure 37: North America APAC Biofertilizers Market Revenue Share (%), by Export Market Analysis (Value & Volume) 2024 & 2032
- Figure 38: North America APAC Biofertilizers Market Volume Share (%), by Export Market Analysis (Value & Volume) 2024 & 2032
- Figure 39: North America APAC Biofertilizers Market Revenue (Million), by Price Trend Analysis 2024 & 2032
- Figure 40: North America APAC Biofertilizers Market Volume (Kiloton), by Price Trend Analysis 2024 & 2032
- Figure 41: North America APAC Biofertilizers Market Revenue Share (%), by Price Trend Analysis 2024 & 2032
- Figure 42: North America APAC Biofertilizers Market Volume Share (%), by Price Trend Analysis 2024 & 2032
- Figure 43: North America APAC Biofertilizers Market Revenue (Million), by Country 2024 & 2032
- Figure 44: North America APAC Biofertilizers Market Volume (Kiloton), by Country 2024 & 2032
- Figure 45: North America APAC Biofertilizers Market Revenue Share (%), by Country 2024 & 2032
- Figure 46: North America APAC Biofertilizers Market Volume Share (%), by Country 2024 & 2032
- Figure 47: South America APAC Biofertilizers Market Revenue (Million), by Production Analysis 2024 & 2032
- Figure 48: South America APAC Biofertilizers Market Volume (Kiloton), by Production Analysis 2024 & 2032
- Figure 49: South America APAC Biofertilizers Market Revenue Share (%), by Production Analysis 2024 & 2032
- Figure 50: South America APAC Biofertilizers Market Volume Share (%), by Production Analysis 2024 & 2032
- Figure 51: South America APAC Biofertilizers Market Revenue (Million), by Consumption Analysis 2024 & 2032
- Figure 52: South America APAC Biofertilizers Market Volume (Kiloton), by Consumption Analysis 2024 & 2032
- Figure 53: South America APAC Biofertilizers Market Revenue Share (%), by Consumption Analysis 2024 & 2032
- Figure 54: South America APAC Biofertilizers Market Volume Share (%), by Consumption Analysis 2024 & 2032
- Figure 55: South America APAC Biofertilizers Market Revenue (Million), by Import Market Analysis (Value & Volume) 2024 & 2032
- Figure 56: South America APAC Biofertilizers Market Volume (Kiloton), by Import Market Analysis (Value & Volume) 2024 & 2032
- Figure 57: South America APAC Biofertilizers Market Revenue Share (%), by Import Market Analysis (Value & Volume) 2024 & 2032
- Figure 58: South America APAC Biofertilizers Market Volume Share (%), by Import Market Analysis (Value & Volume) 2024 & 2032
- Figure 59: South America APAC Biofertilizers Market Revenue (Million), by Export Market Analysis (Value & Volume) 2024 & 2032
- Figure 60: South America APAC Biofertilizers Market Volume (Kiloton), by Export Market Analysis (Value & Volume) 2024 & 2032
- Figure 61: South America APAC Biofertilizers Market Revenue Share (%), by Export Market Analysis (Value & Volume) 2024 & 2032
- Figure 62: South America APAC Biofertilizers Market Volume Share (%), by Export Market Analysis (Value & Volume) 2024 & 2032
- Figure 63: South America APAC Biofertilizers Market Revenue (Million), by Price Trend Analysis 2024 & 2032
- Figure 64: South America APAC Biofertilizers Market Volume (Kiloton), by Price Trend Analysis 2024 & 2032
- Figure 65: South America APAC Biofertilizers Market Revenue Share (%), by Price Trend Analysis 2024 & 2032
- Figure 66: South America APAC Biofertilizers Market Volume Share (%), by Price Trend Analysis 2024 & 2032
- Figure 67: South America APAC Biofertilizers Market Revenue (Million), by Country 2024 & 2032
- Figure 68: South America APAC Biofertilizers Market Volume (Kiloton), by Country 2024 & 2032
- Figure 69: South America APAC Biofertilizers Market Revenue Share (%), by Country 2024 & 2032
- Figure 70: South America APAC Biofertilizers Market Volume Share (%), by Country 2024 & 2032
- Figure 71: Europe APAC Biofertilizers Market Revenue (Million), by Production Analysis 2024 & 2032
- Figure 72: Europe APAC Biofertilizers Market Volume (Kiloton), by Production Analysis 2024 & 2032
- Figure 73: Europe APAC Biofertilizers Market Revenue Share (%), by Production Analysis 2024 & 2032
- Figure 74: Europe APAC Biofertilizers Market Volume Share (%), by Production Analysis 2024 & 2032
- Figure 75: Europe APAC Biofertilizers Market Revenue (Million), by Consumption Analysis 2024 & 2032
- Figure 76: Europe APAC Biofertilizers Market Volume (Kiloton), by Consumption Analysis 2024 & 2032
- Figure 77: Europe APAC Biofertilizers Market Revenue Share (%), by Consumption Analysis 2024 & 2032
- Figure 78: Europe APAC Biofertilizers Market Volume Share (%), by Consumption Analysis 2024 & 2032
- Figure 79: Europe APAC Biofertilizers Market Revenue (Million), by Import Market Analysis (Value & Volume) 2024 & 2032
- Figure 80: Europe APAC Biofertilizers Market Volume (Kiloton), by Import Market Analysis (Value & Volume) 2024 & 2032
- Figure 81: Europe APAC Biofertilizers Market Revenue Share (%), by Import Market Analysis (Value & Volume) 2024 & 2032
- Figure 82: Europe APAC Biofertilizers Market Volume Share (%), by Import Market Analysis (Value & Volume) 2024 & 2032
- Figure 83: Europe APAC Biofertilizers Market Revenue (Million), by Export Market Analysis (Value & Volume) 2024 & 2032
- Figure 84: Europe APAC Biofertilizers Market Volume (Kiloton), by Export Market Analysis (Value & Volume) 2024 & 2032
- Figure 85: Europe APAC Biofertilizers Market Revenue Share (%), by Export Market Analysis (Value & Volume) 2024 & 2032
- Figure 86: Europe APAC Biofertilizers Market Volume Share (%), by Export Market Analysis (Value & Volume) 2024 & 2032
- Figure 87: Europe APAC Biofertilizers Market Revenue (Million), by Price Trend Analysis 2024 & 2032
- Figure 88: Europe APAC Biofertilizers Market Volume (Kiloton), by Price Trend Analysis 2024 & 2032
- Figure 89: Europe APAC Biofertilizers Market Revenue Share (%), by Price Trend Analysis 2024 & 2032
- Figure 90: Europe APAC Biofertilizers Market Volume Share (%), by Price Trend Analysis 2024 & 2032
- Figure 91: Europe APAC Biofertilizers Market Revenue (Million), by Country 2024 & 2032
- Figure 92: Europe APAC Biofertilizers Market Volume (Kiloton), by Country 2024 & 2032
- Figure 93: Europe APAC Biofertilizers Market Revenue Share (%), by Country 2024 & 2032
- Figure 94: Europe APAC Biofertilizers Market Volume Share (%), by Country 2024 & 2032
- Figure 95: Middle East & Africa APAC Biofertilizers Market Revenue (Million), by Production Analysis 2024 & 2032
- Figure 96: Middle East & Africa APAC Biofertilizers Market Volume (Kiloton), by Production Analysis 2024 & 2032
- Figure 97: Middle East & Africa APAC Biofertilizers Market Revenue Share (%), by Production Analysis 2024 & 2032
- Figure 98: Middle East & Africa APAC Biofertilizers Market Volume Share (%), by Production Analysis 2024 & 2032
- Figure 99: Middle East & Africa APAC Biofertilizers Market Revenue (Million), by Consumption Analysis 2024 & 2032
- Figure 100: Middle East & Africa APAC Biofertilizers Market Volume (Kiloton), by Consumption Analysis 2024 & 2032
- Figure 101: Middle East & Africa APAC Biofertilizers Market Revenue Share (%), by Consumption Analysis 2024 & 2032
- Figure 102: Middle East & Africa APAC Biofertilizers Market Volume Share (%), by Consumption Analysis 2024 & 2032
- Figure 103: Middle East & Africa APAC Biofertilizers Market Revenue (Million), by Import Market Analysis (Value & Volume) 2024 & 2032
- Figure 104: Middle East & Africa APAC Biofertilizers Market Volume (Kiloton), by Import Market Analysis (Value & Volume) 2024 & 2032
- Figure 105: Middle East & Africa APAC Biofertilizers Market Revenue Share (%), by Import Market Analysis (Value & Volume) 2024 & 2032
- Figure 106: Middle East & Africa APAC Biofertilizers Market Volume Share (%), by Import Market Analysis (Value & Volume) 2024 & 2032
- Figure 107: Middle East & Africa APAC Biofertilizers Market Revenue (Million), by Export Market Analysis (Value & Volume) 2024 & 2032
- Figure 108: Middle East & Africa APAC Biofertilizers Market Volume (Kiloton), by Export Market Analysis (Value & Volume) 2024 & 2032
- Figure 109: Middle East & Africa APAC Biofertilizers Market Revenue Share (%), by Export Market Analysis (Value & Volume) 2024 & 2032
- Figure 110: Middle East & Africa APAC Biofertilizers Market Volume Share (%), by Export Market Analysis (Value & Volume) 2024 & 2032
- Figure 111: Middle East & Africa APAC Biofertilizers Market Revenue (Million), by Price Trend Analysis 2024 & 2032
- Figure 112: Middle East & Africa APAC Biofertilizers Market Volume (Kiloton), by Price Trend Analysis 2024 & 2032
- Figure 113: Middle East & Africa APAC Biofertilizers Market Revenue Share (%), by Price Trend Analysis 2024 & 2032
- Figure 114: Middle East & Africa APAC Biofertilizers Market Volume Share (%), by Price Trend Analysis 2024 & 2032
- Figure 115: Middle East & Africa APAC Biofertilizers Market Revenue (Million), by Country 2024 & 2032
- Figure 116: Middle East & Africa APAC Biofertilizers Market Volume (Kiloton), by Country 2024 & 2032
- Figure 117: Middle East & Africa APAC Biofertilizers Market Revenue Share (%), by Country 2024 & 2032
- Figure 118: Middle East & Africa APAC Biofertilizers Market Volume Share (%), by Country 2024 & 2032
- Figure 119: Asia Pacific APAC Biofertilizers Market Revenue (Million), by Production Analysis 2024 & 2032
- Figure 120: Asia Pacific APAC Biofertilizers Market Volume (Kiloton), by Production Analysis 2024 & 2032
- Figure 121: Asia Pacific APAC Biofertilizers Market Revenue Share (%), by Production Analysis 2024 & 2032
- Figure 122: Asia Pacific APAC Biofertilizers Market Volume Share (%), by Production Analysis 2024 & 2032
- Figure 123: Asia Pacific APAC Biofertilizers Market Revenue (Million), by Consumption Analysis 2024 & 2032
- Figure 124: Asia Pacific APAC Biofertilizers Market Volume (Kiloton), by Consumption Analysis 2024 & 2032
- Figure 125: Asia Pacific APAC Biofertilizers Market Revenue Share (%), by Consumption Analysis 2024 & 2032
- Figure 126: Asia Pacific APAC Biofertilizers Market Volume Share (%), by Consumption Analysis 2024 & 2032
- Figure 127: Asia Pacific APAC Biofertilizers Market Revenue (Million), by Import Market Analysis (Value & Volume) 2024 & 2032
- Figure 128: Asia Pacific APAC Biofertilizers Market Volume (Kiloton), by Import Market Analysis (Value & Volume) 2024 & 2032
- Figure 129: Asia Pacific APAC Biofertilizers Market Revenue Share (%), by Import Market Analysis (Value & Volume) 2024 & 2032
- Figure 130: Asia Pacific APAC Biofertilizers Market Volume Share (%), by Import Market Analysis (Value & Volume) 2024 & 2032
- Figure 131: Asia Pacific APAC Biofertilizers Market Revenue (Million), by Export Market Analysis (Value & Volume) 2024 & 2032
- Figure 132: Asia Pacific APAC Biofertilizers Market Volume (Kiloton), by Export Market Analysis (Value & Volume) 2024 & 2032
- Figure 133: Asia Pacific APAC Biofertilizers Market Revenue Share (%), by Export Market Analysis (Value & Volume) 2024 & 2032
- Figure 134: Asia Pacific APAC Biofertilizers Market Volume Share (%), by Export Market Analysis (Value & Volume) 2024 & 2032
- Figure 135: Asia Pacific APAC Biofertilizers Market Revenue (Million), by Price Trend Analysis 2024 & 2032
- Figure 136: Asia Pacific APAC Biofertilizers Market Volume (Kiloton), by Price Trend Analysis 2024 & 2032
- Figure 137: Asia Pacific APAC Biofertilizers Market Revenue Share (%), by Price Trend Analysis 2024 & 2032
- Figure 138: Asia Pacific APAC Biofertilizers Market Volume Share (%), by Price Trend Analysis 2024 & 2032
- Figure 139: Asia Pacific APAC Biofertilizers Market Revenue (Million), by Country 2024 & 2032
- Figure 140: Asia Pacific APAC Biofertilizers Market Volume (Kiloton), by Country 2024 & 2032
- Figure 141: Asia Pacific APAC Biofertilizers Market Revenue Share (%), by Country 2024 & 2032
- Figure 142: Asia Pacific APAC Biofertilizers Market Volume Share (%), by Country 2024 & 2032
List of Tables
- Table 1: Global APAC Biofertilizers Market Revenue Million Forecast, by Region 2019 & 2032
- Table 2: Global APAC Biofertilizers Market Volume Kiloton Forecast, by Region 2019 & 2032
- Table 3: Global APAC Biofertilizers Market Revenue Million Forecast, by Production Analysis 2019 & 2032
- Table 4: Global APAC Biofertilizers Market Volume Kiloton Forecast, by Production Analysis 2019 & 2032
- Table 5: Global APAC Biofertilizers Market Revenue Million Forecast, by Consumption Analysis 2019 & 2032
- Table 6: Global APAC Biofertilizers Market Volume Kiloton Forecast, by Consumption Analysis 2019 & 2032
- Table 7: Global APAC Biofertilizers Market Revenue Million Forecast, by Import Market Analysis (Value & Volume) 2019 & 2032
- Table 8: Global APAC Biofertilizers Market Volume Kiloton Forecast, by Import Market Analysis (Value & Volume) 2019 & 2032
- Table 9: Global APAC Biofertilizers Market Revenue Million Forecast, by Export Market Analysis (Value & Volume) 2019 & 2032
- Table 10: Global APAC Biofertilizers Market Volume Kiloton Forecast, by Export Market Analysis (Value & Volume) 2019 & 2032
- Table 11: Global APAC Biofertilizers Market Revenue Million Forecast, by Price Trend Analysis 2019 & 2032
- Table 12: Global APAC Biofertilizers Market Volume Kiloton Forecast, by Price Trend Analysis 2019 & 2032
- Table 13: Global APAC Biofertilizers Market Revenue Million Forecast, by Region 2019 & 2032
- Table 14: Global APAC Biofertilizers Market Volume Kiloton Forecast, by Region 2019 & 2032
- Table 15: Global APAC Biofertilizers Market Revenue Million Forecast, by Country 2019 & 2032
- Table 16: Global APAC Biofertilizers Market Volume Kiloton Forecast, by Country 2019 & 2032
- Table 17: United States APAC Biofertilizers Market Revenue (Million) Forecast, by Application 2019 & 2032
- Table 18: United States APAC Biofertilizers Market Volume (Kiloton) Forecast, by Application 2019 & 2032
- Table 19: Canada APAC Biofertilizers Market Revenue (Million) Forecast, by Application 2019 & 2032
- Table 20: Canada APAC Biofertilizers Market Volume (Kiloton) Forecast, by Application 2019 & 2032
- Table 21: Mexico APAC Biofertilizers Market Revenue (Million) Forecast, by Application 2019 & 2032
- Table 22: Mexico APAC Biofertilizers Market Volume (Kiloton) Forecast, by Application 2019 & 2032
- Table 23: Global APAC Biofertilizers Market Revenue Million Forecast, by Country 2019 & 2032
- Table 24: Global APAC Biofertilizers Market Volume Kiloton Forecast, by Country 2019 & 2032
- Table 25: Germany APAC Biofertilizers Market Revenue (Million) Forecast, by Application 2019 & 2032
- Table 26: Germany APAC Biofertilizers Market Volume (Kiloton) Forecast, by Application 2019 & 2032
- Table 27: United Kingdom APAC Biofertilizers Market Revenue (Million) Forecast, by Application 2019 & 2032
- Table 28: United Kingdom APAC Biofertilizers Market Volume (Kiloton) Forecast, by Application 2019 & 2032
- Table 29: France APAC Biofertilizers Market Revenue (Million) Forecast, by Application 2019 & 2032
- Table 30: France APAC Biofertilizers Market Volume (Kiloton) Forecast, by Application 2019 & 2032
- Table 31: Spain APAC Biofertilizers Market Revenue (Million) Forecast, by Application 2019 & 2032
- Table 32: Spain APAC Biofertilizers Market Volume (Kiloton) Forecast, by Application 2019 & 2032
- Table 33: Italy APAC Biofertilizers Market Revenue (Million) Forecast, by Application 2019 & 2032
- Table 34: Italy APAC Biofertilizers Market Volume (Kiloton) Forecast, by Application 2019 & 2032
- Table 35: Spain APAC Biofertilizers Market Revenue (Million) Forecast, by Application 2019 & 2032
- Table 36: Spain APAC Biofertilizers Market Volume (Kiloton) Forecast, by Application 2019 & 2032
- Table 37: Belgium APAC Biofertilizers Market Revenue (Million) Forecast, by Application 2019 & 2032
- Table 38: Belgium APAC Biofertilizers Market Volume (Kiloton) Forecast, by Application 2019 & 2032
- Table 39: Netherland APAC Biofertilizers Market Revenue (Million) Forecast, by Application 2019 & 2032
- Table 40: Netherland APAC Biofertilizers Market Volume (Kiloton) Forecast, by Application 2019 & 2032
- Table 41: Nordics APAC Biofertilizers Market Revenue (Million) Forecast, by Application 2019 & 2032
- Table 42: Nordics APAC Biofertilizers Market Volume (Kiloton) Forecast, by Application 2019 & 2032
- Table 43: Rest of Europe APAC Biofertilizers Market Revenue (Million) Forecast, by Application 2019 & 2032
- Table 44: Rest of Europe APAC Biofertilizers Market Volume (Kiloton) Forecast, by Application 2019 & 2032
- Table 45: Global APAC Biofertilizers Market Revenue Million Forecast, by Country 2019 & 2032
- Table 46: Global APAC Biofertilizers Market Volume Kiloton Forecast, by Country 2019 & 2032
- Table 47: China APAC Biofertilizers Market Revenue (Million) Forecast, by Application 2019 & 2032
- Table 48: China APAC Biofertilizers Market Volume (Kiloton) Forecast, by Application 2019 & 2032
- Table 49: Japan APAC Biofertilizers Market Revenue (Million) Forecast, by Application 2019 & 2032
- Table 50: Japan APAC Biofertilizers Market Volume (Kiloton) Forecast, by Application 2019 & 2032
- Table 51: India APAC Biofertilizers Market Revenue (Million) Forecast, by Application 2019 & 2032
- Table 52: India APAC Biofertilizers Market Volume (Kiloton) Forecast, by Application 2019 & 2032
- Table 53: South Korea APAC Biofertilizers Market Revenue (Million) Forecast, by Application 2019 & 2032
- Table 54: South Korea APAC Biofertilizers Market Volume (Kiloton) Forecast, by Application 2019 & 2032
- Table 55: Taiwan APAC Biofertilizers Market Revenue (Million) Forecast, by Application 2019 & 2032
- Table 56: Taiwan APAC Biofertilizers Market Volume (Kiloton) Forecast, by Application 2019 & 2032
- Table 57: Australia APAC Biofertilizers Market Revenue (Million) Forecast, by Application 2019 & 2032
- Table 58: Australia APAC Biofertilizers Market Volume (Kiloton) Forecast, by Application 2019 & 2032
- Table 59: Rest of Asia-Pacific APAC Biofertilizers Market Revenue (Million) Forecast, by Application 2019 & 2032
- Table 60: Rest of Asia-Pacific APAC Biofertilizers Market Volume (Kiloton) Forecast, by Application 2019 & 2032
- Table 61: Global APAC Biofertilizers Market Revenue Million Forecast, by Country 2019 & 2032
- Table 62: Global APAC Biofertilizers Market Volume Kiloton Forecast, by Country 2019 & 2032
- Table 63: Brazil APAC Biofertilizers Market Revenue (Million) Forecast, by Application 2019 & 2032
- Table 64: Brazil APAC Biofertilizers Market Volume (Kiloton) Forecast, by Application 2019 & 2032
- Table 65: Argentina APAC Biofertilizers Market Revenue (Million) Forecast, by Application 2019 & 2032
- Table 66: Argentina APAC Biofertilizers Market Volume (Kiloton) Forecast, by Application 2019 & 2032
- Table 67: Peru APAC Biofertilizers Market Revenue (Million) Forecast, by Application 2019 & 2032
- Table 68: Peru APAC Biofertilizers Market Volume (Kiloton) Forecast, by Application 2019 & 2032
- Table 69: Chile APAC Biofertilizers Market Revenue (Million) Forecast, by Application 2019 & 2032
- Table 70: Chile APAC Biofertilizers Market Volume (Kiloton) Forecast, by Application 2019 & 2032
- Table 71: Colombia APAC Biofertilizers Market Revenue (Million) Forecast, by Application 2019 & 2032
- Table 72: Colombia APAC Biofertilizers Market Volume (Kiloton) Forecast, by Application 2019 & 2032
- Table 73: Ecuador APAC Biofertilizers Market Revenue (Million) Forecast, by Application 2019 & 2032
- Table 74: Ecuador APAC Biofertilizers Market Volume (Kiloton) Forecast, by Application 2019 & 2032
- Table 75: Venezuela APAC Biofertilizers Market Revenue (Million) Forecast, by Application 2019 & 2032
- Table 76: Venezuela APAC Biofertilizers Market Volume (Kiloton) Forecast, by Application 2019 & 2032
- Table 77: Rest of South America APAC Biofertilizers Market Revenue (Million) Forecast, by Application 2019 & 2032
- Table 78: Rest of South America APAC Biofertilizers Market Volume (Kiloton) Forecast, by Application 2019 & 2032
- Table 79: Global APAC Biofertilizers Market Revenue Million Forecast, by Country 2019 & 2032
- Table 80: Global APAC Biofertilizers Market Volume Kiloton Forecast, by Country 2019 & 2032
- Table 81: United Arab Emirates APAC Biofertilizers Market Revenue (Million) Forecast, by Application 2019 & 2032
- Table 82: United Arab Emirates APAC Biofertilizers Market Volume (Kiloton) Forecast, by Application 2019 & 2032
- Table 83: Saudi Arabia APAC Biofertilizers Market Revenue (Million) Forecast, by Application 2019 & 2032
- Table 84: Saudi Arabia APAC Biofertilizers Market Volume (Kiloton) Forecast, by Application 2019 & 2032
- Table 85: South Africa APAC Biofertilizers Market Revenue (Million) Forecast, by Application 2019 & 2032
- Table 86: South Africa APAC Biofertilizers Market Volume (Kiloton) Forecast, by Application 2019 & 2032
- Table 87: Rest of Middle East and Africa APAC Biofertilizers Market Revenue (Million) Forecast, by Application 2019 & 2032
- Table 88: Rest of Middle East and Africa APAC Biofertilizers Market Volume (Kiloton) Forecast, by Application 2019 & 2032
- Table 89: Global APAC Biofertilizers Market Revenue Million Forecast, by Production Analysis 2019 & 2032
- Table 90: Global APAC Biofertilizers Market Volume Kiloton Forecast, by Production Analysis 2019 & 2032
- Table 91: Global APAC Biofertilizers Market Revenue Million Forecast, by Consumption Analysis 2019 & 2032
- Table 92: Global APAC Biofertilizers Market Volume Kiloton Forecast, by Consumption Analysis 2019 & 2032
- Table 93: Global APAC Biofertilizers Market Revenue Million Forecast, by Import Market Analysis (Value & Volume) 2019 & 2032
- Table 94: Global APAC Biofertilizers Market Volume Kiloton Forecast, by Import Market Analysis (Value & Volume) 2019 & 2032
- Table 95: Global APAC Biofertilizers Market Revenue Million Forecast, by Export Market Analysis (Value & Volume) 2019 & 2032
- Table 96: Global APAC Biofertilizers Market Volume Kiloton Forecast, by Export Market Analysis (Value & Volume) 2019 & 2032
- Table 97: Global APAC Biofertilizers Market Revenue Million Forecast, by Price Trend Analysis 2019 & 2032
- Table 98: Global APAC Biofertilizers Market Volume Kiloton Forecast, by Price Trend Analysis 2019 & 2032
- Table 99: Global APAC Biofertilizers Market Revenue Million Forecast, by Country 2019 & 2032
- Table 100: Global APAC Biofertilizers Market Volume Kiloton Forecast, by Country 2019 & 2032
- Table 101: United States APAC Biofertilizers Market Revenue (Million) Forecast, by Application 2019 & 2032
- Table 102: United States APAC Biofertilizers Market Volume (Kiloton) Forecast, by Application 2019 & 2032
- Table 103: Canada APAC Biofertilizers Market Revenue (Million) Forecast, by Application 2019 & 2032
- Table 104: Canada APAC Biofertilizers Market Volume (Kiloton) Forecast, by Application 2019 & 2032
- Table 105: Mexico APAC Biofertilizers Market Revenue (Million) Forecast, by Application 2019 & 2032
- Table 106: Mexico APAC Biofertilizers Market Volume (Kiloton) Forecast, by Application 2019 & 2032
- Table 107: Global APAC Biofertilizers Market Revenue Million Forecast, by Production Analysis 2019 & 2032
- Table 108: Global APAC Biofertilizers Market Volume Kiloton Forecast, by Production Analysis 2019 & 2032
- Table 109: Global APAC Biofertilizers Market Revenue Million Forecast, by Consumption Analysis 2019 & 2032
- Table 110: Global APAC Biofertilizers Market Volume Kiloton Forecast, by Consumption Analysis 2019 & 2032
- Table 111: Global APAC Biofertilizers Market Revenue Million Forecast, by Import Market Analysis (Value & Volume) 2019 & 2032
- Table 112: Global APAC Biofertilizers Market Volume Kiloton Forecast, by Import Market Analysis (Value & Volume) 2019 & 2032
- Table 113: Global APAC Biofertilizers Market Revenue Million Forecast, by Export Market Analysis (Value & Volume) 2019 & 2032
- Table 114: Global APAC Biofertilizers Market Volume Kiloton Forecast, by Export Market Analysis (Value & Volume) 2019 & 2032
- Table 115: Global APAC Biofertilizers Market Revenue Million Forecast, by Price Trend Analysis 2019 & 2032
- Table 116: Global APAC Biofertilizers Market Volume Kiloton Forecast, by Price Trend Analysis 2019 & 2032
- Table 117: Global APAC Biofertilizers Market Revenue Million Forecast, by Country 2019 & 2032
- Table 118: Global APAC Biofertilizers Market Volume Kiloton Forecast, by Country 2019 & 2032
- Table 119: Brazil APAC Biofertilizers Market Revenue (Million) Forecast, by Application 2019 & 2032
- Table 120: Brazil APAC Biofertilizers Market Volume (Kiloton) Forecast, by Application 2019 & 2032
- Table 121: Argentina APAC Biofertilizers Market Revenue (Million) Forecast, by Application 2019 & 2032
- Table 122: Argentina APAC Biofertilizers Market Volume (Kiloton) Forecast, by Application 2019 & 2032
- Table 123: Rest of South America APAC Biofertilizers Market Revenue (Million) Forecast, by Application 2019 & 2032
- Table 124: Rest of South America APAC Biofertilizers Market Volume (Kiloton) Forecast, by Application 2019 & 2032
- Table 125: Global APAC Biofertilizers Market Revenue Million Forecast, by Production Analysis 2019 & 2032
- Table 126: Global APAC Biofertilizers Market Volume Kiloton Forecast, by Production Analysis 2019 & 2032
- Table 127: Global APAC Biofertilizers Market Revenue Million Forecast, by Consumption Analysis 2019 & 2032
- Table 128: Global APAC Biofertilizers Market Volume Kiloton Forecast, by Consumption Analysis 2019 & 2032
- Table 129: Global APAC Biofertilizers Market Revenue Million Forecast, by Import Market Analysis (Value & Volume) 2019 & 2032
- Table 130: Global APAC Biofertilizers Market Volume Kiloton Forecast, by Import Market Analysis (Value & Volume) 2019 & 2032
- Table 131: Global APAC Biofertilizers Market Revenue Million Forecast, by Export Market Analysis (Value & Volume) 2019 & 2032
- Table 132: Global APAC Biofertilizers Market Volume Kiloton Forecast, by Export Market Analysis (Value & Volume) 2019 & 2032
- Table 133: Global APAC Biofertilizers Market Revenue Million Forecast, by Price Trend Analysis 2019 & 2032
- Table 134: Global APAC Biofertilizers Market Volume Kiloton Forecast, by Price Trend Analysis 2019 & 2032
- Table 135: Global APAC Biofertilizers Market Revenue Million Forecast, by Country 2019 & 2032
- Table 136: Global APAC Biofertilizers Market Volume Kiloton Forecast, by Country 2019 & 2032
- Table 137: United Kingdom APAC Biofertilizers Market Revenue (Million) Forecast, by Application 2019 & 2032
- Table 138: United Kingdom APAC Biofertilizers Market Volume (Kiloton) Forecast, by Application 2019 & 2032
- Table 139: Germany APAC Biofertilizers Market Revenue (Million) Forecast, by Application 2019 & 2032
- Table 140: Germany APAC Biofertilizers Market Volume (Kiloton) Forecast, by Application 2019 & 2032
- Table 141: France APAC Biofertilizers Market Revenue (Million) Forecast, by Application 2019 & 2032
- Table 142: France APAC Biofertilizers Market Volume (Kiloton) Forecast, by Application 2019 & 2032
- Table 143: Italy APAC Biofertilizers Market Revenue (Million) Forecast, by Application 2019 & 2032
- Table 144: Italy APAC Biofertilizers Market Volume (Kiloton) Forecast, by Application 2019 & 2032
- Table 145: Spain APAC Biofertilizers Market Revenue (Million) Forecast, by Application 2019 & 2032
- Table 146: Spain APAC Biofertilizers Market Volume (Kiloton) Forecast, by Application 2019 & 2032
- Table 147: Russia APAC Biofertilizers Market Revenue (Million) Forecast, by Application 2019 & 2032
- Table 148: Russia APAC Biofertilizers Market Volume (Kiloton) Forecast, by Application 2019 & 2032
- Table 149: Benelux APAC Biofertilizers Market Revenue (Million) Forecast, by Application 2019 & 2032
- Table 150: Benelux APAC Biofertilizers Market Volume (Kiloton) Forecast, by Application 2019 & 2032
- Table 151: Nordics APAC Biofertilizers Market Revenue (Million) Forecast, by Application 2019 & 2032
- Table 152: Nordics APAC Biofertilizers Market Volume (Kiloton) Forecast, by Application 2019 & 2032
- Table 153: Rest of Europe APAC Biofertilizers Market Revenue (Million) Forecast, by Application 2019 & 2032
- Table 154: Rest of Europe APAC Biofertilizers Market Volume (Kiloton) Forecast, by Application 2019 & 2032
- Table 155: Global APAC Biofertilizers Market Revenue Million Forecast, by Production Analysis 2019 & 2032
- Table 156: Global APAC Biofertilizers Market Volume Kiloton Forecast, by Production Analysis 2019 & 2032
- Table 157: Global APAC Biofertilizers Market Revenue Million Forecast, by Consumption Analysis 2019 & 2032
- Table 158: Global APAC Biofertilizers Market Volume Kiloton Forecast, by Consumption Analysis 2019 & 2032
- Table 159: Global APAC Biofertilizers Market Revenue Million Forecast, by Import Market Analysis (Value & Volume) 2019 & 2032
- Table 160: Global APAC Biofertilizers Market Volume Kiloton Forecast, by Import Market Analysis (Value & Volume) 2019 & 2032
- Table 161: Global APAC Biofertilizers Market Revenue Million Forecast, by Export Market Analysis (Value & Volume) 2019 & 2032
- Table 162: Global APAC Biofertilizers Market Volume Kiloton Forecast, by Export Market Analysis (Value & Volume) 2019 & 2032
- Table 163: Global APAC Biofertilizers Market Revenue Million Forecast, by Price Trend Analysis 2019 & 2032
- Table 164: Global APAC Biofertilizers Market Volume Kiloton Forecast, by Price Trend Analysis 2019 & 2032
- Table 165: Global APAC Biofertilizers Market Revenue Million Forecast, by Country 2019 & 2032
- Table 166: Global APAC Biofertilizers Market Volume Kiloton Forecast, by Country 2019 & 2032
- Table 167: Turkey APAC Biofertilizers Market Revenue (Million) Forecast, by Application 2019 & 2032
- Table 168: Turkey APAC Biofertilizers Market Volume (Kiloton) Forecast, by Application 2019 & 2032
- Table 169: Israel APAC Biofertilizers Market Revenue (Million) Forecast, by Application 2019 & 2032
- Table 170: Israel APAC Biofertilizers Market Volume (Kiloton) Forecast, by Application 2019 & 2032
- Table 171: GCC APAC Biofertilizers Market Revenue (Million) Forecast, by Application 2019 & 2032
- Table 172: GCC APAC Biofertilizers Market Volume (Kiloton) Forecast, by Application 2019 & 2032
- Table 173: North Africa APAC Biofertilizers Market Revenue (Million) Forecast, by Application 2019 & 2032
- Table 174: North Africa APAC Biofertilizers Market Volume (Kiloton) Forecast, by Application 2019 & 2032
- Table 175: South Africa APAC Biofertilizers Market Revenue (Million) Forecast, by Application 2019 & 2032
- Table 176: South Africa APAC Biofertilizers Market Volume (Kiloton) Forecast, by Application 2019 & 2032
- Table 177: Rest of Middle East & Africa APAC Biofertilizers Market Revenue (Million) Forecast, by Application 2019 & 2032
- Table 178: Rest of Middle East & Africa APAC Biofertilizers Market Volume (Kiloton) Forecast, by Application 2019 & 2032
- Table 179: Global APAC Biofertilizers Market Revenue Million Forecast, by Production Analysis 2019 & 2032
- Table 180: Global APAC Biofertilizers Market Volume Kiloton Forecast, by Production Analysis 2019 & 2032
- Table 181: Global APAC Biofertilizers Market Revenue Million Forecast, by Consumption Analysis 2019 & 2032
- Table 182: Global APAC Biofertilizers Market Volume Kiloton Forecast, by Consumption Analysis 2019 & 2032
- Table 183: Global APAC Biofertilizers Market Revenue Million Forecast, by Import Market Analysis (Value & Volume) 2019 & 2032
- Table 184: Global APAC Biofertilizers Market Volume Kiloton Forecast, by Import Market Analysis (Value & Volume) 2019 & 2032
- Table 185: Global APAC Biofertilizers Market Revenue Million Forecast, by Export Market Analysis (Value & Volume) 2019 & 2032
- Table 186: Global APAC Biofertilizers Market Volume Kiloton Forecast, by Export Market Analysis (Value & Volume) 2019 & 2032
- Table 187: Global APAC Biofertilizers Market Revenue Million Forecast, by Price Trend Analysis 2019 & 2032
- Table 188: Global APAC Biofertilizers Market Volume Kiloton Forecast, by Price Trend Analysis 2019 & 2032
- Table 189: Global APAC Biofertilizers Market Revenue Million Forecast, by Country 2019 & 2032
- Table 190: Global APAC Biofertilizers Market Volume Kiloton Forecast, by Country 2019 & 2032
- Table 191: China APAC Biofertilizers Market Revenue (Million) Forecast, by Application 2019 & 2032
- Table 192: China APAC Biofertilizers Market Volume (Kiloton) Forecast, by Application 2019 & 2032
- Table 193: India APAC Biofertilizers Market Revenue (Million) Forecast, by Application 2019 & 2032
- Table 194: India APAC Biofertilizers Market Volume (Kiloton) Forecast, by Application 2019 & 2032
- Table 195: Japan APAC Biofertilizers Market Revenue (Million) Forecast, by Application 2019 & 2032
- Table 196: Japan APAC Biofertilizers Market Volume (Kiloton) Forecast, by Application 2019 & 2032
- Table 197: South Korea APAC Biofertilizers Market Revenue (Million) Forecast, by Application 2019 & 2032
- Table 198: South Korea APAC Biofertilizers Market Volume (Kiloton) Forecast, by Application 2019 & 2032
- Table 199: ASEAN APAC Biofertilizers Market Revenue (Million) Forecast, by Application 2019 & 2032
- Table 200: ASEAN APAC Biofertilizers Market Volume (Kiloton) Forecast, by Application 2019 & 2032
- Table 201: Oceania APAC Biofertilizers Market Revenue (Million) Forecast, by Application 2019 & 2032
- Table 202: Oceania APAC Biofertilizers Market Volume (Kiloton) Forecast, by Application 2019 & 2032
- Table 203: Rest of Asia Pacific APAC Biofertilizers Market Revenue (Million) Forecast, by Application 2019 & 2032
- Table 204: Rest of Asia Pacific APAC Biofertilizers Market Volume (Kiloton) Forecast, by Application 2019 & 2032
Frequently Asked Questions
1. What is the projected Compound Annual Growth Rate (CAGR) of the APAC Biofertilizers Market?
The projected CAGR is approximately 10.80%.
2. Which companies are prominent players in the APAC Biofertilizers Market?
Key companies in the market include Australian Bio Fert Pty Ltd, Criyagen Agri & Biotech Pvt Ltd, Agri Life, Kiwa Bio-Tech Products Group Corporation, Symborg SL, CBF China Biofertilizers AG, Biomax Naturals, Agrinos AS, BioAg Pty Ltd, Camson Biotechnologies Limited, National Fertilizer Ltd.
3. What are the main segments of the APAC Biofertilizers Market?
The market segments include Production Analysis, Consumption Analysis, Import Market Analysis (Value & Volume), Export Market Analysis (Value & Volume), Price Trend Analysis.
4. Can you provide details about the market size?
The market size is estimated to be USD XX Million as of 2022.
5. What are some drivers contributing to market growth?
Seed Treatment As A Solution To Enhance Yield; Growing Awareness For Seed Treatment Among The Farmers; Rising Trend Of Organic Farming.
6. What are the notable trends driving market growth?
Increased Practice for Organic Farming.
7. Are there any restraints impacting market growth?
Limitations Across Farm-Level Seed Treatment; Rising Environmental Concerns.
8. Can you provide examples of recent developments in the market?
N/A
9. What pricing options are available for accessing the report?
Pricing options include single-user, multi-user, and enterprise licenses priced at USD 4750, USD 5250, and USD 8750 respectively.
10. Is the market size provided in terms of value or volume?
The market size is provided in terms of value, measured in Million and volume, measured in Kiloton.
11. Are there any specific market keywords associated with the report?
Yes, the market keyword associated with the report is "APAC Biofertilizers Market," which aids in identifying and referencing the specific market segment covered.
12. How do I determine which pricing option suits my needs best?
The pricing options vary based on user requirements and access needs. Individual users may opt for single-user licenses, while businesses requiring broader access may choose multi-user or enterprise licenses for cost-effective access to the report.
13. Are there any additional resources or data provided in the APAC Biofertilizers Market report?
While the report offers comprehensive insights, it's advisable to review the specific contents or supplementary materials provided to ascertain if additional resources or data are available.
14. How can I stay updated on further developments or reports in the APAC Biofertilizers Market?
To stay informed about further developments, trends, and reports in the APAC Biofertilizers Market, consider subscribing to industry newsletters, following relevant companies and organizations, or regularly checking reputable industry news sources and publications.
Methodology
Step 1 - Identification of Relevant Samples Size from Population Database


Step 2 - Approaches for Defining Global Market Size (Value, Volume* & Price*)

Note*: In applicable scenarios
Step 3 - Data Sources
Primary Research
- Web Analytics
- Survey Reports
- Research Institute
- Latest Research Reports
- Opinion Leaders
Secondary Research
- Annual Reports
- White Paper
- Latest Press Release
- Industry Association
- Paid Database
- Investor Presentations

Step 4 - Data Triangulation
Involves using different sources of information in order to increase the validity of a study
These sources are likely to be stakeholders in a program - participants, other researchers, program staff, other community members, and so on.
Then we put all data in single framework & apply various statistical tools to find out the dynamic on the market.
During the analysis stage, feedback from the stakeholder groups would be compared to determine areas of agreement as well as areas of divergence


