

Key Insights
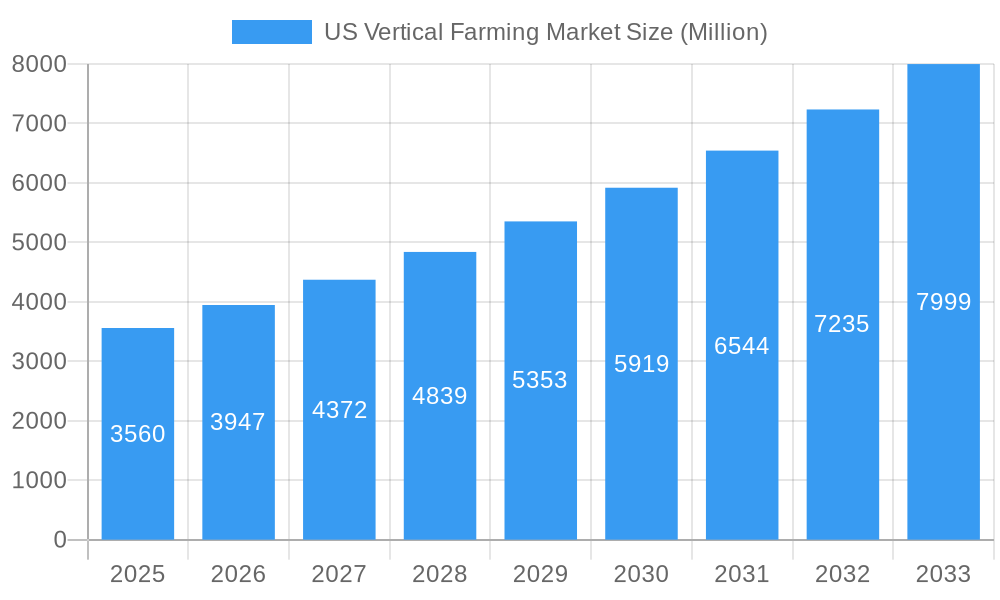
The US vertical farming market is experiencing robust growth, projected to reach $3.56 billion in 2025 and exhibiting a Compound Annual Growth Rate (CAGR) of 10.80% from 2025 to 2033. This expansion is driven by several key factors. Increasing urbanization and shrinking arable land are forcing a shift towards space-efficient, high-yield farming methods. Consumer demand for locally sourced, fresh produce, free from pesticides and herbicides, is also fueling market growth. Technological advancements in areas like hydroponics, aeroponics, and aquaponics are improving efficiency and reducing production costs, making vertical farming more commercially viable. The market is segmented by growth mechanism (aeroponics, hydroponics, aquaponics), structure (building-based, shipping container), and crop type (fruits & vegetables, herbs & microgreens, flowers & ornamentals). Leading companies like Bowery Farming, Freight Farms, and Plenty Unlimited are driving innovation and market penetration. Regional variations exist, with the Northeast, Southeast, and West Coast likely showing stronger growth due to higher population density and consumer awareness. The Midwest might show slower adoption initially, but is poised for growth as technology improves and becomes more cost-effective. The market's continued growth hinges on overcoming challenges such as high initial investment costs and energy consumption. However, ongoing technological advancements and government support initiatives are expected to mitigate these restraints.
US Vertical Farming Market Market Size (In Billion)
The forecast period (2025-2033) suggests a significant expansion of the US vertical farming market, influenced by the increasing adoption of sustainable agricultural practices and the rising preference for fresh, high-quality produce. The diverse range of crops cultivated through vertical farming, coupled with ongoing innovations in farming techniques, promises to further propel market growth. The regional distribution of vertical farms will likely reflect existing population centers and consumer demand, with further growth potential in underserved areas as infrastructure and technology improve. The competitive landscape, dominated by established players and emerging startups, will remain dynamic, fostering innovation and driving market expansion. Successful companies will focus on technological advancements, optimized operational efficiency, and strong supply chain management to gain a competitive edge. Government policies promoting sustainable agriculture and food security will play a crucial role in shaping the future growth trajectory of the US vertical farming market.
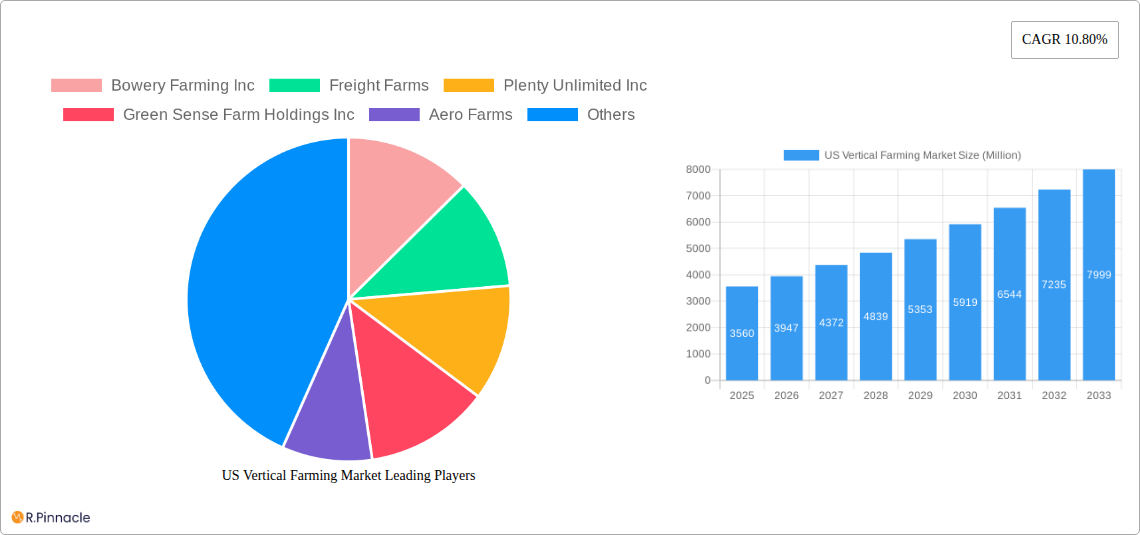
US Vertical Farming Market Company Market Share
US Vertical Farming Market Report: 2019-2033
This comprehensive report provides an in-depth analysis of the US Vertical Farming market, offering crucial insights for industry professionals, investors, and stakeholders. Covering the period from 2019 to 2033, with a focus on 2025, this report projects robust growth driven by technological advancements, evolving consumer preferences, and increasing demand for sustainable food production. The market is segmented by growth mechanism (Aeroponics, Hydroponics, Aquaponics), structure (Building-based, Shipping Container), and crop type (Fruits & Vegetables, Herbs & Micro-greens, Flowers & Ornamentals, Other). Key players like Bowery Farming Inc, Freight Farms, and Plenty Unlimited Inc are analyzed, alongside emerging trends and challenges. This report is your essential guide to navigating the dynamic US vertical farming landscape.
US Vertical Farming Market Market Structure & Innovation Trends
The US vertical farming market exhibits a moderately concentrated structure, with several large players alongside numerous smaller, niche operators. Market share is dynamic, influenced by technological innovation and M&A activity. Key players such as Bowery Farming Inc., Plenty Unlimited Inc., and Aero Farms hold significant shares, but the market remains open to new entrants. Innovation is driven by advancements in automation, sensor technology, and lighting systems, leading to increased efficiency and yield. Regulatory frameworks, while still evolving, are increasingly supportive of sustainable agriculture practices. Product substitutes include traditional agriculture methods and imported produce; however, the advantages of vertical farming in terms of sustainability and year-round supply are steadily gaining traction. End-user demographics are expanding beyond restaurants and specialty grocers to encompass major retailers like Walmart, indicating broad market acceptance. The market has witnessed several significant M&A deals in recent years, with values exceeding xx Million USD in some instances, further consolidating market positions and driving innovation. For example, the recent USD 300 Million investment in Plenty Unlimited's new campus highlights the substantial capital flowing into the sector.
US Vertical Farming Market Market Dynamics & Trends
The US vertical farming market is experiencing significant growth, projected at a CAGR of xx% during the forecast period (2025-2033). Key drivers include rising consumer demand for locally sourced, fresh produce, increasing concerns about food security and sustainability, and the growing adoption of advanced technologies. Technological disruptions, including AI-powered automation and improved lighting solutions, are significantly enhancing efficiency and reducing production costs. Consumer preferences are shifting towards healthier, more sustainably produced food, creating a strong market pull for vertically farmed produce. Competitive dynamics are characterized by both collaboration and competition, with established players forming strategic partnerships while also vying for market share. Market penetration remains relatively low compared to traditional agriculture, presenting considerable opportunities for growth. The increasing adoption of sustainable practices, growing awareness of environmental concerns and the increasing urban population are further driving the market growth. The market penetration rate is estimated to reach xx% by 2033.
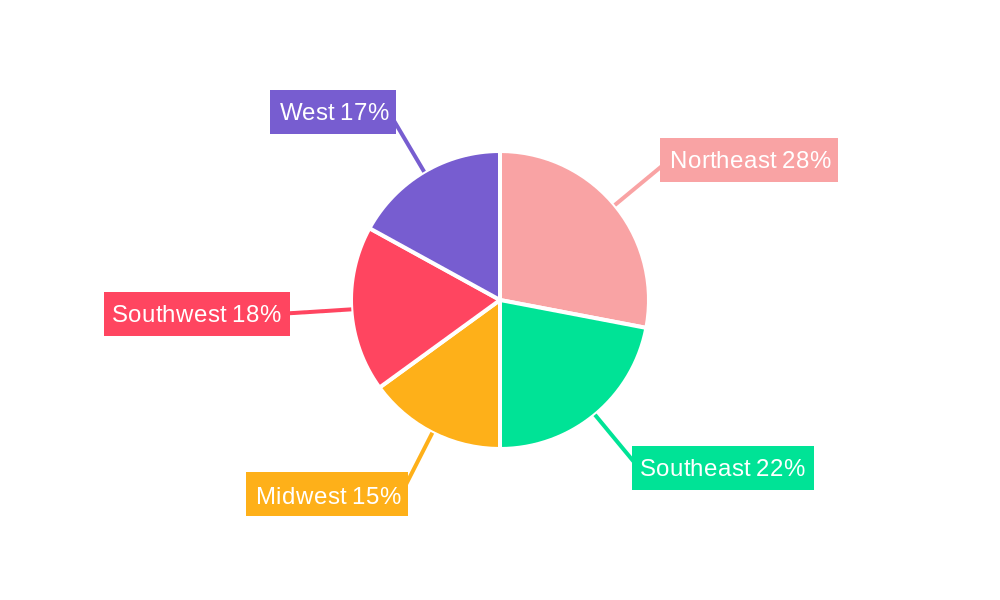
Dominant Regions & Segments in US Vertical Farming Market
The US vertical farming market is geographically diverse, with significant activity across various regions. However, coastal areas with high population density and access to infrastructure currently represent the strongest markets. Specific regions are benefiting from favorable economic policies supporting sustainable agriculture and robust infrastructure capable of supporting large-scale vertical farming operations.
- Leading Growth Mechanism: Hydroponics currently dominates the market due to its established technology and relatively lower cost compared to aeroponics or aquaponics.
- Dominant Structure: Building-based vertical farms represent the largest segment owing to their scalability and ability to integrate advanced technologies.
- Leading Crop Type: Fruits and vegetables comprise the largest share of production, driven by high consumer demand and the ease of vertical farming adaptation.
The dominance of these segments is likely to continue throughout the forecast period, although other segments are experiencing steady growth as well. The successful integration of innovative technologies and government support for sustainable practices will further bolster the market dominance.
US Vertical Farming Market Product Innovations
The US vertical farming market is characterized by rapid product innovation, with ongoing developments in LED lighting systems, automated harvesting robots, and advanced sensor technologies improving efficiency and yields. These innovations are leading to improved product quality, reduced production costs, and increased sustainability. New applications are emerging beyond fresh produce, including the cultivation of medicinal plants and other specialty crops. These advancements are contributing to the competitive advantages of vertical farming operations, positioning them for sustained growth and market leadership.
Report Scope & Segmentation Analysis
This report comprehensively segments the US vertical farming market across several dimensions:
- Growth Mechanism: Aeroponics, Hydroponics, Aquaponics, each with unique growth projections based on technology adoption and market demand.
- Structure: Building-based Vertical Farms and Shipping Container Vertical Farms, reflecting differing scalability and capital requirements.
- Crop Type: Fruits and Vegetables, Herbs and Micro-greens, Flowers and Ornamentals, and Other Crop Types, each with specific market sizes and competitive landscapes.
Each segment presents unique growth opportunities and challenges, with projections varying based on technological advancements, consumer preferences, and regulatory environments. Market size and competitive dynamics within each segment are analyzed in detail.
Key Drivers of US Vertical Farming Market Growth
Several factors fuel the growth of the US vertical farming market. Technological advancements, particularly in lighting, automation, and data analytics, are significantly improving yield and efficiency. Government incentives and policies promoting sustainable agriculture are creating a favorable regulatory environment. Economic factors, such as rising food costs and concerns about food security, are driving demand for alternative food production methods. The growing consumer awareness of environmentally friendly farming practices also adds to the market growth.
Challenges in the US Vertical Farming Market Sector
Despite its growth potential, the US vertical farming market faces challenges. High capital investment requirements pose a significant barrier for entry for smaller operators. Supply chain complexities related to specialized equipment and inputs can also impact operational efficiency. Regulatory hurdles and evolving standards can create uncertainties for businesses. Intense competition among established players and emerging startups creates pressure on pricing and profitability, reducing the overall market share of smaller players. These factors contribute to a significant challenge in the overall market development.
Emerging Opportunities in US Vertical Farming Market
Several emerging trends offer exciting opportunities. The integration of artificial intelligence and machine learning is enhancing operational efficiency and optimizing resource utilization. Expansion into new geographic markets and crop types is creating avenues for growth. Growing consumer demand for sustainable and traceable food products presents a significant market opportunity for vertical farms. The development of innovative business models, including vertical farming as a service, is another opportunity for market expansion.
Leading Players in the US Vertical Farming Market Market
- Bowery Farming Inc
- Freight Farms
- Plenty Unlimited Inc
- Green Sense Farm Holdings Inc
- Aero Farms
- Altius Farm
- Green Spirit Farms
Key Developments in US Vertical Farming Market Industry
- August 2023: Plenty Unlimited Inc. commences construction on a USD 300 Million vertical farming campus, projected to be the world's largest upon completion. This signifies a major investment in the sector and an expansion of the production capacity.
- February 2022: Aero Farms partners with FFAR and the University of Florida to research high-yielding, flavorful tomatoes for vertical farms, signifying advancements in crop development for the industry.
- January 2022: Plenty and Walmart announce a long-term investment to deliver fresh produce to consumers year-round, showcasing the growing retail integration of vertical farming.
Future Outlook for US Vertical Farming Market Market
The US vertical farming market is poised for continued robust growth, driven by technological advancements, increasing consumer demand for sustainable food, and supportive regulatory policies. Strategic partnerships between vertical farming companies and major retailers are likely to accelerate market expansion. Innovation in areas such as automation, AI, and alternative crop production will further drive market growth and create new opportunities for investors and entrepreneurs. The market is projected to reach xx Million USD by 2033.
US Vertical Farming Market Segmentation
- 1. Production Analysis
- 2. Consumption Analysis
- 3. Import Market Analysis (Value & Volume)
- 4. Export Market Analysis (Value & Volume)
- 5. Price Trend Analysis
US Vertical Farming Market Segmentation By Geography
-
1. North America
- 1.1. United States
- 1.2. Canada
- 1.3. Mexico
-
2. South America
- 2.1. Brazil
- 2.2. Argentina
- 2.3. Rest of South America
-
3. Europe
- 3.1. United Kingdom
- 3.2. Germany
- 3.3. France
- 3.4. Italy
- 3.5. Spain
- 3.6. Russia
- 3.7. Benelux
- 3.8. Nordics
- 3.9. Rest of Europe
-
4. Middle East & Africa
- 4.1. Turkey
- 4.2. Israel
- 4.3. GCC
- 4.4. North Africa
- 4.5. South Africa
- 4.6. Rest of Middle East & Africa
-
5. Asia Pacific
- 5.1. China
- 5.2. India
- 5.3. Japan
- 5.4. South Korea
- 5.5. ASEAN
- 5.6. Oceania
- 5.7. Rest of Asia Pacific
US Vertical Farming Market Regional Market Share
Geographic Coverage of US Vertical Farming Market
US Vertical Farming Market REPORT HIGHLIGHTS
| Aspects | Details |
|---|---|
| Study Period | 2020-2034 |
| Base Year | 2025 |
| Estimated Year | 2026 |
| Forecast Period | 2026-2034 |
| Historical Period | 2020-2025 |
| Growth Rate | CAGR of 10.80% from 2020-2034 |
| Segmentation |
|
Table of Contents
- 1. Introduction
- 1.1. Research Scope
- 1.2. Market Segmentation
- 1.3. Research Objective
- 1.4. Definitions and Assumptions
- 2. Executive Summary
- 2.1. Market Snapshot
- 3. Market Dynamics
- 3.1. Market Drivers
- 3.2. Market Restrains
- 3.3. Market Trends
- 3.4. Market Opportunities
- 4. Market Factor Analysis
- 4.1. Porters Five Forces
- 4.1.1. Bargaining Power of Suppliers
- 4.1.2. Bargaining Power of Buyers
- 4.1.3. Threat of New Entrants
- 4.1.4. Threat of Substitutes
- 4.1.5. Competitive Rivalry
- 4.2. PESTEL analysis
- 4.3. BCG Analysis
- 4.3.1. Stars (High Growth, High Market Share)
- 4.3.2. Cash Cows (Low Growth, High Market Share)
- 4.3.3. Question Mark (High Growth, Low Market Share)
- 4.3.4. Dogs (Low Growth, Low Market Share)
- 4.4. Ansoff Matrix Analysis
- 4.5. Supply Chain Analysis
- 4.6. Regulatory Landscape
- 4.7. Current Market Potential and Opportunity Assessment (TAM–SAM–SOM Framework)
- 4.8. PRI Analyst Note
- 4.1. Porters Five Forces
- 5. Market Analysis, Insights and Forecast 2021-2033
- 5.1. Market Analysis, Insights and Forecast - by Production Analysis
- 5.2. Market Analysis, Insights and Forecast - by Consumption Analysis
- 5.3. Market Analysis, Insights and Forecast - by Import Market Analysis (Value & Volume)
- 5.4. Market Analysis, Insights and Forecast - by Export Market Analysis (Value & Volume)
- 5.5. Market Analysis, Insights and Forecast - by Price Trend Analysis
- 5.6. Market Analysis, Insights and Forecast - by Region
- 5.6.1. North America
- 5.6.2. South America
- 5.6.3. Europe
- 5.6.4. Middle East & Africa
- 5.6.5. Asia Pacific
- 6. Global US Vertical Farming Market Analysis, Insights and Forecast, 2021-2033
- 6.1. Market Analysis, Insights and Forecast - by Production Analysis
- 6.2. Market Analysis, Insights and Forecast - by Consumption Analysis
- 6.3. Market Analysis, Insights and Forecast - by Import Market Analysis (Value & Volume)
- 6.4. Market Analysis, Insights and Forecast - by Export Market Analysis (Value & Volume)
- 6.5. Market Analysis, Insights and Forecast - by Price Trend Analysis
- 7. North America US Vertical Farming Market Analysis, Insights and Forecast, 2020-2032
- 7.1. Market Analysis, Insights and Forecast - by Production Analysis
- 7.2. Market Analysis, Insights and Forecast - by Consumption Analysis
- 7.3. Market Analysis, Insights and Forecast - by Import Market Analysis (Value & Volume)
- 7.4. Market Analysis, Insights and Forecast - by Export Market Analysis (Value & Volume)
- 7.5. Market Analysis, Insights and Forecast - by Price Trend Analysis
- 8. South America US Vertical Farming Market Analysis, Insights and Forecast, 2020-2032
- 8.1. Market Analysis, Insights and Forecast - by Production Analysis
- 8.2. Market Analysis, Insights and Forecast - by Consumption Analysis
- 8.3. Market Analysis, Insights and Forecast - by Import Market Analysis (Value & Volume)
- 8.4. Market Analysis, Insights and Forecast - by Export Market Analysis (Value & Volume)
- 8.5. Market Analysis, Insights and Forecast - by Price Trend Analysis
- 9. Europe US Vertical Farming Market Analysis, Insights and Forecast, 2020-2032
- 9.1. Market Analysis, Insights and Forecast - by Production Analysis
- 9.2. Market Analysis, Insights and Forecast - by Consumption Analysis
- 9.3. Market Analysis, Insights and Forecast - by Import Market Analysis (Value & Volume)
- 9.4. Market Analysis, Insights and Forecast - by Export Market Analysis (Value & Volume)
- 9.5. Market Analysis, Insights and Forecast - by Price Trend Analysis
- 10. Middle East & Africa US Vertical Farming Market Analysis, Insights and Forecast, 2020-2032
- 10.1. Market Analysis, Insights and Forecast - by Production Analysis
- 10.2. Market Analysis, Insights and Forecast - by Consumption Analysis
- 10.3. Market Analysis, Insights and Forecast - by Import Market Analysis (Value & Volume)
- 10.4. Market Analysis, Insights and Forecast - by Export Market Analysis (Value & Volume)
- 10.5. Market Analysis, Insights and Forecast - by Price Trend Analysis
- 11. Asia Pacific US Vertical Farming Market Analysis, Insights and Forecast, 2020-2032
- 11.1. Market Analysis, Insights and Forecast - by Production Analysis
- 11.2. Market Analysis, Insights and Forecast - by Consumption Analysis
- 11.3. Market Analysis, Insights and Forecast - by Import Market Analysis (Value & Volume)
- 11.4. Market Analysis, Insights and Forecast - by Export Market Analysis (Value & Volume)
- 11.5. Market Analysis, Insights and Forecast - by Price Trend Analysis
- 12. Competitive Analysis
- 12.1. Company Profiles
- 12.1.1 Bowery Farming Inc
- 12.1.1.1. Company Overview
- 12.1.1.2. Products
- 12.1.1.3. Company Financials
- 12.1.1.4. SWOT Analysis
- 12.1.2 Freight Farms
- 12.1.2.1. Company Overview
- 12.1.2.2. Products
- 12.1.2.3. Company Financials
- 12.1.2.4. SWOT Analysis
- 12.1.3 Plenty Unlimited Inc
- 12.1.3.1. Company Overview
- 12.1.3.2. Products
- 12.1.3.3. Company Financials
- 12.1.3.4. SWOT Analysis
- 12.1.4 Green Sense Farm Holdings Inc
- 12.1.4.1. Company Overview
- 12.1.4.2. Products
- 12.1.4.3. Company Financials
- 12.1.4.4. SWOT Analysis
- 12.1.5 Aero Farms
- 12.1.5.1. Company Overview
- 12.1.5.2. Products
- 12.1.5.3. Company Financials
- 12.1.5.4. SWOT Analysis
- 12.1.6 Altius Farm
- 12.1.6.1. Company Overview
- 12.1.6.2. Products
- 12.1.6.3. Company Financials
- 12.1.6.4. SWOT Analysis
- 12.1.7 Green Spirit Farms
- 12.1.7.1. Company Overview
- 12.1.7.2. Products
- 12.1.7.3. Company Financials
- 12.1.7.4. SWOT Analysis
- 12.1.1 Bowery Farming Inc
- 12.2. Market Entropy
- 12.2.1 Company's Key Areas Served
- 12.2.2 Recent Developments
- 12.3. Company Market Share Analysis 2025
- 12.3.1 Top 5 Companies Market Share Analysis
- 12.3.2 Top 3 Companies Market Share Analysis
- 12.4. List of Potential Customers
- 13. Research Methodology
List of Figures
- Figure 1: Global US Vertical Farming Market Revenue Breakdown (Million, %) by Region 2025 & 2033
- Figure 2: North America US Vertical Farming Market Revenue (Million), by Production Analysis 2025 & 2033
- Figure 3: North America US Vertical Farming Market Revenue Share (%), by Production Analysis 2025 & 2033
- Figure 4: North America US Vertical Farming Market Revenue (Million), by Consumption Analysis 2025 & 2033
- Figure 5: North America US Vertical Farming Market Revenue Share (%), by Consumption Analysis 2025 & 2033
- Figure 6: North America US Vertical Farming Market Revenue (Million), by Import Market Analysis (Value & Volume) 2025 & 2033
- Figure 7: North America US Vertical Farming Market Revenue Share (%), by Import Market Analysis (Value & Volume) 2025 & 2033
- Figure 8: North America US Vertical Farming Market Revenue (Million), by Export Market Analysis (Value & Volume) 2025 & 2033
- Figure 9: North America US Vertical Farming Market Revenue Share (%), by Export Market Analysis (Value & Volume) 2025 & 2033
- Figure 10: North America US Vertical Farming Market Revenue (Million), by Price Trend Analysis 2025 & 2033
- Figure 11: North America US Vertical Farming Market Revenue Share (%), by Price Trend Analysis 2025 & 2033
- Figure 12: North America US Vertical Farming Market Revenue (Million), by Country 2025 & 2033
- Figure 13: North America US Vertical Farming Market Revenue Share (%), by Country 2025 & 2033
- Figure 14: South America US Vertical Farming Market Revenue (Million), by Production Analysis 2025 & 2033
- Figure 15: South America US Vertical Farming Market Revenue Share (%), by Production Analysis 2025 & 2033
- Figure 16: South America US Vertical Farming Market Revenue (Million), by Consumption Analysis 2025 & 2033
- Figure 17: South America US Vertical Farming Market Revenue Share (%), by Consumption Analysis 2025 & 2033
- Figure 18: South America US Vertical Farming Market Revenue (Million), by Import Market Analysis (Value & Volume) 2025 & 2033
- Figure 19: South America US Vertical Farming Market Revenue Share (%), by Import Market Analysis (Value & Volume) 2025 & 2033
- Figure 20: South America US Vertical Farming Market Revenue (Million), by Export Market Analysis (Value & Volume) 2025 & 2033
- Figure 21: South America US Vertical Farming Market Revenue Share (%), by Export Market Analysis (Value & Volume) 2025 & 2033
- Figure 22: South America US Vertical Farming Market Revenue (Million), by Price Trend Analysis 2025 & 2033
- Figure 23: South America US Vertical Farming Market Revenue Share (%), by Price Trend Analysis 2025 & 2033
- Figure 24: South America US Vertical Farming Market Revenue (Million), by Country 2025 & 2033
- Figure 25: South America US Vertical Farming Market Revenue Share (%), by Country 2025 & 2033
- Figure 26: Europe US Vertical Farming Market Revenue (Million), by Production Analysis 2025 & 2033
- Figure 27: Europe US Vertical Farming Market Revenue Share (%), by Production Analysis 2025 & 2033
- Figure 28: Europe US Vertical Farming Market Revenue (Million), by Consumption Analysis 2025 & 2033
- Figure 29: Europe US Vertical Farming Market Revenue Share (%), by Consumption Analysis 2025 & 2033
- Figure 30: Europe US Vertical Farming Market Revenue (Million), by Import Market Analysis (Value & Volume) 2025 & 2033
- Figure 31: Europe US Vertical Farming Market Revenue Share (%), by Import Market Analysis (Value & Volume) 2025 & 2033
- Figure 32: Europe US Vertical Farming Market Revenue (Million), by Export Market Analysis (Value & Volume) 2025 & 2033
- Figure 33: Europe US Vertical Farming Market Revenue Share (%), by Export Market Analysis (Value & Volume) 2025 & 2033
- Figure 34: Europe US Vertical Farming Market Revenue (Million), by Price Trend Analysis 2025 & 2033
- Figure 35: Europe US Vertical Farming Market Revenue Share (%), by Price Trend Analysis 2025 & 2033
- Figure 36: Europe US Vertical Farming Market Revenue (Million), by Country 2025 & 2033
- Figure 37: Europe US Vertical Farming Market Revenue Share (%), by Country 2025 & 2033
- Figure 38: Middle East & Africa US Vertical Farming Market Revenue (Million), by Production Analysis 2025 & 2033
- Figure 39: Middle East & Africa US Vertical Farming Market Revenue Share (%), by Production Analysis 2025 & 2033
- Figure 40: Middle East & Africa US Vertical Farming Market Revenue (Million), by Consumption Analysis 2025 & 2033
- Figure 41: Middle East & Africa US Vertical Farming Market Revenue Share (%), by Consumption Analysis 2025 & 2033
- Figure 42: Middle East & Africa US Vertical Farming Market Revenue (Million), by Import Market Analysis (Value & Volume) 2025 & 2033
- Figure 43: Middle East & Africa US Vertical Farming Market Revenue Share (%), by Import Market Analysis (Value & Volume) 2025 & 2033
- Figure 44: Middle East & Africa US Vertical Farming Market Revenue (Million), by Export Market Analysis (Value & Volume) 2025 & 2033
- Figure 45: Middle East & Africa US Vertical Farming Market Revenue Share (%), by Export Market Analysis (Value & Volume) 2025 & 2033
- Figure 46: Middle East & Africa US Vertical Farming Market Revenue (Million), by Price Trend Analysis 2025 & 2033
- Figure 47: Middle East & Africa US Vertical Farming Market Revenue Share (%), by Price Trend Analysis 2025 & 2033
- Figure 48: Middle East & Africa US Vertical Farming Market Revenue (Million), by Country 2025 & 2033
- Figure 49: Middle East & Africa US Vertical Farming Market Revenue Share (%), by Country 2025 & 2033
- Figure 50: Asia Pacific US Vertical Farming Market Revenue (Million), by Production Analysis 2025 & 2033
- Figure 51: Asia Pacific US Vertical Farming Market Revenue Share (%), by Production Analysis 2025 & 2033
- Figure 52: Asia Pacific US Vertical Farming Market Revenue (Million), by Consumption Analysis 2025 & 2033
- Figure 53: Asia Pacific US Vertical Farming Market Revenue Share (%), by Consumption Analysis 2025 & 2033
- Figure 54: Asia Pacific US Vertical Farming Market Revenue (Million), by Import Market Analysis (Value & Volume) 2025 & 2033
- Figure 55: Asia Pacific US Vertical Farming Market Revenue Share (%), by Import Market Analysis (Value & Volume) 2025 & 2033
- Figure 56: Asia Pacific US Vertical Farming Market Revenue (Million), by Export Market Analysis (Value & Volume) 2025 & 2033
- Figure 57: Asia Pacific US Vertical Farming Market Revenue Share (%), by Export Market Analysis (Value & Volume) 2025 & 2033
- Figure 58: Asia Pacific US Vertical Farming Market Revenue (Million), by Price Trend Analysis 2025 & 2033
- Figure 59: Asia Pacific US Vertical Farming Market Revenue Share (%), by Price Trend Analysis 2025 & 2033
- Figure 60: Asia Pacific US Vertical Farming Market Revenue (Million), by Country 2025 & 2033
- Figure 61: Asia Pacific US Vertical Farming Market Revenue Share (%), by Country 2025 & 2033
List of Tables
- Table 1: Global US Vertical Farming Market Revenue Million Forecast, by Production Analysis 2020 & 2033
- Table 2: Global US Vertical Farming Market Revenue Million Forecast, by Consumption Analysis 2020 & 2033
- Table 3: Global US Vertical Farming Market Revenue Million Forecast, by Import Market Analysis (Value & Volume) 2020 & 2033
- Table 4: Global US Vertical Farming Market Revenue Million Forecast, by Export Market Analysis (Value & Volume) 2020 & 2033
- Table 5: Global US Vertical Farming Market Revenue Million Forecast, by Price Trend Analysis 2020 & 2033
- Table 6: Global US Vertical Farming Market Revenue Million Forecast, by Region 2020 & 2033
- Table 7: Global US Vertical Farming Market Revenue Million Forecast, by Production Analysis 2020 & 2033
- Table 8: Global US Vertical Farming Market Revenue Million Forecast, by Consumption Analysis 2020 & 2033
- Table 9: Global US Vertical Farming Market Revenue Million Forecast, by Import Market Analysis (Value & Volume) 2020 & 2033
- Table 10: Global US Vertical Farming Market Revenue Million Forecast, by Export Market Analysis (Value & Volume) 2020 & 2033
- Table 11: Global US Vertical Farming Market Revenue Million Forecast, by Price Trend Analysis 2020 & 2033
- Table 12: Global US Vertical Farming Market Revenue Million Forecast, by Country 2020 & 2033
- Table 13: United States US Vertical Farming Market Revenue (Million) Forecast, by Application 2020 & 2033
- Table 14: Canada US Vertical Farming Market Revenue (Million) Forecast, by Application 2020 & 2033
- Table 15: Mexico US Vertical Farming Market Revenue (Million) Forecast, by Application 2020 & 2033
- Table 16: Global US Vertical Farming Market Revenue Million Forecast, by Production Analysis 2020 & 2033
- Table 17: Global US Vertical Farming Market Revenue Million Forecast, by Consumption Analysis 2020 & 2033
- Table 18: Global US Vertical Farming Market Revenue Million Forecast, by Import Market Analysis (Value & Volume) 2020 & 2033
- Table 19: Global US Vertical Farming Market Revenue Million Forecast, by Export Market Analysis (Value & Volume) 2020 & 2033
- Table 20: Global US Vertical Farming Market Revenue Million Forecast, by Price Trend Analysis 2020 & 2033
- Table 21: Global US Vertical Farming Market Revenue Million Forecast, by Country 2020 & 2033
- Table 22: Brazil US Vertical Farming Market Revenue (Million) Forecast, by Application 2020 & 2033
- Table 23: Argentina US Vertical Farming Market Revenue (Million) Forecast, by Application 2020 & 2033
- Table 24: Rest of South America US Vertical Farming Market Revenue (Million) Forecast, by Application 2020 & 2033
- Table 25: Global US Vertical Farming Market Revenue Million Forecast, by Production Analysis 2020 & 2033
- Table 26: Global US Vertical Farming Market Revenue Million Forecast, by Consumption Analysis 2020 & 2033
- Table 27: Global US Vertical Farming Market Revenue Million Forecast, by Import Market Analysis (Value & Volume) 2020 & 2033
- Table 28: Global US Vertical Farming Market Revenue Million Forecast, by Export Market Analysis (Value & Volume) 2020 & 2033
- Table 29: Global US Vertical Farming Market Revenue Million Forecast, by Price Trend Analysis 2020 & 2033
- Table 30: Global US Vertical Farming Market Revenue Million Forecast, by Country 2020 & 2033
- Table 31: United Kingdom US Vertical Farming Market Revenue (Million) Forecast, by Application 2020 & 2033
- Table 32: Germany US Vertical Farming Market Revenue (Million) Forecast, by Application 2020 & 2033
- Table 33: France US Vertical Farming Market Revenue (Million) Forecast, by Application 2020 & 2033
- Table 34: Italy US Vertical Farming Market Revenue (Million) Forecast, by Application 2020 & 2033
- Table 35: Spain US Vertical Farming Market Revenue (Million) Forecast, by Application 2020 & 2033
- Table 36: Russia US Vertical Farming Market Revenue (Million) Forecast, by Application 2020 & 2033
- Table 37: Benelux US Vertical Farming Market Revenue (Million) Forecast, by Application 2020 & 2033
- Table 38: Nordics US Vertical Farming Market Revenue (Million) Forecast, by Application 2020 & 2033
- Table 39: Rest of Europe US Vertical Farming Market Revenue (Million) Forecast, by Application 2020 & 2033
- Table 40: Global US Vertical Farming Market Revenue Million Forecast, by Production Analysis 2020 & 2033
- Table 41: Global US Vertical Farming Market Revenue Million Forecast, by Consumption Analysis 2020 & 2033
- Table 42: Global US Vertical Farming Market Revenue Million Forecast, by Import Market Analysis (Value & Volume) 2020 & 2033
- Table 43: Global US Vertical Farming Market Revenue Million Forecast, by Export Market Analysis (Value & Volume) 2020 & 2033
- Table 44: Global US Vertical Farming Market Revenue Million Forecast, by Price Trend Analysis 2020 & 2033
- Table 45: Global US Vertical Farming Market Revenue Million Forecast, by Country 2020 & 2033
- Table 46: Turkey US Vertical Farming Market Revenue (Million) Forecast, by Application 2020 & 2033
- Table 47: Israel US Vertical Farming Market Revenue (Million) Forecast, by Application 2020 & 2033
- Table 48: GCC US Vertical Farming Market Revenue (Million) Forecast, by Application 2020 & 2033
- Table 49: North Africa US Vertical Farming Market Revenue (Million) Forecast, by Application 2020 & 2033
- Table 50: South Africa US Vertical Farming Market Revenue (Million) Forecast, by Application 2020 & 2033
- Table 51: Rest of Middle East & Africa US Vertical Farming Market Revenue (Million) Forecast, by Application 2020 & 2033
- Table 52: Global US Vertical Farming Market Revenue Million Forecast, by Production Analysis 2020 & 2033
- Table 53: Global US Vertical Farming Market Revenue Million Forecast, by Consumption Analysis 2020 & 2033
- Table 54: Global US Vertical Farming Market Revenue Million Forecast, by Import Market Analysis (Value & Volume) 2020 & 2033
- Table 55: Global US Vertical Farming Market Revenue Million Forecast, by Export Market Analysis (Value & Volume) 2020 & 2033
- Table 56: Global US Vertical Farming Market Revenue Million Forecast, by Price Trend Analysis 2020 & 2033
- Table 57: Global US Vertical Farming Market Revenue Million Forecast, by Country 2020 & 2033
- Table 58: China US Vertical Farming Market Revenue (Million) Forecast, by Application 2020 & 2033
- Table 59: India US Vertical Farming Market Revenue (Million) Forecast, by Application 2020 & 2033
- Table 60: Japan US Vertical Farming Market Revenue (Million) Forecast, by Application 2020 & 2033
- Table 61: South Korea US Vertical Farming Market Revenue (Million) Forecast, by Application 2020 & 2033
- Table 62: ASEAN US Vertical Farming Market Revenue (Million) Forecast, by Application 2020 & 2033
- Table 63: Oceania US Vertical Farming Market Revenue (Million) Forecast, by Application 2020 & 2033
- Table 64: Rest of Asia Pacific US Vertical Farming Market Revenue (Million) Forecast, by Application 2020 & 2033
Frequently Asked Questions
1. What is the projected Compound Annual Growth Rate (CAGR) of the US Vertical Farming Market?
The projected CAGR is approximately 10.80%.
2. Which companies are prominent players in the US Vertical Farming Market?
Key companies in the market include Bowery Farming Inc, Freight Farms, Plenty Unlimited Inc, Green Sense Farm Holdings Inc, Aero Farms, Altius Farm, Green Spirit Farms.
3. What are the main segments of the US Vertical Farming Market?
The market segments include Production Analysis, Consumption Analysis, Import Market Analysis (Value & Volume), Export Market Analysis (Value & Volume), Price Trend Analysis.
4. Can you provide details about the market size?
The market size is estimated to be USD 3.56 Million as of 2022.
5. What are some drivers contributing to market growth?
Seed Treatment As A Solution To Enhance Yield; Growing Awareness For Seed Treatment Among The Farmers; Rising Trend Of Organic Farming.
6. What are the notable trends driving market growth?
The Hydroponics Segment Dominates the Market.
7. Are there any restraints impacting market growth?
Limitations Across Farm-Level Seed Treatment; Rising Environmental Concerns.
8. Can you provide examples of recent developments in the market?
August 2023: Plenty Unlimited Inc., a San Francisco-based company, began construction on a vertical indoor farming campus that, when completed, is likely to be the largest such operation in the world. The campus, to be developed in phases totaling USD 300 million, will sit on 120 acres in the Meadowville Technology Park.
9. What pricing options are available for accessing the report?
Pricing options include single-user, multi-user, and enterprise licenses priced at USD 3800, USD 4500, and USD 5800 respectively.
10. Is the market size provided in terms of value or volume?
The market size is provided in terms of value, measured in Million.
11. Are there any specific market keywords associated with the report?
Yes, the market keyword associated with the report is "US Vertical Farming Market," which aids in identifying and referencing the specific market segment covered.
12. How do I determine which pricing option suits my needs best?
The pricing options vary based on user requirements and access needs. Individual users may opt for single-user licenses, while businesses requiring broader access may choose multi-user or enterprise licenses for cost-effective access to the report.
13. Are there any additional resources or data provided in the US Vertical Farming Market report?
While the report offers comprehensive insights, it's advisable to review the specific contents or supplementary materials provided to ascertain if additional resources or data are available.
14. How can I stay updated on further developments or reports in the US Vertical Farming Market?
To stay informed about further developments, trends, and reports in the US Vertical Farming Market, consider subscribing to industry newsletters, following relevant companies and organizations, or regularly checking reputable industry news sources and publications.
Methodology
Step 1 - Identification of Relevant Samples Size from Population Database


Step 2 - Approaches for Defining Global Market Size (Value, Volume* & Price*)

Note*: In applicable scenarios
Step 3 - Data Sources
Primary Research
- Web Analytics
- Survey Reports
- Research Institute
- Latest Research Reports
- Opinion Leaders
Secondary Research
- Annual Reports
- White Paper
- Latest Press Release
- Industry Association
- Paid Database
- Investor Presentations

Step 4 - Data Triangulation
Involves using different sources of information in order to increase the validity of a study
These sources are likely to be stakeholders in a program - participants, other researchers, program staff, other community members, and so on.
Then we put all data in single framework & apply various statistical tools to find out the dynamic on the market.
During the analysis stage, feedback from the stakeholder groups would be compared to determine areas of agreement as well as areas of divergence