

Key Insights
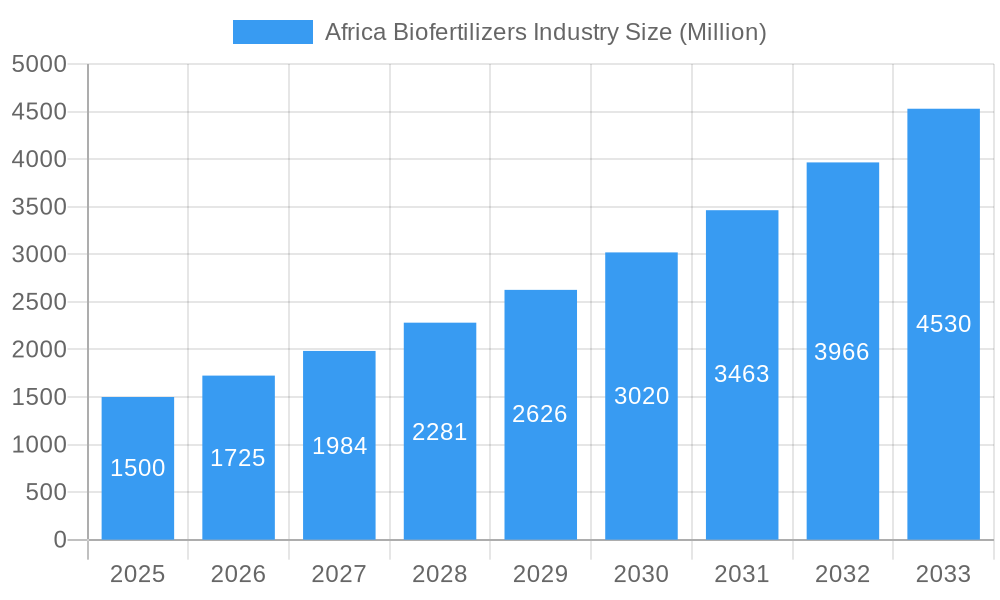
The African biofertilizers market is experiencing robust growth, projected to reach a substantial size driven by increasing demand for sustainable agricultural practices and rising food security concerns across the continent. A compound annual growth rate (CAGR) of 15% from 2025 to 2033 indicates a significant expansion, fueled by several key factors. The adoption of biofertilizers is being driven by government initiatives promoting sustainable agriculture, rising awareness among farmers about the benefits of eco-friendly farming methods (reduced reliance on chemical fertilizers, improved soil health, and increased crop yields), and favorable climatic conditions in various regions. The market is segmented by form (Azospirillum, Azotobacter, Mycorrhiza, Phosphate Solubilizing Bacteria, Rhizobium, and Others), crop type (cash crops, horticultural crops, and row crops), and key countries (Egypt, Nigeria, South Africa, and others). South Africa currently holds a significant market share due to its advanced agricultural infrastructure and strong government support for sustainable farming. However, other countries like Nigeria and Kenya show immense potential for future growth, driven by expanding agricultural land and increasing investment in the sector. Market restraints include limited awareness among farmers in certain regions, lack of access to quality biofertilizers, and challenges related to distribution networks in remote areas. Overcoming these limitations through targeted awareness campaigns, strategic partnerships with local distributors, and government subsidies could unlock the full potential of the biofertilizers market across Africa.
Africa Biofertilizers Industry Market Size (In Billion)
The competitive landscape is characterized by a mix of international and local players. International companies bring expertise and advanced technologies, while local companies possess strong regional understanding and distribution networks. The market is poised for further consolidation as larger companies acquire smaller players and expand their product portfolios to cater to the diverse needs of the African agricultural sector. The forecast period (2025-2033) suggests a continuously expanding market, with notable growth potential in untapped regions and crop segments. Focusing on research and development to enhance the efficacy of biofertilizers tailored to specific African soil conditions and crop varieties will be critical to sustaining this growth trajectory. This includes exploring the potential of innovative biofertilizer formulations and delivery systems, ensuring affordability and accessibility, and further strengthening farmer education and extension services.
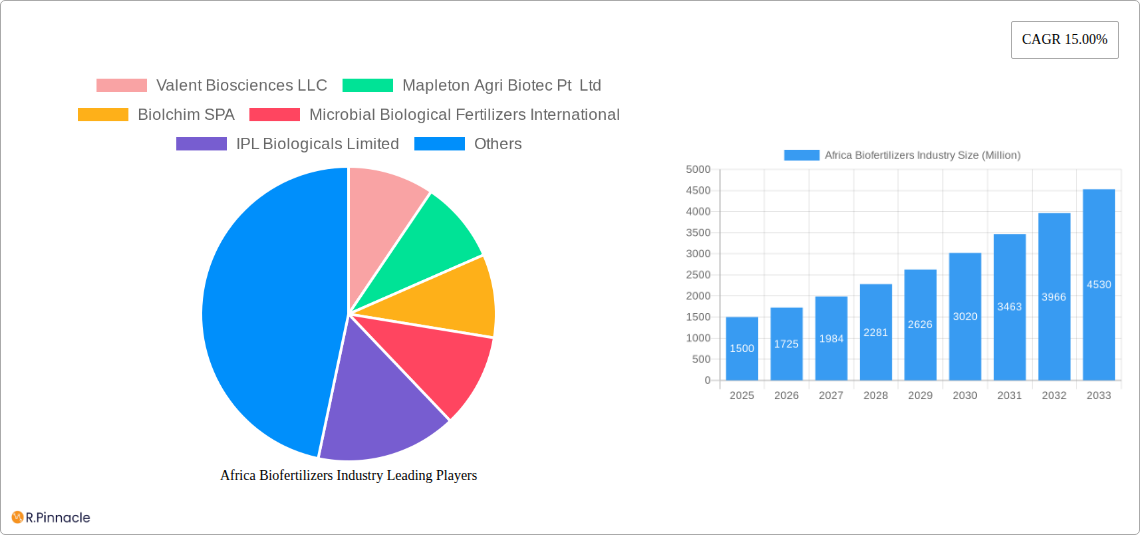
Africa Biofertilizers Industry Company Market Share
Africa Biofertilizers Industry: Market Report 2019-2033
This comprehensive report provides an in-depth analysis of the Africa biofertilizers industry, offering valuable insights for industry professionals, investors, and researchers. The report covers the period 2019-2033, with a focus on the 2025-2033 forecast period. The market is segmented by form (Azospirillum, Azotobacter, Mycorrhiza, Phosphate Solubilizing Bacteria, Rhizobium, Other Biofertilizers), crop type (Cash Crops, Horticultural Crops, Row Crops), and country (Egypt, Nigeria, South Africa, Rest of Africa). The report projects a market value exceeding xx Million by 2033, driven by increasing demand for sustainable agriculture and technological advancements.
Africa Biofertilizers Industry Market Structure & Innovation Trends
This section analyzes the competitive landscape of the African biofertilizers market, including market concentration, innovation drivers, regulatory frameworks, and M&A activities. The market is characterized by a mix of large multinational companies and smaller regional players. Market share is dynamic, with leading companies like Valent Biosciences LLC, Biolchim SPA, and Rizobacter holding significant portions. However, the presence of numerous smaller players signifies a fragmented market. Innovation is driven by the need for improved crop yields, sustainable farming practices, and climate change adaptation. Regulatory frameworks vary across African countries, impacting market entry and product registration. M&A activity has been moderate, with notable examples including the 2021 collaboration between Heliae Agriculture and Rizobacter (estimated value xx Million). Further consolidation is anticipated as larger players seek to expand their market reach and product portfolios. The total value of M&A deals in the period 2019-2024 is estimated at xx Million.
- Market Concentration: Moderately fragmented
- Innovation Drivers: Sustainable agriculture, improved crop yields, climate change adaptation
- Regulatory Framework: Varied across African countries
- M&A Activity: Moderate, with potential for increased consolidation
Africa Biofertilizers Industry Market Dynamics & Trends
The African biofertilizers market is experiencing robust growth, driven by factors such as increasing awareness of sustainable agriculture practices, government support for agricultural development, and rising demand for food security. The market's CAGR during the historical period (2019-2024) is estimated to be xx%, with projected growth in the forecast period (2025-2033) driven by increasing adoption of biofertilizers in various crops and regions. Market penetration varies significantly across different countries and crop types, with higher adoption rates observed in regions with established agricultural infrastructure and supportive government policies. Technological advancements, such as the development of improved biofertilizer formulations and application methods, are further boosting market growth. Competitive dynamics are shaped by factors such as pricing, product quality, and distribution networks.
Dominant Regions & Segments in Africa Biofertilizers Industry
South Africa is currently the dominant market for biofertilizers in Africa, owing to its relatively developed agricultural sector and higher awareness of sustainable farming practices. However, significant growth potential exists in other regions, such as Nigeria and Egypt, driven by expanding agricultural production and government initiatives to promote sustainable agriculture. Within the product segments, Phosphate Solubilizing Bacteria and Rhizobium are currently leading due to their widespread application across various crops.
- Key Drivers for South Africa: Developed agricultural infrastructure, awareness of sustainable farming.
- Key Drivers for Nigeria & Egypt: Expanding agricultural production, government support for sustainable agriculture.
- Dominant Form Segments: Phosphate Solubilizing Bacteria and Rhizobium.
- Dominant Crop Segments: Cash Crops and Horticultural Crops
Africa Biofertilizers Industry Product Innovations
Recent innovations in biofertilizers focus on enhancing product efficacy, improving application methods, and developing tailored formulations for specific crop types and soil conditions. For example, Atlántica Agrícola's launch of Micomix in 2021 showcases a trend towards multi-component biofertilizers combining different microbial strains for synergistic effects. This trend emphasizes the development of more efficient and environmentally friendly solutions compared to traditional chemical fertilizers. Companies are also focusing on developing cost-effective biofertilizers to increase market accessibility.
Report Scope & Segmentation Analysis
This report provides a detailed analysis of the Africa biofertilizers market, segmented by form (Azospirillum, Azotobacter, Mycorrhiza, Phosphate Solubilizing Bacteria, Rhizobium, Other Biofertilizers), crop type (Cash Crops, Horticultural Crops, Row Crops), and country (Egypt, Nigeria, South Africa, Rest of Africa). Each segment is analyzed in terms of market size, growth projections, and competitive dynamics. The market size for each segment is projected to increase substantially over the forecast period.
Key Drivers of Africa Biofertilizers Industry Growth
The growth of the Africa biofertilizers industry is propelled by several key factors: increasing demand for sustainable and environmentally friendly agricultural practices; government initiatives and policies promoting the use of biofertilizers; growing awareness among farmers about the benefits of biofertilizers; and technological advancements leading to improved product efficacy and affordability. The rising need for food security in a rapidly growing population is also a significant driver.
Challenges in the Africa Biofertilizers Industry Sector
The Africa biofertilizers industry faces several challenges, including limited awareness and adoption among smallholder farmers; lack of access to credit and financing for purchasing biofertilizers; inadequate infrastructure for storage and distribution; inconsistent regulatory frameworks across different countries; and the high cost of research and development for developing new and improved products. These challenges collectively hinder market growth, requiring targeted interventions to address these issues.
Emerging Opportunities in Africa Biofertilizers Industry
Significant opportunities exist for growth in the Africa biofertilizers industry, particularly in untapped markets within the continent. There's a potential for increased collaboration between research institutions, companies and governments to develop and promote biofertilizers. Further investment in research and development of customized biofertilizers tailored to specific soil and crop types in different regions will unlock substantial growth potential.
Leading Players in the Africa Biofertilizers Industry Market
- Valent Biosciences LLC
- Mapleton Agri Biotec Pt Ltd
- Biolchim SPA
- Microbial Biological Fertilizers International
- IPL Biologicals Limited
- Atlántica Agrícola
- T Stanes and Company Limited
- Vegalab S
- Rizobacter
Key Developments in Africa Biofertilizers Industry Industry
- January 2021: Heliae Agriculture and Rizobacter collaborate to develop innovative soil and crop nutrition technologies.
- January 2021: Atlántica Agrícola launches Micomix, a biostimulant composed of mycorrhizal fungi, rhizobacteria, and chelated micronutrients.
Future Outlook for Africa Biofertilizers Industry Market
The future outlook for the Africa biofertilizers market is positive, with significant growth potential driven by increasing demand for sustainable agriculture, supportive government policies, and technological advancements. Strategic partnerships, investments in research and development, and expansion into new markets will be crucial for companies to capitalize on these opportunities and achieve sustainable growth in the coming years.
Africa Biofertilizers Industry Segmentation
- 1. Production Analysis
- 2. Consumption Analysis
- 3. Import Market Analysis (Value & Volume)
- 4. Export Market Analysis (Value & Volume)
- 5. Price Trend Analysis
Africa Biofertilizers Industry Segmentation By Geography
-
1. Africa
- 1.1. Nigeria
- 1.2. South Africa
- 1.3. Egypt
- 1.4. Kenya
- 1.5. Ethiopia
- 1.6. Morocco
- 1.7. Ghana
- 1.8. Algeria
- 1.9. Tanzania
- 1.10. Ivory Coast
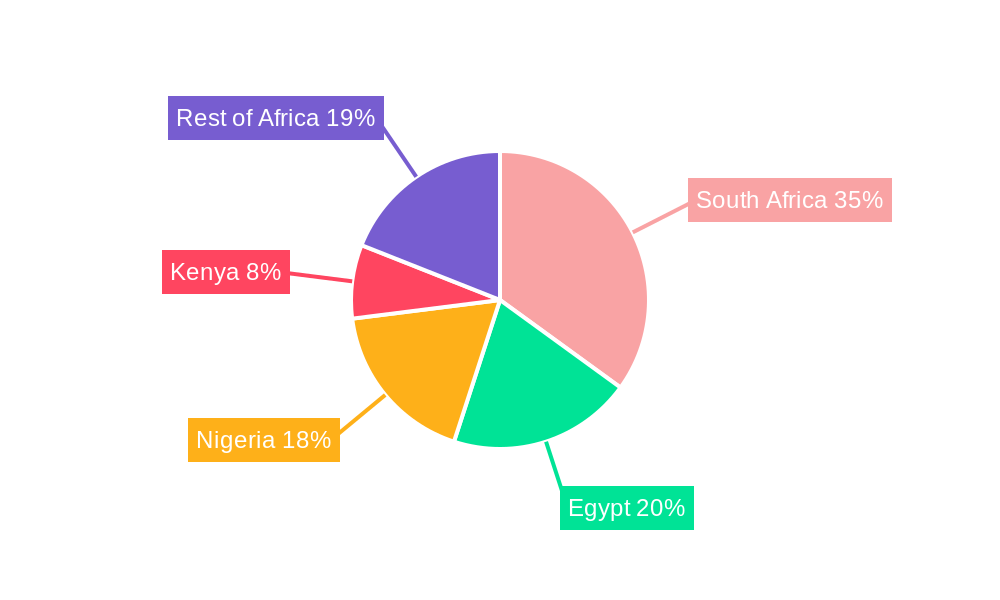
Africa Biofertilizers Industry Regional Market Share
Geographic Coverage of Africa Biofertilizers Industry
Africa Biofertilizers Industry REPORT HIGHLIGHTS
| Aspects | Details |
|---|---|
| Study Period | 2020-2034 |
| Base Year | 2025 |
| Estimated Year | 2026 |
| Forecast Period | 2026-2034 |
| Historical Period | 2020-2025 |
| Growth Rate | CAGR of 9.44% from 2020-2034 |
| Segmentation |
|
Table of Contents
- 1. Introduction
- 1.1. Research Scope
- 1.2. Market Segmentation
- 1.3. Research Objective
- 1.4. Definitions and Assumptions
- 2. Executive Summary
- 2.1. Market Snapshot
- 3. Market Dynamics
- 3.1. Market Drivers
- 3.2. Market Restrains
- 3.3. Market Trends
- 3.4. Market Opportunities
- 4. Market Factor Analysis
- 4.1. Porters Five Forces
- 4.1.1. Bargaining Power of Suppliers
- 4.1.2. Bargaining Power of Buyers
- 4.1.3. Threat of New Entrants
- 4.1.4. Threat of Substitutes
- 4.1.5. Competitive Rivalry
- 4.2. PESTEL analysis
- 4.3. BCG Analysis
- 4.3.1. Stars (High Growth, High Market Share)
- 4.3.2. Cash Cows (Low Growth, High Market Share)
- 4.3.3. Question Mark (High Growth, Low Market Share)
- 4.3.4. Dogs (Low Growth, Low Market Share)
- 4.4. Ansoff Matrix Analysis
- 4.5. Supply Chain Analysis
- 4.6. Regulatory Landscape
- 4.7. Current Market Potential and Opportunity Assessment (TAM–SAM–SOM Framework)
- 4.8. PRI Analyst Note
- 4.1. Porters Five Forces
- 5. Market Analysis, Insights and Forecast 2021-2033
- 5.1. Market Analysis, Insights and Forecast - by Production Analysis
- 5.2. Market Analysis, Insights and Forecast - by Consumption Analysis
- 5.3. Market Analysis, Insights and Forecast - by Import Market Analysis (Value & Volume)
- 5.4. Market Analysis, Insights and Forecast - by Export Market Analysis (Value & Volume)
- 5.5. Market Analysis, Insights and Forecast - by Price Trend Analysis
- 5.6. Market Analysis, Insights and Forecast - by Region
- 5.6.1. Africa
- 6. Africa Biofertilizers Industry Analysis, Insights and Forecast, 2021-2033
- 6.1. Market Analysis, Insights and Forecast - by Production Analysis
- 6.2. Market Analysis, Insights and Forecast - by Consumption Analysis
- 6.3. Market Analysis, Insights and Forecast - by Import Market Analysis (Value & Volume)
- 6.4. Market Analysis, Insights and Forecast - by Export Market Analysis (Value & Volume)
- 6.5. Market Analysis, Insights and Forecast - by Price Trend Analysis
- 7. Competitive Analysis
- 7.1. Company Profiles
- 7.1.1 Valent Biosciences LLC
- 7.1.1.1. Company Overview
- 7.1.1.2. Products
- 7.1.1.3. Company Financials
- 7.1.1.4. SWOT Analysis
- 7.1.2 Mapleton Agri Biotec Pt Ltd
- 7.1.2.1. Company Overview
- 7.1.2.2. Products
- 7.1.2.3. Company Financials
- 7.1.2.4. SWOT Analysis
- 7.1.3 Biolchim SPA
- 7.1.3.1. Company Overview
- 7.1.3.2. Products
- 7.1.3.3. Company Financials
- 7.1.3.4. SWOT Analysis
- 7.1.4 Microbial Biological Fertilizers International
- 7.1.4.1. Company Overview
- 7.1.4.2. Products
- 7.1.4.3. Company Financials
- 7.1.4.4. SWOT Analysis
- 7.1.5 IPL Biologicals Limited
- 7.1.5.1. Company Overview
- 7.1.5.2. Products
- 7.1.5.3. Company Financials
- 7.1.5.4. SWOT Analysis
- 7.1.6 Atlántica Agrícola
- 7.1.6.1. Company Overview
- 7.1.6.2. Products
- 7.1.6.3. Company Financials
- 7.1.6.4. SWOT Analysis
- 7.1.7 T Stanes and Company Limited
- 7.1.7.1. Company Overview
- 7.1.7.2. Products
- 7.1.7.3. Company Financials
- 7.1.7.4. SWOT Analysis
- 7.1.8 Vegalab S
- 7.1.8.1. Company Overview
- 7.1.8.2. Products
- 7.1.8.3. Company Financials
- 7.1.8.4. SWOT Analysis
- 7.1.9 Rizobacter
- 7.1.9.1. Company Overview
- 7.1.9.2. Products
- 7.1.9.3. Company Financials
- 7.1.9.4. SWOT Analysis
- 7.1.1 Valent Biosciences LLC
- 7.2. Market Entropy
- 7.2.1 Company's Key Areas Served
- 7.2.2 Recent Developments
- 7.3. Company Market Share Analysis 2025
- 7.3.1 Top 5 Companies Market Share Analysis
- 7.3.2 Top 3 Companies Market Share Analysis
- 7.4. List of Potential Customers
- 8. Research Methodology
List of Figures
- Figure 1: Africa Biofertilizers Industry Revenue Breakdown (million, %) by Product 2025 & 2033
- Figure 2: Africa Biofertilizers Industry Share (%) by Company 2025
List of Tables
- Table 1: Africa Biofertilizers Industry Revenue million Forecast, by Production Analysis 2020 & 2033
- Table 2: Africa Biofertilizers Industry Revenue million Forecast, by Consumption Analysis 2020 & 2033
- Table 3: Africa Biofertilizers Industry Revenue million Forecast, by Import Market Analysis (Value & Volume) 2020 & 2033
- Table 4: Africa Biofertilizers Industry Revenue million Forecast, by Export Market Analysis (Value & Volume) 2020 & 2033
- Table 5: Africa Biofertilizers Industry Revenue million Forecast, by Price Trend Analysis 2020 & 2033
- Table 6: Africa Biofertilizers Industry Revenue million Forecast, by Region 2020 & 2033
- Table 7: Africa Biofertilizers Industry Revenue million Forecast, by Production Analysis 2020 & 2033
- Table 8: Africa Biofertilizers Industry Revenue million Forecast, by Consumption Analysis 2020 & 2033
- Table 9: Africa Biofertilizers Industry Revenue million Forecast, by Import Market Analysis (Value & Volume) 2020 & 2033
- Table 10: Africa Biofertilizers Industry Revenue million Forecast, by Export Market Analysis (Value & Volume) 2020 & 2033
- Table 11: Africa Biofertilizers Industry Revenue million Forecast, by Price Trend Analysis 2020 & 2033
- Table 12: Africa Biofertilizers Industry Revenue million Forecast, by Country 2020 & 2033
- Table 13: Nigeria Africa Biofertilizers Industry Revenue (million) Forecast, by Application 2020 & 2033
- Table 14: South Africa Africa Biofertilizers Industry Revenue (million) Forecast, by Application 2020 & 2033
- Table 15: Egypt Africa Biofertilizers Industry Revenue (million) Forecast, by Application 2020 & 2033
- Table 16: Kenya Africa Biofertilizers Industry Revenue (million) Forecast, by Application 2020 & 2033
- Table 17: Ethiopia Africa Biofertilizers Industry Revenue (million) Forecast, by Application 2020 & 2033
- Table 18: Morocco Africa Biofertilizers Industry Revenue (million) Forecast, by Application 2020 & 2033
- Table 19: Ghana Africa Biofertilizers Industry Revenue (million) Forecast, by Application 2020 & 2033
- Table 20: Algeria Africa Biofertilizers Industry Revenue (million) Forecast, by Application 2020 & 2033
- Table 21: Tanzania Africa Biofertilizers Industry Revenue (million) Forecast, by Application 2020 & 2033
- Table 22: Ivory Coast Africa Biofertilizers Industry Revenue (million) Forecast, by Application 2020 & 2033
Frequently Asked Questions
1. What is the projected Compound Annual Growth Rate (CAGR) of the Africa Biofertilizers Industry?
The projected CAGR is approximately 9.44%.
2. Which companies are prominent players in the Africa Biofertilizers Industry?
Key companies in the market include Valent Biosciences LLC, Mapleton Agri Biotec Pt Ltd, Biolchim SPA, Microbial Biological Fertilizers International, IPL Biologicals Limited, Atlántica Agrícola, T Stanes and Company Limited, Vegalab S, Rizobacter.
3. What are the main segments of the Africa Biofertilizers Industry?
The market segments include Production Analysis, Consumption Analysis, Import Market Analysis (Value & Volume), Export Market Analysis (Value & Volume), Price Trend Analysis.
4. Can you provide details about the market size?
The market size is estimated to be USD 246.8 million as of 2022.
5. What are some drivers contributing to market growth?
Demand For Landscaping Maintenance; Adoption of Green Spaces and Green Roofs.
6. What are the notable trends driving market growth?
Row Crops is the largest Crop Type.
7. Are there any restraints impacting market growth?
Shortage of Labor In Landscaping; High Maintenance Cost of Lawn Mowers.
8. Can you provide examples of recent developments in the market?
January 2021: Heliae Agriculture and Rizobacter collaborate to develop Innovative Soil and Crop Nutrition Technologies that will help the company manufacture better and more efficient solutions, enhancing its product portfolio.January 2021: Atlántica Agrícola’s developed Micomix, a biostimulant composed primarily of mycorrhizal fungi, rhizobacteria, and chelated micronutrients. The presence and development of these microorganisms in the rhizosphere create a symbiotic relationship with the plant that favors the absorption of water and mineral nutrients and increases its tolerance to water and salt stress.
9. What pricing options are available for accessing the report?
Pricing options include single-user, multi-user, and enterprise licenses priced at USD 3800, USD 4500, and USD 5800 respectively.
10. Is the market size provided in terms of value or volume?
The market size is provided in terms of value, measured in million.
11. Are there any specific market keywords associated with the report?
Yes, the market keyword associated with the report is "Africa Biofertilizers Industry," which aids in identifying and referencing the specific market segment covered.
12. How do I determine which pricing option suits my needs best?
The pricing options vary based on user requirements and access needs. Individual users may opt for single-user licenses, while businesses requiring broader access may choose multi-user or enterprise licenses for cost-effective access to the report.
13. Are there any additional resources or data provided in the Africa Biofertilizers Industry report?
While the report offers comprehensive insights, it's advisable to review the specific contents or supplementary materials provided to ascertain if additional resources or data are available.
14. How can I stay updated on further developments or reports in the Africa Biofertilizers Industry?
To stay informed about further developments, trends, and reports in the Africa Biofertilizers Industry, consider subscribing to industry newsletters, following relevant companies and organizations, or regularly checking reputable industry news sources and publications.
Methodology
Step 1 - Identification of Relevant Samples Size from Population Database


Step 2 - Approaches for Defining Global Market Size (Value, Volume* & Price*)

Note*: In applicable scenarios
Step 3 - Data Sources
Primary Research
- Web Analytics
- Survey Reports
- Research Institute
- Latest Research Reports
- Opinion Leaders
Secondary Research
- Annual Reports
- White Paper
- Latest Press Release
- Industry Association
- Paid Database
- Investor Presentations

Step 4 - Data Triangulation
Involves using different sources of information in order to increase the validity of a study
These sources are likely to be stakeholders in a program - participants, other researchers, program staff, other community members, and so on.
Then we put all data in single framework & apply various statistical tools to find out the dynamic on the market.
During the analysis stage, feedback from the stakeholder groups would be compared to determine areas of agreement as well as areas of divergence