
Key Insights
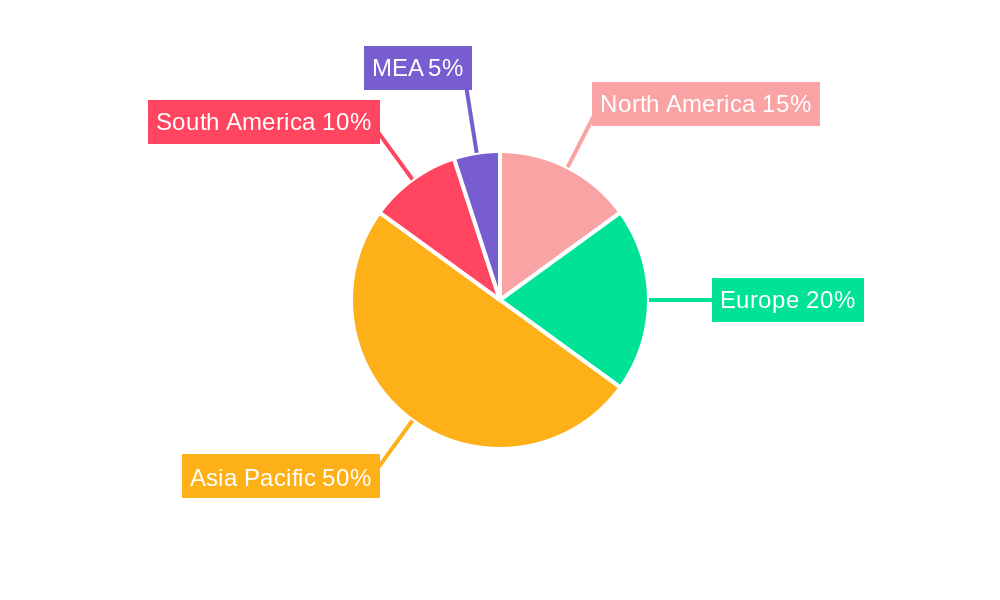
The Asia-Pacific (APAC) fruit and vegetable ingredients market is experiencing robust growth, driven by increasing demand for convenient and healthy food products. The region's large and expanding population, coupled with rising disposable incomes and changing dietary preferences, are key factors fueling this expansion. Consumers are increasingly seeking natural and minimally processed foods, boosting the demand for fruit and vegetable-based ingredients in various applications, including beverages, confectionery, and prepared meals. The market is segmented by ingredient type (fruits and vegetables), product type (concentrates, pastes & purees, pieces & powders, NFC juices), and application. While concentrates and pastes currently hold a significant market share due to cost-effectiveness and extended shelf life, the demand for NFC (Not From Concentrate) juices and minimally processed ingredients is rapidly increasing, reflecting a consumer preference for higher quality and nutritional value. This trend is particularly noticeable in developed economies within APAC like Japan, South Korea, and Australia, where health consciousness is high. Furthermore, the growth of the food processing and manufacturing industry within the region is directly correlating with an increased demand for these ingredients. Companies are actively investing in research and development to innovate product offerings, including functional ingredients enriched with vitamins and minerals, furthering market expansion.
The APAC market is characterized by significant regional variations. China and India represent substantial growth opportunities due to their enormous populations and expanding middle classes. However, challenges remain, including supply chain complexities, fluctuating raw material prices, and stringent food safety regulations. Despite these challenges, the long-term outlook for the APAC fruit and vegetable ingredients market is positive, with the continued growth of the processed food industry and increased consumer demand for healthier options expected to drive market expansion over the forecast period. The presence of established international players and emerging local companies suggests a dynamic and competitive landscape characterized by innovation and market consolidation. The growth of e-commerce and online retail platforms is also providing new avenues for accessing this expanding market.
This comprehensive report provides a detailed analysis of the Asia-Pacific (APAC) fruit and vegetable ingredients market, offering invaluable insights for industry professionals, investors, and stakeholders. Covering the period from 2019 to 2033, with a focus on 2025, this report dissects market dynamics, trends, and opportunities, enabling informed decision-making. The market size is projected to reach xx Million by 2033, exhibiting a robust CAGR of xx%.
APAC Fruit and Vegetable Ingredients Market Market Structure & Innovation Trends
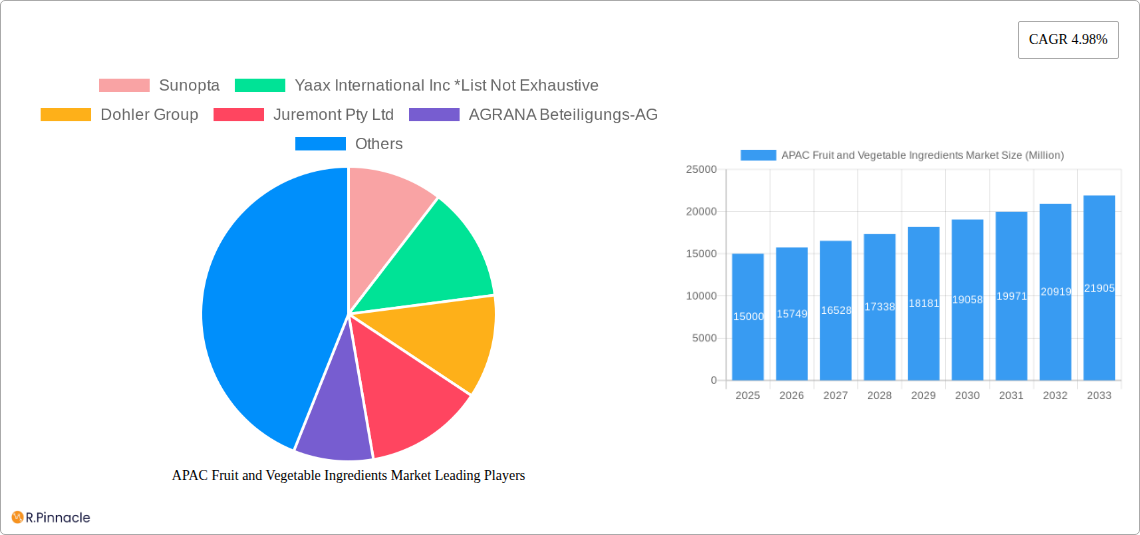
This section analyzes the competitive landscape of the APAC fruit and vegetable ingredients market. We examine market concentration, identifying key players and their respective market shares. Sunopta, Yaax International Inc, Dohler Group, Juremont Pty Ltd, AGRANA Beteiligungs-AG, Archer Daniels Midland Company, Sensient Technologies Corporation, and Frutarom (Taura Natural Ingredient) are some of the prominent players, though the market is not limited to these companies. The report explores M&A activities, including deal values and their impact on market consolidation. Innovation drivers, such as the demand for clean-label products and functional ingredients, are also discussed, along with regulatory frameworks and the influence of substitute products. Finally, an analysis of end-user demographics and their evolving preferences is included. The market share of the top 5 players is estimated at xx% in 2025. The total value of M&A deals in the last 5 years is estimated at xx Million.
APAC Fruit and Vegetable Ingredients Market Market Dynamics & Trends
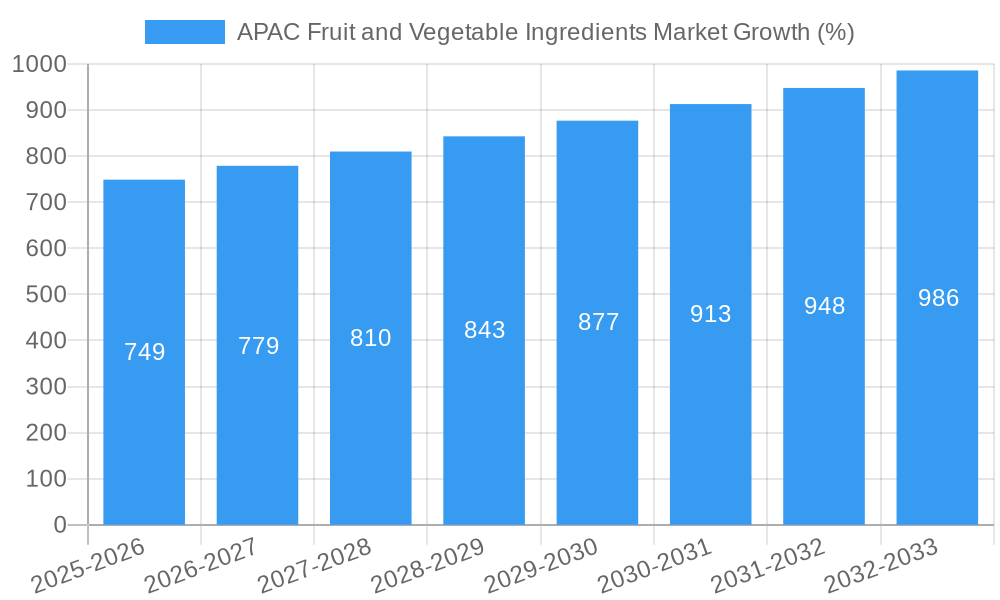
This section delves into the key market dynamics shaping the APAC fruit and vegetable ingredients market. We examine growth drivers, including rising health consciousness, increasing demand for convenient food products, and expanding food processing industries. Technological disruptions, such as advancements in processing and preservation techniques, are thoroughly investigated. Consumer preferences, including the shift towards natural and organic ingredients, and their influence on market trends are analyzed. The competitive dynamics are explored, with a focus on pricing strategies, product differentiation, and innovation. The report also incorporates projected growth rates (CAGR) and market penetration rates for key segments. The market is expected to experience significant growth, driven by factors such as increasing disposable incomes and changing lifestyle patterns.
Dominant Regions & Segments in APAC Fruit and Vegetable Ingredients Market
This section pinpoints the leading regions and segments within the APAC fruit and vegetable ingredients market. The analysis encompasses both geographical dominance (by country) and segmentation by ingredient type (fruits and vegetables), product type (concentrates, pastes and purees, pieces and powders, NFC juices), and application (beverages, confectionery products, bakery products, soups and sauces, dairy products, and RTE products).
Key Drivers by Region/Segment (Examples):
- China: Strong economic growth, expanding food processing industry, rising consumer spending.
- India: Growing population, increasing urbanization, rising demand for processed foods.
- Fruits Segment: High consumer preference for fruit-based products, increasing health awareness.
- Concentrates Segment: Cost-effectiveness, ease of storage and transportation.
- Beverages Application: High consumption of beverages, especially ready-to-drink options.
Detailed dominance analysis will identify the specific region, country, and product segment that contributes the largest share to the overall market revenue. Further analysis will explore the relative performance of each segment across different regions.
APAP Fruit and Vegetable Ingredients Market Product Innovations
This section highlights recent product developments and innovations in the APAC fruit and vegetable ingredients market. It focuses on technological advancements driving the creation of novel products with enhanced functionality, shelf-life, and consumer appeal. Key trends include the development of clean-label ingredients, functional ingredients with added health benefits, and sustainable processing methods. The competitive advantages offered by these innovations will be assessed, highlighting their market fit and potential for growth.
Report Scope & Segmentation Analysis
This report provides a comprehensive segmentation of the APAC fruit and vegetable ingredients market.
By Ingredient Type: The market is segmented into fruits and vegetables, with detailed analysis of growth projections and market sizes for each. Competitive dynamics within each segment are examined.
By Product Type: This includes concentrates, pastes and purees, pieces and powders, and NFC juices. Each segment's growth potential and competitive landscape are analyzed.
By Application: This encompasses beverages, confectionery products, bakery products, soups and sauces, dairy products, and RTE products. Market size and growth projections are provided for each application segment, along with an analysis of the competitive landscape.
Key Drivers of APAC Fruit and Vegetable Ingredients Market Growth
Several factors contribute to the growth of the APAC fruit and vegetable ingredients market. These include increasing consumer demand for convenient and healthy food options, coupled with the expansion of the food processing and beverage industries. Technological advancements in food processing and preservation also play a significant role, enhancing product quality and shelf life. Government regulations promoting the use of natural and functional ingredients further bolster market growth. The burgeoning middle class in many APAC countries, with increased disposable income, fuels demand for value-added food products.
Challenges in the APAC Fruit and Vegetable Ingredients Market Sector
The APAC fruit and vegetable ingredients market faces several challenges, including fluctuations in raw material prices, complexities in supply chain management, and intense competition. Stringent regulatory requirements and concerns about food safety also impact market dynamics. Seasonality in fruit and vegetable production can create supply chain bottlenecks and price volatility. Furthermore, the prevalence of counterfeit products and the need for sustainable sourcing practices pose ongoing challenges for market participants.
Emerging Opportunities in APAC Fruit and Vegetable Ingredients Market
The APAC fruit and vegetable ingredients market presents several emerging opportunities. The rising demand for functional foods and beverages, incorporating ingredients with health benefits, presents a significant growth avenue. The increasing popularity of plant-based diets creates opportunities for innovative fruit and vegetable-based ingredient solutions. Furthermore, the growth of e-commerce and online grocery platforms provides new channels for distribution and market expansion. Opportunities also exist in developing sustainable and ethically sourced ingredients.
Leading Players in the APAC Fruit and Vegetable Ingredients Market Market
- Sunopta
- Yaax International Inc
- Dohler Group
- Juremont Pty Ltd
- AGRANA Beteiligungs-AG
- Archer Daniels Midland Company
- Sensient Technologies Corporation
- Frutarom (Taura Natural Ingredient)
Key Developments in APAC Fruit and Vegetable Ingredients Market Industry
- 2022-Q4: Company X launched a new line of organic fruit purees.
- 2023-Q1: Company Y acquired Company Z, expanding its market share in the concentrates segment.
- 2023-Q3: New regulations on food labeling were implemented in Country A. (Further details on specific developments and their impacts will be included in the full report).
Future Outlook for APAC Fruit and Vegetable Ingredients Market Market
The future outlook for the APAC fruit and vegetable ingredients market is positive. Continued growth is expected, driven by favorable demographic trends, expanding food processing industries, and increasing consumer demand for healthy and convenient food options. Technological advancements in processing and preservation will enhance product quality and create new market opportunities. Companies focusing on innovation, sustainability, and meeting evolving consumer preferences are well-positioned for success in this dynamic market. The market's projected growth trajectory suggests significant potential for investment and expansion.
APAC Fruit and Vegetable Ingredients Market Segmentation
-
1. Ingredient Type
- 1.1. Fruits
- 1.2. Vegetables
-
2. Product Type
- 2.1. Concentrates
- 2.2. Pastes and Purees
- 2.3. Pieces and Powders
- 2.4. NFC Juices
-
3. Application
- 3.1. Beverages
- 3.2. Confectionery Products
- 3.3. Bakery Products
- 3.4. Soups and Sauces
- 3.5. Dairy Products
- 3.6. RTE Products
-
4. Geography
- 4.1. China
- 4.2. Japan
- 4.3. India
- 4.4. Australia
- 4.5. Rest of Asia-Pacific
APAC Fruit and Vegetable Ingredients Market Segmentation By Geography
- 1. China
- 2. Japan
- 3. India
- 4. Australia
- 5. Rest of Asia Pacific
APAC Fruit and Vegetable Ingredients Market REPORT HIGHLIGHTS
| Aspects | Details |
|---|---|
| Study Period | 2019-2033 |
| Base Year | 2024 |
| Estimated Year | 2025 |
| Forecast Period | 2025-2033 |
| Historical Period | 2019-2024 |
| Growth Rate | CAGR of 4.98% from 2019-2033 |
| Segmentation |
|
Table of Contents
- 1. Introduction
- 1.1. Research Scope
- 1.2. Market Segmentation
- 1.3. Research Methodology
- 1.4. Definitions and Assumptions
- 2. Executive Summary
- 2.1. Introduction
- 3. Market Dynamics
- 3.1. Introduction
- 3.2. Market Drivers
- 3.2.1. Increasing Demand for Protein-Rich Food; Increasing Demand for Plant-Based and Organic Ingredients
- 3.3. Market Restrains
- 3.3.1. Presence of Alternative Proteins
- 3.4. Market Trends
- 3.4.1. Growing Application of Natural Ingredients
- 4. Market Factor Analysis
- 4.1. Porters Five Forces
- 4.2. Supply/Value Chain
- 4.3. PESTEL analysis
- 4.4. Market Entropy
- 4.5. Patent/Trademark Analysis
- 5. Global APAC Fruit and Vegetable Ingredients Market Analysis, Insights and Forecast, 2019-2031
- 5.1. Market Analysis, Insights and Forecast - by Ingredient Type
- 5.1.1. Fruits
- 5.1.2. Vegetables
- 5.2. Market Analysis, Insights and Forecast - by Product Type
- 5.2.1. Concentrates
- 5.2.2. Pastes and Purees
- 5.2.3. Pieces and Powders
- 5.2.4. NFC Juices
- 5.3. Market Analysis, Insights and Forecast - by Application
- 5.3.1. Beverages
- 5.3.2. Confectionery Products
- 5.3.3. Bakery Products
- 5.3.4. Soups and Sauces
- 5.3.5. Dairy Products
- 5.3.6. RTE Products
- 5.4. Market Analysis, Insights and Forecast - by Geography
- 5.4.1. China
- 5.4.2. Japan
- 5.4.3. India
- 5.4.4. Australia
- 5.4.5. Rest of Asia-Pacific
- 5.5. Market Analysis, Insights and Forecast - by Region
- 5.5.1. China
- 5.5.2. Japan
- 5.5.3. India
- 5.5.4. Australia
- 5.5.5. Rest of Asia Pacific
- 5.1. Market Analysis, Insights and Forecast - by Ingredient Type
- 6. China APAC Fruit and Vegetable Ingredients Market Analysis, Insights and Forecast, 2019-2031
- 6.1. Market Analysis, Insights and Forecast - by Ingredient Type
- 6.1.1. Fruits
- 6.1.2. Vegetables
- 6.2. Market Analysis, Insights and Forecast - by Product Type
- 6.2.1. Concentrates
- 6.2.2. Pastes and Purees
- 6.2.3. Pieces and Powders
- 6.2.4. NFC Juices
- 6.3. Market Analysis, Insights and Forecast - by Application
- 6.3.1. Beverages
- 6.3.2. Confectionery Products
- 6.3.3. Bakery Products
- 6.3.4. Soups and Sauces
- 6.3.5. Dairy Products
- 6.3.6. RTE Products
- 6.4. Market Analysis, Insights and Forecast - by Geography
- 6.4.1. China
- 6.4.2. Japan
- 6.4.3. India
- 6.4.4. Australia
- 6.4.5. Rest of Asia-Pacific
- 6.1. Market Analysis, Insights and Forecast - by Ingredient Type
- 7. Japan APAC Fruit and Vegetable Ingredients Market Analysis, Insights and Forecast, 2019-2031
- 7.1. Market Analysis, Insights and Forecast - by Ingredient Type
- 7.1.1. Fruits
- 7.1.2. Vegetables
- 7.2. Market Analysis, Insights and Forecast - by Product Type
- 7.2.1. Concentrates
- 7.2.2. Pastes and Purees
- 7.2.3. Pieces and Powders
- 7.2.4. NFC Juices
- 7.3. Market Analysis, Insights and Forecast - by Application
- 7.3.1. Beverages
- 7.3.2. Confectionery Products
- 7.3.3. Bakery Products
- 7.3.4. Soups and Sauces
- 7.3.5. Dairy Products
- 7.3.6. RTE Products
- 7.4. Market Analysis, Insights and Forecast - by Geography
- 7.4.1. China
- 7.4.2. Japan
- 7.4.3. India
- 7.4.4. Australia
- 7.4.5. Rest of Asia-Pacific
- 7.1. Market Analysis, Insights and Forecast - by Ingredient Type
- 8. India APAC Fruit and Vegetable Ingredients Market Analysis, Insights and Forecast, 2019-2031
- 8.1. Market Analysis, Insights and Forecast - by Ingredient Type
- 8.1.1. Fruits
- 8.1.2. Vegetables
- 8.2. Market Analysis, Insights and Forecast - by Product Type
- 8.2.1. Concentrates
- 8.2.2. Pastes and Purees
- 8.2.3. Pieces and Powders
- 8.2.4. NFC Juices
- 8.3. Market Analysis, Insights and Forecast - by Application
- 8.3.1. Beverages
- 8.3.2. Confectionery Products
- 8.3.3. Bakery Products
- 8.3.4. Soups and Sauces
- 8.3.5. Dairy Products
- 8.3.6. RTE Products
- 8.4. Market Analysis, Insights and Forecast - by Geography
- 8.4.1. China
- 8.4.2. Japan
- 8.4.3. India
- 8.4.4. Australia
- 8.4.5. Rest of Asia-Pacific
- 8.1. Market Analysis, Insights and Forecast - by Ingredient Type
- 9. Australia APAC Fruit and Vegetable Ingredients Market Analysis, Insights and Forecast, 2019-2031
- 9.1. Market Analysis, Insights and Forecast - by Ingredient Type
- 9.1.1. Fruits
- 9.1.2. Vegetables
- 9.2. Market Analysis, Insights and Forecast - by Product Type
- 9.2.1. Concentrates
- 9.2.2. Pastes and Purees
- 9.2.3. Pieces and Powders
- 9.2.4. NFC Juices
- 9.3. Market Analysis, Insights and Forecast - by Application
- 9.3.1. Beverages
- 9.3.2. Confectionery Products
- 9.3.3. Bakery Products
- 9.3.4. Soups and Sauces
- 9.3.5. Dairy Products
- 9.3.6. RTE Products
- 9.4. Market Analysis, Insights and Forecast - by Geography
- 9.4.1. China
- 9.4.2. Japan
- 9.4.3. India
- 9.4.4. Australia
- 9.4.5. Rest of Asia-Pacific
- 9.1. Market Analysis, Insights and Forecast - by Ingredient Type
- 10. Rest of Asia Pacific APAC Fruit and Vegetable Ingredients Market Analysis, Insights and Forecast, 2019-2031
- 10.1. Market Analysis, Insights and Forecast - by Ingredient Type
- 10.1.1. Fruits
- 10.1.2. Vegetables
- 10.2. Market Analysis, Insights and Forecast - by Product Type
- 10.2.1. Concentrates
- 10.2.2. Pastes and Purees
- 10.2.3. Pieces and Powders
- 10.2.4. NFC Juices
- 10.3. Market Analysis, Insights and Forecast - by Application
- 10.3.1. Beverages
- 10.3.2. Confectionery Products
- 10.3.3. Bakery Products
- 10.3.4. Soups and Sauces
- 10.3.5. Dairy Products
- 10.3.6. RTE Products
- 10.4. Market Analysis, Insights and Forecast - by Geography
- 10.4.1. China
- 10.4.2. Japan
- 10.4.3. India
- 10.4.4. Australia
- 10.4.5. Rest of Asia-Pacific
- 10.1. Market Analysis, Insights and Forecast - by Ingredient Type
- 11. North America APAC Fruit and Vegetable Ingredients Market Analysis, Insights and Forecast, 2019-2031
- 11.1. Market Analysis, Insights and Forecast - By Country/Sub-region
- 11.1.1 United States
- 11.1.2 Canada
- 11.1.3 Mexico
- 12. Europe APAC Fruit and Vegetable Ingredients Market Analysis, Insights and Forecast, 2019-2031
- 12.1. Market Analysis, Insights and Forecast - By Country/Sub-region
- 12.1.1 Germany
- 12.1.2 United Kingdom
- 12.1.3 France
- 12.1.4 Spain
- 12.1.5 Italy
- 12.1.6 Spain
- 12.1.7 Belgium
- 12.1.8 Netherland
- 12.1.9 Nordics
- 12.1.10 Rest of Europe
- 13. Asia Pacific APAC Fruit and Vegetable Ingredients Market Analysis, Insights and Forecast, 2019-2031
- 13.1. Market Analysis, Insights and Forecast - By Country/Sub-region
- 13.1.1 China
- 13.1.2 Japan
- 13.1.3 India
- 13.1.4 South Korea
- 13.1.5 Southeast Asia
- 13.1.6 Australia
- 13.1.7 Indonesia
- 13.1.8 Phillipes
- 13.1.9 Singapore
- 13.1.10 Thailandc
- 13.1.11 Rest of Asia Pacific
- 14. South America APAC Fruit and Vegetable Ingredients Market Analysis, Insights and Forecast, 2019-2031
- 14.1. Market Analysis, Insights and Forecast - By Country/Sub-region
- 14.1.1 Brazil
- 14.1.2 Argentina
- 14.1.3 Peru
- 14.1.4 Chile
- 14.1.5 Colombia
- 14.1.6 Ecuador
- 14.1.7 Venezuela
- 14.1.8 Rest of South America
- 15. North America APAC Fruit and Vegetable Ingredients Market Analysis, Insights and Forecast, 2019-2031
- 15.1. Market Analysis, Insights and Forecast - By Country/Sub-region
- 15.1.1 United States
- 15.1.2 Canada
- 15.1.3 Mexico
- 16. MEA APAC Fruit and Vegetable Ingredients Market Analysis, Insights and Forecast, 2019-2031
- 16.1. Market Analysis, Insights and Forecast - By Country/Sub-region
- 16.1.1 United Arab Emirates
- 16.1.2 Saudi Arabia
- 16.1.3 South Africa
- 16.1.4 Rest of Middle East and Africa
- 17. Competitive Analysis
- 17.1. Global Market Share Analysis 2024
- 17.2. Company Profiles
- 17.2.1 Sunopta
- 17.2.1.1. Overview
- 17.2.1.2. Products
- 17.2.1.3. SWOT Analysis
- 17.2.1.4. Recent Developments
- 17.2.1.5. Financials (Based on Availability)
- 17.2.2 Yaax International Inc *List Not Exhaustive
- 17.2.2.1. Overview
- 17.2.2.2. Products
- 17.2.2.3. SWOT Analysis
- 17.2.2.4. Recent Developments
- 17.2.2.5. Financials (Based on Availability)
- 17.2.3 Dohler Group
- 17.2.3.1. Overview
- 17.2.3.2. Products
- 17.2.3.3. SWOT Analysis
- 17.2.3.4. Recent Developments
- 17.2.3.5. Financials (Based on Availability)
- 17.2.4 Juremont Pty Ltd
- 17.2.4.1. Overview
- 17.2.4.2. Products
- 17.2.4.3. SWOT Analysis
- 17.2.4.4. Recent Developments
- 17.2.4.5. Financials (Based on Availability)
- 17.2.5 AGRANA Beteiligungs-AG
- 17.2.5.1. Overview
- 17.2.5.2. Products
- 17.2.5.3. SWOT Analysis
- 17.2.5.4. Recent Developments
- 17.2.5.5. Financials (Based on Availability)
- 17.2.6 Archer Daniels Midland Company
- 17.2.6.1. Overview
- 17.2.6.2. Products
- 17.2.6.3. SWOT Analysis
- 17.2.6.4. Recent Developments
- 17.2.6.5. Financials (Based on Availability)
- 17.2.7 Sensient Technologies Corporation
- 17.2.7.1. Overview
- 17.2.7.2. Products
- 17.2.7.3. SWOT Analysis
- 17.2.7.4. Recent Developments
- 17.2.7.5. Financials (Based on Availability)
- 17.2.8 Frutarom (Taura Natural Ingredient)
- 17.2.8.1. Overview
- 17.2.8.2. Products
- 17.2.8.3. SWOT Analysis
- 17.2.8.4. Recent Developments
- 17.2.8.5. Financials (Based on Availability)
- 17.2.1 Sunopta
List of Figures
- Figure 1: Global APAC Fruit and Vegetable Ingredients Market Revenue Breakdown (Million, %) by Region 2024 & 2032
- Figure 2: Global APAC Fruit and Vegetable Ingredients Market Volume Breakdown (K Tons, %) by Region 2024 & 2032
- Figure 3: North America APAC Fruit and Vegetable Ingredients Market Revenue (Million), by Country 2024 & 2032
- Figure 4: North America APAC Fruit and Vegetable Ingredients Market Volume (K Tons), by Country 2024 & 2032
- Figure 5: North America APAC Fruit and Vegetable Ingredients Market Revenue Share (%), by Country 2024 & 2032
- Figure 6: North America APAC Fruit and Vegetable Ingredients Market Volume Share (%), by Country 2024 & 2032
- Figure 7: Europe APAC Fruit and Vegetable Ingredients Market Revenue (Million), by Country 2024 & 2032
- Figure 8: Europe APAC Fruit and Vegetable Ingredients Market Volume (K Tons), by Country 2024 & 2032
- Figure 9: Europe APAC Fruit and Vegetable Ingredients Market Revenue Share (%), by Country 2024 & 2032
- Figure 10: Europe APAC Fruit and Vegetable Ingredients Market Volume Share (%), by Country 2024 & 2032
- Figure 11: Asia Pacific APAC Fruit and Vegetable Ingredients Market Revenue (Million), by Country 2024 & 2032
- Figure 12: Asia Pacific APAC Fruit and Vegetable Ingredients Market Volume (K Tons), by Country 2024 & 2032
- Figure 13: Asia Pacific APAC Fruit and Vegetable Ingredients Market Revenue Share (%), by Country 2024 & 2032
- Figure 14: Asia Pacific APAC Fruit and Vegetable Ingredients Market Volume Share (%), by Country 2024 & 2032
- Figure 15: South America APAC Fruit and Vegetable Ingredients Market Revenue (Million), by Country 2024 & 2032
- Figure 16: South America APAC Fruit and Vegetable Ingredients Market Volume (K Tons), by Country 2024 & 2032
- Figure 17: South America APAC Fruit and Vegetable Ingredients Market Revenue Share (%), by Country 2024 & 2032
- Figure 18: South America APAC Fruit and Vegetable Ingredients Market Volume Share (%), by Country 2024 & 2032
- Figure 19: North America APAC Fruit and Vegetable Ingredients Market Revenue (Million), by Country 2024 & 2032
- Figure 20: North America APAC Fruit and Vegetable Ingredients Market Volume (K Tons), by Country 2024 & 2032
- Figure 21: North America APAC Fruit and Vegetable Ingredients Market Revenue Share (%), by Country 2024 & 2032
- Figure 22: North America APAC Fruit and Vegetable Ingredients Market Volume Share (%), by Country 2024 & 2032
- Figure 23: MEA APAC Fruit and Vegetable Ingredients Market Revenue (Million), by Country 2024 & 2032
- Figure 24: MEA APAC Fruit and Vegetable Ingredients Market Volume (K Tons), by Country 2024 & 2032
- Figure 25: MEA APAC Fruit and Vegetable Ingredients Market Revenue Share (%), by Country 2024 & 2032
- Figure 26: MEA APAC Fruit and Vegetable Ingredients Market Volume Share (%), by Country 2024 & 2032
- Figure 27: China APAC Fruit and Vegetable Ingredients Market Revenue (Million), by Ingredient Type 2024 & 2032
- Figure 28: China APAC Fruit and Vegetable Ingredients Market Volume (K Tons), by Ingredient Type 2024 & 2032
- Figure 29: China APAC Fruit and Vegetable Ingredients Market Revenue Share (%), by Ingredient Type 2024 & 2032
- Figure 30: China APAC Fruit and Vegetable Ingredients Market Volume Share (%), by Ingredient Type 2024 & 2032
- Figure 31: China APAC Fruit and Vegetable Ingredients Market Revenue (Million), by Product Type 2024 & 2032
- Figure 32: China APAC Fruit and Vegetable Ingredients Market Volume (K Tons), by Product Type 2024 & 2032
- Figure 33: China APAC Fruit and Vegetable Ingredients Market Revenue Share (%), by Product Type 2024 & 2032
- Figure 34: China APAC Fruit and Vegetable Ingredients Market Volume Share (%), by Product Type 2024 & 2032
- Figure 35: China APAC Fruit and Vegetable Ingredients Market Revenue (Million), by Application 2024 & 2032
- Figure 36: China APAC Fruit and Vegetable Ingredients Market Volume (K Tons), by Application 2024 & 2032
- Figure 37: China APAC Fruit and Vegetable Ingredients Market Revenue Share (%), by Application 2024 & 2032
- Figure 38: China APAC Fruit and Vegetable Ingredients Market Volume Share (%), by Application 2024 & 2032
- Figure 39: China APAC Fruit and Vegetable Ingredients Market Revenue (Million), by Geography 2024 & 2032
- Figure 40: China APAC Fruit and Vegetable Ingredients Market Volume (K Tons), by Geography 2024 & 2032
- Figure 41: China APAC Fruit and Vegetable Ingredients Market Revenue Share (%), by Geography 2024 & 2032
- Figure 42: China APAC Fruit and Vegetable Ingredients Market Volume Share (%), by Geography 2024 & 2032
- Figure 43: China APAC Fruit and Vegetable Ingredients Market Revenue (Million), by Country 2024 & 2032
- Figure 44: China APAC Fruit and Vegetable Ingredients Market Volume (K Tons), by Country 2024 & 2032
- Figure 45: China APAC Fruit and Vegetable Ingredients Market Revenue Share (%), by Country 2024 & 2032
- Figure 46: China APAC Fruit and Vegetable Ingredients Market Volume Share (%), by Country 2024 & 2032
- Figure 47: Japan APAC Fruit and Vegetable Ingredients Market Revenue (Million), by Ingredient Type 2024 & 2032
- Figure 48: Japan APAC Fruit and Vegetable Ingredients Market Volume (K Tons), by Ingredient Type 2024 & 2032
- Figure 49: Japan APAC Fruit and Vegetable Ingredients Market Revenue Share (%), by Ingredient Type 2024 & 2032
- Figure 50: Japan APAC Fruit and Vegetable Ingredients Market Volume Share (%), by Ingredient Type 2024 & 2032
- Figure 51: Japan APAC Fruit and Vegetable Ingredients Market Revenue (Million), by Product Type 2024 & 2032
- Figure 52: Japan APAC Fruit and Vegetable Ingredients Market Volume (K Tons), by Product Type 2024 & 2032
- Figure 53: Japan APAC Fruit and Vegetable Ingredients Market Revenue Share (%), by Product Type 2024 & 2032
- Figure 54: Japan APAC Fruit and Vegetable Ingredients Market Volume Share (%), by Product Type 2024 & 2032
- Figure 55: Japan APAC Fruit and Vegetable Ingredients Market Revenue (Million), by Application 2024 & 2032
- Figure 56: Japan APAC Fruit and Vegetable Ingredients Market Volume (K Tons), by Application 2024 & 2032
- Figure 57: Japan APAC Fruit and Vegetable Ingredients Market Revenue Share (%), by Application 2024 & 2032
- Figure 58: Japan APAC Fruit and Vegetable Ingredients Market Volume Share (%), by Application 2024 & 2032
- Figure 59: Japan APAC Fruit and Vegetable Ingredients Market Revenue (Million), by Geography 2024 & 2032
- Figure 60: Japan APAC Fruit and Vegetable Ingredients Market Volume (K Tons), by Geography 2024 & 2032
- Figure 61: Japan APAC Fruit and Vegetable Ingredients Market Revenue Share (%), by Geography 2024 & 2032
- Figure 62: Japan APAC Fruit and Vegetable Ingredients Market Volume Share (%), by Geography 2024 & 2032
- Figure 63: Japan APAC Fruit and Vegetable Ingredients Market Revenue (Million), by Country 2024 & 2032
- Figure 64: Japan APAC Fruit and Vegetable Ingredients Market Volume (K Tons), by Country 2024 & 2032
- Figure 65: Japan APAC Fruit and Vegetable Ingredients Market Revenue Share (%), by Country 2024 & 2032
- Figure 66: Japan APAC Fruit and Vegetable Ingredients Market Volume Share (%), by Country 2024 & 2032
- Figure 67: India APAC Fruit and Vegetable Ingredients Market Revenue (Million), by Ingredient Type 2024 & 2032
- Figure 68: India APAC Fruit and Vegetable Ingredients Market Volume (K Tons), by Ingredient Type 2024 & 2032
- Figure 69: India APAC Fruit and Vegetable Ingredients Market Revenue Share (%), by Ingredient Type 2024 & 2032
- Figure 70: India APAC Fruit and Vegetable Ingredients Market Volume Share (%), by Ingredient Type 2024 & 2032
- Figure 71: India APAC Fruit and Vegetable Ingredients Market Revenue (Million), by Product Type 2024 & 2032
- Figure 72: India APAC Fruit and Vegetable Ingredients Market Volume (K Tons), by Product Type 2024 & 2032
- Figure 73: India APAC Fruit and Vegetable Ingredients Market Revenue Share (%), by Product Type 2024 & 2032
- Figure 74: India APAC Fruit and Vegetable Ingredients Market Volume Share (%), by Product Type 2024 & 2032
- Figure 75: India APAC Fruit and Vegetable Ingredients Market Revenue (Million), by Application 2024 & 2032
- Figure 76: India APAC Fruit and Vegetable Ingredients Market Volume (K Tons), by Application 2024 & 2032
- Figure 77: India APAC Fruit and Vegetable Ingredients Market Revenue Share (%), by Application 2024 & 2032
- Figure 78: India APAC Fruit and Vegetable Ingredients Market Volume Share (%), by Application 2024 & 2032
- Figure 79: India APAC Fruit and Vegetable Ingredients Market Revenue (Million), by Geography 2024 & 2032
- Figure 80: India APAC Fruit and Vegetable Ingredients Market Volume (K Tons), by Geography 2024 & 2032
- Figure 81: India APAC Fruit and Vegetable Ingredients Market Revenue Share (%), by Geography 2024 & 2032
- Figure 82: India APAC Fruit and Vegetable Ingredients Market Volume Share (%), by Geography 2024 & 2032
- Figure 83: India APAC Fruit and Vegetable Ingredients Market Revenue (Million), by Country 2024 & 2032
- Figure 84: India APAC Fruit and Vegetable Ingredients Market Volume (K Tons), by Country 2024 & 2032
- Figure 85: India APAC Fruit and Vegetable Ingredients Market Revenue Share (%), by Country 2024 & 2032
- Figure 86: India APAC Fruit and Vegetable Ingredients Market Volume Share (%), by Country 2024 & 2032
- Figure 87: Australia APAC Fruit and Vegetable Ingredients Market Revenue (Million), by Ingredient Type 2024 & 2032
- Figure 88: Australia APAC Fruit and Vegetable Ingredients Market Volume (K Tons), by Ingredient Type 2024 & 2032
- Figure 89: Australia APAC Fruit and Vegetable Ingredients Market Revenue Share (%), by Ingredient Type 2024 & 2032
- Figure 90: Australia APAC Fruit and Vegetable Ingredients Market Volume Share (%), by Ingredient Type 2024 & 2032
- Figure 91: Australia APAC Fruit and Vegetable Ingredients Market Revenue (Million), by Product Type 2024 & 2032
- Figure 92: Australia APAC Fruit and Vegetable Ingredients Market Volume (K Tons), by Product Type 2024 & 2032
- Figure 93: Australia APAC Fruit and Vegetable Ingredients Market Revenue Share (%), by Product Type 2024 & 2032
- Figure 94: Australia APAC Fruit and Vegetable Ingredients Market Volume Share (%), by Product Type 2024 & 2032
- Figure 95: Australia APAC Fruit and Vegetable Ingredients Market Revenue (Million), by Application 2024 & 2032
- Figure 96: Australia APAC Fruit and Vegetable Ingredients Market Volume (K Tons), by Application 2024 & 2032
- Figure 97: Australia APAC Fruit and Vegetable Ingredients Market Revenue Share (%), by Application 2024 & 2032
- Figure 98: Australia APAC Fruit and Vegetable Ingredients Market Volume Share (%), by Application 2024 & 2032
- Figure 99: Australia APAC Fruit and Vegetable Ingredients Market Revenue (Million), by Geography 2024 & 2032
- Figure 100: Australia APAC Fruit and Vegetable Ingredients Market Volume (K Tons), by Geography 2024 & 2032
- Figure 101: Australia APAC Fruit and Vegetable Ingredients Market Revenue Share (%), by Geography 2024 & 2032
- Figure 102: Australia APAC Fruit and Vegetable Ingredients Market Volume Share (%), by Geography 2024 & 2032
- Figure 103: Australia APAC Fruit and Vegetable Ingredients Market Revenue (Million), by Country 2024 & 2032
- Figure 104: Australia APAC Fruit and Vegetable Ingredients Market Volume (K Tons), by Country 2024 & 2032
- Figure 105: Australia APAC Fruit and Vegetable Ingredients Market Revenue Share (%), by Country 2024 & 2032
- Figure 106: Australia APAC Fruit and Vegetable Ingredients Market Volume Share (%), by Country 2024 & 2032
- Figure 107: Rest of Asia Pacific APAC Fruit and Vegetable Ingredients Market Revenue (Million), by Ingredient Type 2024 & 2032
- Figure 108: Rest of Asia Pacific APAC Fruit and Vegetable Ingredients Market Volume (K Tons), by Ingredient Type 2024 & 2032
- Figure 109: Rest of Asia Pacific APAC Fruit and Vegetable Ingredients Market Revenue Share (%), by Ingredient Type 2024 & 2032
- Figure 110: Rest of Asia Pacific APAC Fruit and Vegetable Ingredients Market Volume Share (%), by Ingredient Type 2024 & 2032
- Figure 111: Rest of Asia Pacific APAC Fruit and Vegetable Ingredients Market Revenue (Million), by Product Type 2024 & 2032
- Figure 112: Rest of Asia Pacific APAC Fruit and Vegetable Ingredients Market Volume (K Tons), by Product Type 2024 & 2032
- Figure 113: Rest of Asia Pacific APAC Fruit and Vegetable Ingredients Market Revenue Share (%), by Product Type 2024 & 2032
- Figure 114: Rest of Asia Pacific APAC Fruit and Vegetable Ingredients Market Volume Share (%), by Product Type 2024 & 2032
- Figure 115: Rest of Asia Pacific APAC Fruit and Vegetable Ingredients Market Revenue (Million), by Application 2024 & 2032
- Figure 116: Rest of Asia Pacific APAC Fruit and Vegetable Ingredients Market Volume (K Tons), by Application 2024 & 2032
- Figure 117: Rest of Asia Pacific APAC Fruit and Vegetable Ingredients Market Revenue Share (%), by Application 2024 & 2032
- Figure 118: Rest of Asia Pacific APAC Fruit and Vegetable Ingredients Market Volume Share (%), by Application 2024 & 2032
- Figure 119: Rest of Asia Pacific APAC Fruit and Vegetable Ingredients Market Revenue (Million), by Geography 2024 & 2032
- Figure 120: Rest of Asia Pacific APAC Fruit and Vegetable Ingredients Market Volume (K Tons), by Geography 2024 & 2032
- Figure 121: Rest of Asia Pacific APAC Fruit and Vegetable Ingredients Market Revenue Share (%), by Geography 2024 & 2032
- Figure 122: Rest of Asia Pacific APAC Fruit and Vegetable Ingredients Market Volume Share (%), by Geography 2024 & 2032
- Figure 123: Rest of Asia Pacific APAC Fruit and Vegetable Ingredients Market Revenue (Million), by Country 2024 & 2032
- Figure 124: Rest of Asia Pacific APAC Fruit and Vegetable Ingredients Market Volume (K Tons), by Country 2024 & 2032
- Figure 125: Rest of Asia Pacific APAC Fruit and Vegetable Ingredients Market Revenue Share (%), by Country 2024 & 2032
- Figure 126: Rest of Asia Pacific APAC Fruit and Vegetable Ingredients Market Volume Share (%), by Country 2024 & 2032
List of Tables
- Table 1: Global APAC Fruit and Vegetable Ingredients Market Revenue Million Forecast, by Region 2019 & 2032
- Table 2: Global APAC Fruit and Vegetable Ingredients Market Volume K Tons Forecast, by Region 2019 & 2032
- Table 3: Global APAC Fruit and Vegetable Ingredients Market Revenue Million Forecast, by Ingredient Type 2019 & 2032
- Table 4: Global APAC Fruit and Vegetable Ingredients Market Volume K Tons Forecast, by Ingredient Type 2019 & 2032
- Table 5: Global APAC Fruit and Vegetable Ingredients Market Revenue Million Forecast, by Product Type 2019 & 2032
- Table 6: Global APAC Fruit and Vegetable Ingredients Market Volume K Tons Forecast, by Product Type 2019 & 2032
- Table 7: Global APAC Fruit and Vegetable Ingredients Market Revenue Million Forecast, by Application 2019 & 2032
- Table 8: Global APAC Fruit and Vegetable Ingredients Market Volume K Tons Forecast, by Application 2019 & 2032
- Table 9: Global APAC Fruit and Vegetable Ingredients Market Revenue Million Forecast, by Geography 2019 & 2032
- Table 10: Global APAC Fruit and Vegetable Ingredients Market Volume K Tons Forecast, by Geography 2019 & 2032
- Table 11: Global APAC Fruit and Vegetable Ingredients Market Revenue Million Forecast, by Region 2019 & 2032
- Table 12: Global APAC Fruit and Vegetable Ingredients Market Volume K Tons Forecast, by Region 2019 & 2032
- Table 13: Global APAC Fruit and Vegetable Ingredients Market Revenue Million Forecast, by Country 2019 & 2032
- Table 14: Global APAC Fruit and Vegetable Ingredients Market Volume K Tons Forecast, by Country 2019 & 2032
- Table 15: United States APAC Fruit and Vegetable Ingredients Market Revenue (Million) Forecast, by Application 2019 & 2032
- Table 16: United States APAC Fruit and Vegetable Ingredients Market Volume (K Tons) Forecast, by Application 2019 & 2032
- Table 17: Canada APAC Fruit and Vegetable Ingredients Market Revenue (Million) Forecast, by Application 2019 & 2032
- Table 18: Canada APAC Fruit and Vegetable Ingredients Market Volume (K Tons) Forecast, by Application 2019 & 2032
- Table 19: Mexico APAC Fruit and Vegetable Ingredients Market Revenue (Million) Forecast, by Application 2019 & 2032
- Table 20: Mexico APAC Fruit and Vegetable Ingredients Market Volume (K Tons) Forecast, by Application 2019 & 2032
- Table 21: Global APAC Fruit and Vegetable Ingredients Market Revenue Million Forecast, by Country 2019 & 2032
- Table 22: Global APAC Fruit and Vegetable Ingredients Market Volume K Tons Forecast, by Country 2019 & 2032
- Table 23: Germany APAC Fruit and Vegetable Ingredients Market Revenue (Million) Forecast, by Application 2019 & 2032
- Table 24: Germany APAC Fruit and Vegetable Ingredients Market Volume (K Tons) Forecast, by Application 2019 & 2032
- Table 25: United Kingdom APAC Fruit and Vegetable Ingredients Market Revenue (Million) Forecast, by Application 2019 & 2032
- Table 26: United Kingdom APAC Fruit and Vegetable Ingredients Market Volume (K Tons) Forecast, by Application 2019 & 2032
- Table 27: France APAC Fruit and Vegetable Ingredients Market Revenue (Million) Forecast, by Application 2019 & 2032
- Table 28: France APAC Fruit and Vegetable Ingredients Market Volume (K Tons) Forecast, by Application 2019 & 2032
- Table 29: Spain APAC Fruit and Vegetable Ingredients Market Revenue (Million) Forecast, by Application 2019 & 2032
- Table 30: Spain APAC Fruit and Vegetable Ingredients Market Volume (K Tons) Forecast, by Application 2019 & 2032
- Table 31: Italy APAC Fruit and Vegetable Ingredients Market Revenue (Million) Forecast, by Application 2019 & 2032
- Table 32: Italy APAC Fruit and Vegetable Ingredients Market Volume (K Tons) Forecast, by Application 2019 & 2032
- Table 33: Spain APAC Fruit and Vegetable Ingredients Market Revenue (Million) Forecast, by Application 2019 & 2032
- Table 34: Spain APAC Fruit and Vegetable Ingredients Market Volume (K Tons) Forecast, by Application 2019 & 2032
- Table 35: Belgium APAC Fruit and Vegetable Ingredients Market Revenue (Million) Forecast, by Application 2019 & 2032
- Table 36: Belgium APAC Fruit and Vegetable Ingredients Market Volume (K Tons) Forecast, by Application 2019 & 2032
- Table 37: Netherland APAC Fruit and Vegetable Ingredients Market Revenue (Million) Forecast, by Application 2019 & 2032
- Table 38: Netherland APAC Fruit and Vegetable Ingredients Market Volume (K Tons) Forecast, by Application 2019 & 2032
- Table 39: Nordics APAC Fruit and Vegetable Ingredients Market Revenue (Million) Forecast, by Application 2019 & 2032
- Table 40: Nordics APAC Fruit and Vegetable Ingredients Market Volume (K Tons) Forecast, by Application 2019 & 2032
- Table 41: Rest of Europe APAC Fruit and Vegetable Ingredients Market Revenue (Million) Forecast, by Application 2019 & 2032
- Table 42: Rest of Europe APAC Fruit and Vegetable Ingredients Market Volume (K Tons) Forecast, by Application 2019 & 2032
- Table 43: Global APAC Fruit and Vegetable Ingredients Market Revenue Million Forecast, by Country 2019 & 2032
- Table 44: Global APAC Fruit and Vegetable Ingredients Market Volume K Tons Forecast, by Country 2019 & 2032
- Table 45: China APAC Fruit and Vegetable Ingredients Market Revenue (Million) Forecast, by Application 2019 & 2032
- Table 46: China APAC Fruit and Vegetable Ingredients Market Volume (K Tons) Forecast, by Application 2019 & 2032
- Table 47: Japan APAC Fruit and Vegetable Ingredients Market Revenue (Million) Forecast, by Application 2019 & 2032
- Table 48: Japan APAC Fruit and Vegetable Ingredients Market Volume (K Tons) Forecast, by Application 2019 & 2032
- Table 49: India APAC Fruit and Vegetable Ingredients Market Revenue (Million) Forecast, by Application 2019 & 2032
- Table 50: India APAC Fruit and Vegetable Ingredients Market Volume (K Tons) Forecast, by Application 2019 & 2032
- Table 51: South Korea APAC Fruit and Vegetable Ingredients Market Revenue (Million) Forecast, by Application 2019 & 2032
- Table 52: South Korea APAC Fruit and Vegetable Ingredients Market Volume (K Tons) Forecast, by Application 2019 & 2032
- Table 53: Southeast Asia APAC Fruit and Vegetable Ingredients Market Revenue (Million) Forecast, by Application 2019 & 2032
- Table 54: Southeast Asia APAC Fruit and Vegetable Ingredients Market Volume (K Tons) Forecast, by Application 2019 & 2032
- Table 55: Australia APAC Fruit and Vegetable Ingredients Market Revenue (Million) Forecast, by Application 2019 & 2032
- Table 56: Australia APAC Fruit and Vegetable Ingredients Market Volume (K Tons) Forecast, by Application 2019 & 2032
- Table 57: Indonesia APAC Fruit and Vegetable Ingredients Market Revenue (Million) Forecast, by Application 2019 & 2032
- Table 58: Indonesia APAC Fruit and Vegetable Ingredients Market Volume (K Tons) Forecast, by Application 2019 & 2032
- Table 59: Phillipes APAC Fruit and Vegetable Ingredients Market Revenue (Million) Forecast, by Application 2019 & 2032
- Table 60: Phillipes APAC Fruit and Vegetable Ingredients Market Volume (K Tons) Forecast, by Application 2019 & 2032
- Table 61: Singapore APAC Fruit and Vegetable Ingredients Market Revenue (Million) Forecast, by Application 2019 & 2032
- Table 62: Singapore APAC Fruit and Vegetable Ingredients Market Volume (K Tons) Forecast, by Application 2019 & 2032
- Table 63: Thailandc APAC Fruit and Vegetable Ingredients Market Revenue (Million) Forecast, by Application 2019 & 2032
- Table 64: Thailandc APAC Fruit and Vegetable Ingredients Market Volume (K Tons) Forecast, by Application 2019 & 2032
- Table 65: Rest of Asia Pacific APAC Fruit and Vegetable Ingredients Market Revenue (Million) Forecast, by Application 2019 & 2032
- Table 66: Rest of Asia Pacific APAC Fruit and Vegetable Ingredients Market Volume (K Tons) Forecast, by Application 2019 & 2032
- Table 67: Global APAC Fruit and Vegetable Ingredients Market Revenue Million Forecast, by Country 2019 & 2032
- Table 68: Global APAC Fruit and Vegetable Ingredients Market Volume K Tons Forecast, by Country 2019 & 2032
- Table 69: Brazil APAC Fruit and Vegetable Ingredients Market Revenue (Million) Forecast, by Application 2019 & 2032
- Table 70: Brazil APAC Fruit and Vegetable Ingredients Market Volume (K Tons) Forecast, by Application 2019 & 2032
- Table 71: Argentina APAC Fruit and Vegetable Ingredients Market Revenue (Million) Forecast, by Application 2019 & 2032
- Table 72: Argentina APAC Fruit and Vegetable Ingredients Market Volume (K Tons) Forecast, by Application 2019 & 2032
- Table 73: Peru APAC Fruit and Vegetable Ingredients Market Revenue (Million) Forecast, by Application 2019 & 2032
- Table 74: Peru APAC Fruit and Vegetable Ingredients Market Volume (K Tons) Forecast, by Application 2019 & 2032
- Table 75: Chile APAC Fruit and Vegetable Ingredients Market Revenue (Million) Forecast, by Application 2019 & 2032
- Table 76: Chile APAC Fruit and Vegetable Ingredients Market Volume (K Tons) Forecast, by Application 2019 & 2032
- Table 77: Colombia APAC Fruit and Vegetable Ingredients Market Revenue (Million) Forecast, by Application 2019 & 2032
- Table 78: Colombia APAC Fruit and Vegetable Ingredients Market Volume (K Tons) Forecast, by Application 2019 & 2032
- Table 79: Ecuador APAC Fruit and Vegetable Ingredients Market Revenue (Million) Forecast, by Application 2019 & 2032
- Table 80: Ecuador APAC Fruit and Vegetable Ingredients Market Volume (K Tons) Forecast, by Application 2019 & 2032
- Table 81: Venezuela APAC Fruit and Vegetable Ingredients Market Revenue (Million) Forecast, by Application 2019 & 2032
- Table 82: Venezuela APAC Fruit and Vegetable Ingredients Market Volume (K Tons) Forecast, by Application 2019 & 2032
- Table 83: Rest of South America APAC Fruit and Vegetable Ingredients Market Revenue (Million) Forecast, by Application 2019 & 2032
- Table 84: Rest of South America APAC Fruit and Vegetable Ingredients Market Volume (K Tons) Forecast, by Application 2019 & 2032
- Table 85: Global APAC Fruit and Vegetable Ingredients Market Revenue Million Forecast, by Country 2019 & 2032
- Table 86: Global APAC Fruit and Vegetable Ingredients Market Volume K Tons Forecast, by Country 2019 & 2032
- Table 87: United States APAC Fruit and Vegetable Ingredients Market Revenue (Million) Forecast, by Application 2019 & 2032
- Table 88: United States APAC Fruit and Vegetable Ingredients Market Volume (K Tons) Forecast, by Application 2019 & 2032
- Table 89: Canada APAC Fruit and Vegetable Ingredients Market Revenue (Million) Forecast, by Application 2019 & 2032
- Table 90: Canada APAC Fruit and Vegetable Ingredients Market Volume (K Tons) Forecast, by Application 2019 & 2032
- Table 91: Mexico APAC Fruit and Vegetable Ingredients Market Revenue (Million) Forecast, by Application 2019 & 2032
- Table 92: Mexico APAC Fruit and Vegetable Ingredients Market Volume (K Tons) Forecast, by Application 2019 & 2032
- Table 93: Global APAC Fruit and Vegetable Ingredients Market Revenue Million Forecast, by Country 2019 & 2032
- Table 94: Global APAC Fruit and Vegetable Ingredients Market Volume K Tons Forecast, by Country 2019 & 2032
- Table 95: United Arab Emirates APAC Fruit and Vegetable Ingredients Market Revenue (Million) Forecast, by Application 2019 & 2032
- Table 96: United Arab Emirates APAC Fruit and Vegetable Ingredients Market Volume (K Tons) Forecast, by Application 2019 & 2032
- Table 97: Saudi Arabia APAC Fruit and Vegetable Ingredients Market Revenue (Million) Forecast, by Application 2019 & 2032
- Table 98: Saudi Arabia APAC Fruit and Vegetable Ingredients Market Volume (K Tons) Forecast, by Application 2019 & 2032
- Table 99: South Africa APAC Fruit and Vegetable Ingredients Market Revenue (Million) Forecast, by Application 2019 & 2032
- Table 100: South Africa APAC Fruit and Vegetable Ingredients Market Volume (K Tons) Forecast, by Application 2019 & 2032
- Table 101: Rest of Middle East and Africa APAC Fruit and Vegetable Ingredients Market Revenue (Million) Forecast, by Application 2019 & 2032
- Table 102: Rest of Middle East and Africa APAC Fruit and Vegetable Ingredients Market Volume (K Tons) Forecast, by Application 2019 & 2032
- Table 103: Global APAC Fruit and Vegetable Ingredients Market Revenue Million Forecast, by Ingredient Type 2019 & 2032
- Table 104: Global APAC Fruit and Vegetable Ingredients Market Volume K Tons Forecast, by Ingredient Type 2019 & 2032
- Table 105: Global APAC Fruit and Vegetable Ingredients Market Revenue Million Forecast, by Product Type 2019 & 2032
- Table 106: Global APAC Fruit and Vegetable Ingredients Market Volume K Tons Forecast, by Product Type 2019 & 2032
- Table 107: Global APAC Fruit and Vegetable Ingredients Market Revenue Million Forecast, by Application 2019 & 2032
- Table 108: Global APAC Fruit and Vegetable Ingredients Market Volume K Tons Forecast, by Application 2019 & 2032
- Table 109: Global APAC Fruit and Vegetable Ingredients Market Revenue Million Forecast, by Geography 2019 & 2032
- Table 110: Global APAC Fruit and Vegetable Ingredients Market Volume K Tons Forecast, by Geography 2019 & 2032
- Table 111: Global APAC Fruit and Vegetable Ingredients Market Revenue Million Forecast, by Country 2019 & 2032
- Table 112: Global APAC Fruit and Vegetable Ingredients Market Volume K Tons Forecast, by Country 2019 & 2032
- Table 113: Global APAC Fruit and Vegetable Ingredients Market Revenue Million Forecast, by Ingredient Type 2019 & 2032
- Table 114: Global APAC Fruit and Vegetable Ingredients Market Volume K Tons Forecast, by Ingredient Type 2019 & 2032
- Table 115: Global APAC Fruit and Vegetable Ingredients Market Revenue Million Forecast, by Product Type 2019 & 2032
- Table 116: Global APAC Fruit and Vegetable Ingredients Market Volume K Tons Forecast, by Product Type 2019 & 2032
- Table 117: Global APAC Fruit and Vegetable Ingredients Market Revenue Million Forecast, by Application 2019 & 2032
- Table 118: Global APAC Fruit and Vegetable Ingredients Market Volume K Tons Forecast, by Application 2019 & 2032
- Table 119: Global APAC Fruit and Vegetable Ingredients Market Revenue Million Forecast, by Geography 2019 & 2032
- Table 120: Global APAC Fruit and Vegetable Ingredients Market Volume K Tons Forecast, by Geography 2019 & 2032
- Table 121: Global APAC Fruit and Vegetable Ingredients Market Revenue Million Forecast, by Country 2019 & 2032
- Table 122: Global APAC Fruit and Vegetable Ingredients Market Volume K Tons Forecast, by Country 2019 & 2032
- Table 123: Global APAC Fruit and Vegetable Ingredients Market Revenue Million Forecast, by Ingredient Type 2019 & 2032
- Table 124: Global APAC Fruit and Vegetable Ingredients Market Volume K Tons Forecast, by Ingredient Type 2019 & 2032
- Table 125: Global APAC Fruit and Vegetable Ingredients Market Revenue Million Forecast, by Product Type 2019 & 2032
- Table 126: Global APAC Fruit and Vegetable Ingredients Market Volume K Tons Forecast, by Product Type 2019 & 2032
- Table 127: Global APAC Fruit and Vegetable Ingredients Market Revenue Million Forecast, by Application 2019 & 2032
- Table 128: Global APAC Fruit and Vegetable Ingredients Market Volume K Tons Forecast, by Application 2019 & 2032
- Table 129: Global APAC Fruit and Vegetable Ingredients Market Revenue Million Forecast, by Geography 2019 & 2032
- Table 130: Global APAC Fruit and Vegetable Ingredients Market Volume K Tons Forecast, by Geography 2019 & 2032
- Table 131: Global APAC Fruit and Vegetable Ingredients Market Revenue Million Forecast, by Country 2019 & 2032
- Table 132: Global APAC Fruit and Vegetable Ingredients Market Volume K Tons Forecast, by Country 2019 & 2032
- Table 133: Global APAC Fruit and Vegetable Ingredients Market Revenue Million Forecast, by Ingredient Type 2019 & 2032
- Table 134: Global APAC Fruit and Vegetable Ingredients Market Volume K Tons Forecast, by Ingredient Type 2019 & 2032
- Table 135: Global APAC Fruit and Vegetable Ingredients Market Revenue Million Forecast, by Product Type 2019 & 2032
- Table 136: Global APAC Fruit and Vegetable Ingredients Market Volume K Tons Forecast, by Product Type 2019 & 2032
- Table 137: Global APAC Fruit and Vegetable Ingredients Market Revenue Million Forecast, by Application 2019 & 2032
- Table 138: Global APAC Fruit and Vegetable Ingredients Market Volume K Tons Forecast, by Application 2019 & 2032
- Table 139: Global APAC Fruit and Vegetable Ingredients Market Revenue Million Forecast, by Geography 2019 & 2032
- Table 140: Global APAC Fruit and Vegetable Ingredients Market Volume K Tons Forecast, by Geography 2019 & 2032
- Table 141: Global APAC Fruit and Vegetable Ingredients Market Revenue Million Forecast, by Country 2019 & 2032
- Table 142: Global APAC Fruit and Vegetable Ingredients Market Volume K Tons Forecast, by Country 2019 & 2032
- Table 143: Global APAC Fruit and Vegetable Ingredients Market Revenue Million Forecast, by Ingredient Type 2019 & 2032
- Table 144: Global APAC Fruit and Vegetable Ingredients Market Volume K Tons Forecast, by Ingredient Type 2019 & 2032
- Table 145: Global APAC Fruit and Vegetable Ingredients Market Revenue Million Forecast, by Product Type 2019 & 2032
- Table 146: Global APAC Fruit and Vegetable Ingredients Market Volume K Tons Forecast, by Product Type 2019 & 2032
- Table 147: Global APAC Fruit and Vegetable Ingredients Market Revenue Million Forecast, by Application 2019 & 2032
- Table 148: Global APAC Fruit and Vegetable Ingredients Market Volume K Tons Forecast, by Application 2019 & 2032
- Table 149: Global APAC Fruit and Vegetable Ingredients Market Revenue Million Forecast, by Geography 2019 & 2032
- Table 150: Global APAC Fruit and Vegetable Ingredients Market Volume K Tons Forecast, by Geography 2019 & 2032
- Table 151: Global APAC Fruit and Vegetable Ingredients Market Revenue Million Forecast, by Country 2019 & 2032
- Table 152: Global APAC Fruit and Vegetable Ingredients Market Volume K Tons Forecast, by Country 2019 & 2032
Frequently Asked Questions
1. What is the projected Compound Annual Growth Rate (CAGR) of the APAC Fruit and Vegetable Ingredients Market?
The projected CAGR is approximately 4.98%.
2. Which companies are prominent players in the APAC Fruit and Vegetable Ingredients Market?
Key companies in the market include Sunopta, Yaax International Inc *List Not Exhaustive, Dohler Group, Juremont Pty Ltd, AGRANA Beteiligungs-AG, Archer Daniels Midland Company, Sensient Technologies Corporation, Frutarom (Taura Natural Ingredient).
3. What are the main segments of the APAC Fruit and Vegetable Ingredients Market?
The market segments include Ingredient Type, Product Type, Application, Geography.
4. Can you provide details about the market size?
The market size is estimated to be USD XX Million as of 2022.
5. What are some drivers contributing to market growth?
Increasing Demand for Protein-Rich Food; Increasing Demand for Plant-Based and Organic Ingredients.
6. What are the notable trends driving market growth?
Growing Application of Natural Ingredients.
7. Are there any restraints impacting market growth?
Presence of Alternative Proteins.
8. Can you provide examples of recent developments in the market?
N/A
9. What pricing options are available for accessing the report?
Pricing options include single-user, multi-user, and enterprise licenses priced at USD 4750, USD 5250, and USD 8750 respectively.
10. Is the market size provided in terms of value or volume?
The market size is provided in terms of value, measured in Million and volume, measured in K Tons.
11. Are there any specific market keywords associated with the report?
Yes, the market keyword associated with the report is "APAC Fruit and Vegetable Ingredients Market," which aids in identifying and referencing the specific market segment covered.
12. How do I determine which pricing option suits my needs best?
The pricing options vary based on user requirements and access needs. Individual users may opt for single-user licenses, while businesses requiring broader access may choose multi-user or enterprise licenses for cost-effective access to the report.
13. Are there any additional resources or data provided in the APAC Fruit and Vegetable Ingredients Market report?
While the report offers comprehensive insights, it's advisable to review the specific contents or supplementary materials provided to ascertain if additional resources or data are available.
14. How can I stay updated on further developments or reports in the APAC Fruit and Vegetable Ingredients Market?
To stay informed about further developments, trends, and reports in the APAC Fruit and Vegetable Ingredients Market, consider subscribing to industry newsletters, following relevant companies and organizations, or regularly checking reputable industry news sources and publications.
Methodology
Step 1 - Identification of Relevant Samples Size from Population Database


Step 2 - Approaches for Defining Global Market Size (Value, Volume* & Price*)

Note*: In applicable scenarios
Step 3 - Data Sources
Primary Research
- Web Analytics
- Survey Reports
- Research Institute
- Latest Research Reports
- Opinion Leaders
Secondary Research
- Annual Reports
- White Paper
- Latest Press Release
- Industry Association
- Paid Database
- Investor Presentations

Step 4 - Data Triangulation
Involves using different sources of information in order to increase the validity of a study
These sources are likely to be stakeholders in a program - participants, other researchers, program staff, other community members, and so on.
Then we put all data in single framework & apply various statistical tools to find out the dynamic on the market.
During the analysis stage, feedback from the stakeholder groups would be compared to determine areas of agreement as well as areas of divergence


