

Key Insights
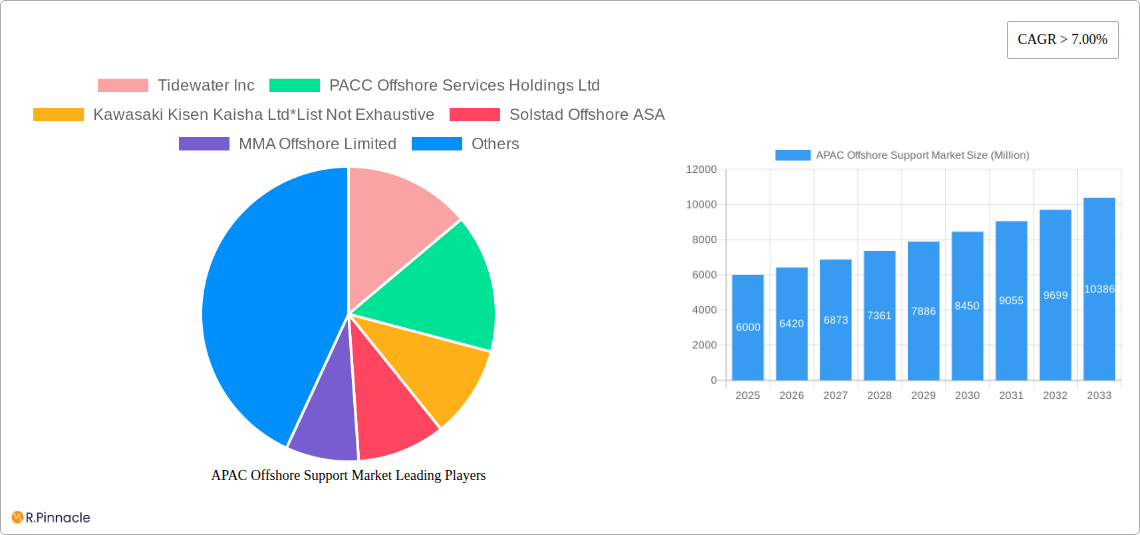
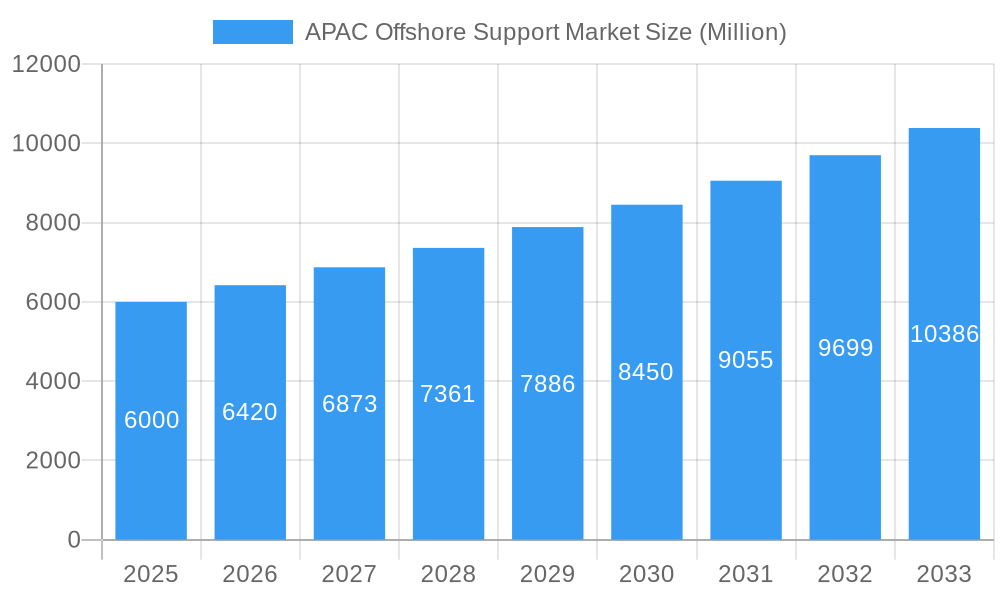
The Asia-Pacific (APAC) offshore support vessel market is experiencing robust growth, fueled by a surge in offshore energy exploration and renewable energy projects. The region's significant oil and gas reserves, coupled with a burgeoning renewable energy sector, particularly in countries like China, Japan, and India, are driving demand for specialized vessels like Anchor Handling Tug Supply Vessels (AHTS) and Platform Supply Vessels (PSV). The market's Compound Annual Growth Rate (CAGR) exceeding 7% indicates a sustained period of expansion. While the precise market size for 2025 is unavailable, considering the global market size and the APAC region's significant share of offshore activity, a reasonable estimate for the APAC market in 2025 would be between $5-7 billion USD. This is based on the global market size and the APAC region's significant contribution to global offshore energy activity. This growth is further propelled by government initiatives promoting energy independence and diversification across various APAC nations. However, market restraints exist, including fluctuating oil prices, environmental regulations impacting operational costs, and potential geopolitical instability in certain regions. The segmentation reveals a strong demand for AHT/AHTS vessels for deep-sea operations and PSVs for logistical support, with the oil and gas sector currently dominating application. The renewable energy segment shows significant potential for future growth as offshore wind farms and other projects gain momentum.
APAC Offshore Support Market Market Size (In Billion)
The competitive landscape is marked by both established international players and regional companies. Key players such as Tidewater Inc., PACC Offshore Services Holdings Ltd., and others are strategically positioning themselves to benefit from this expanding market. The continued growth trajectory is expected to attract further investments in vessel construction and technological advancements. The market’s success will be contingent on addressing challenges like fluctuating oil prices and regulatory compliance while embracing technological innovations to enhance operational efficiency and environmental sustainability. The next decade anticipates increasing demand for advanced vessels capable of supporting next-generation offshore renewable energy operations, shaping future market dynamics.
APAC Offshore Support Market Company Market Share
APAC Offshore Support Market Report: 2019-2033
This comprehensive report provides a detailed analysis of the Asia-Pacific (APAC) offshore support market, covering the period 2019-2033. It offers actionable insights for industry professionals, investors, and strategic decision-makers seeking to understand the market's dynamics, growth drivers, and future potential. The report leverages extensive data analysis and expert insights to provide a clear picture of this rapidly evolving market. Key players such as Tidewater Inc, PACC Offshore Services Holdings Ltd, Kawasaki Kisen Kaisha Ltd, Solstad Offshore ASA, MMA Offshore Limited, Seacor Marine Holdings Inc, Nam Cheong Offshore Pte Ltd, and Maersk Supply Services AS are profiled, although the list is not exhaustive.
APAC Offshore Support Market Structure & Innovation Trends
This section analyzes the competitive landscape of the APAC offshore support market, encompassing market concentration, innovation drivers, regulatory frameworks, and M&A activities. The market is characterized by a moderately concentrated structure, with a few major players holding significant market share. However, several smaller, specialized companies also compete vigorously, particularly in niche segments like renewable energy support. Innovation is driven by the need for improved efficiency, safety, and environmental sustainability. Stringent regulatory frameworks, particularly regarding emissions and safety standards, influence technological advancements. The substitution of traditional vessels with more technologically advanced ones is ongoing, while M&A activity has been moderate, with deal values averaging around xx Million in recent years. Key metrics examined include market share distribution, concentration ratios, and M&A deal values across the historical period (2019-2024).
- Market concentration: Moderate, with top 5 players holding approximately xx% market share in 2024.
- M&A activity: xx deals recorded between 2019 and 2024, with an average deal value of xx Million.
- Key innovation drivers: Stringent environmental regulations, demand for enhanced operational efficiency, and technological advancements in vessel design.
APAC Offshore Support Market Market Dynamics & Trends
This section explores the key dynamics shaping the APAC offshore support market's growth trajectory. The market is experiencing significant growth, driven primarily by the expansion of offshore oil and gas activities and the burgeoning renewable energy sector. Technological advancements, such as the adoption of autonomous vessels and advanced navigation systems, are further accelerating market growth. Consumer preferences are shifting towards more sustainable and efficient offshore support solutions, influencing both technology and service offerings. Competitive dynamics are characterized by both intense price competition and strategic partnerships among key players. The Compound Annual Growth Rate (CAGR) during the forecast period (2025-2033) is estimated at xx%, while market penetration in emerging markets is projected to rise from xx% to xx% by 2033.
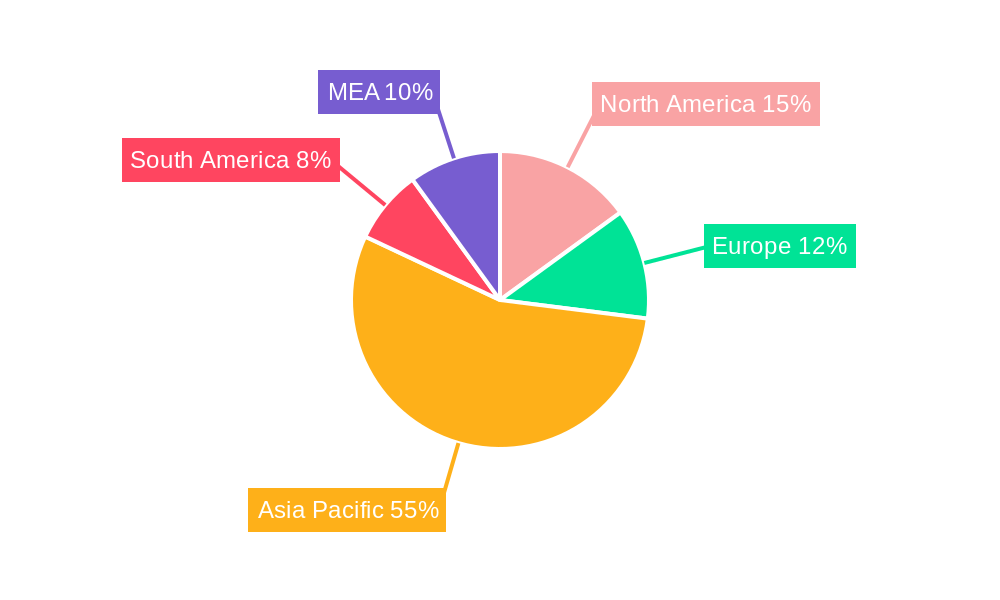
Dominant Regions & Segments in APAC Offshore Support Market
This section identifies the leading regions, countries, and segments within the APAC offshore support market. While the market is geographically diverse, **Southeast Asia** currently exhibits the strongest growth, driven by robust offshore oil and gas exploration and production activity, coupled with significant investments in emerging renewable energy ventures. Within segments, Anchor Handling Tug/Anchor Handling Tower Supply Vessels (AHT/AHTS) and Platform Supply Vessels (PSVs) continue to dominate, reflecting the sustained demand for essential offshore support services. However, there's a notable surge in demand for specialized PSVs and other vessels involved in the construction, installation, and maintenance of offshore wind farms, highlighting the transformative impact of the renewable energy sector on market dynamics.
Key Drivers for Dominant Regions/Segments:
- Strong government initiatives and financial incentives for renewable energy projects, particularly offshore wind.
- Continued and intensified investment in both conventional oil and gas exploration and the development of mature fields.
- Escalating demand for a diverse range of specialized vessels, from construction support vessels to those for subsea operations, in the rapidly expanding offshore wind industry.
- Favorable macroeconomic conditions, including supportive regulatory frameworks and ongoing infrastructure development, fostering a conducive environment for offshore activities.
- Increasing focus on energy security and diversification within APAC nations, leading to greater exploration and development efforts offshore.
APAC Offshore Support Market Product Innovations
Recent product innovations focus on enhancing efficiency, safety, and environmental performance. This includes the development of autonomous and remotely operated vessels, advanced dynamic positioning systems, and emission-reducing technologies. These innovations are improving operational efficiency, reducing downtime, and lowering environmental impact, contributing to a better market fit and a competitive advantage.
Report Scope & Segmentation Analysis
This report segments the APAC offshore support market by vessel type (Anchor Handling Tug/Anchor Handling Tower Supply Vessels (AHT/AHTS), Platform Supply Vessels, Other Types) and application (Oil and gas, Renewable energy, Other applications). Each segment shows varying growth rates and competitive landscapes. The AHT/AHTS segment is expected to show steady growth, driven by ongoing oil and gas exploration. The Platform Supply Vessel segment is projected to experience the highest growth rate due to increasing renewable energy investments. The "Other Types" segment demonstrates moderate growth driven by specialized support activities. The oil and gas sector remains a dominant application, but renewable energy is emerging as a significant growth driver.
Key Drivers of APAC Offshore Support Market Growth
The APAC offshore support market is experiencing robust expansion, propelled by a confluence of powerful drivers. A fundamental catalyst is the escalating global and regional demand for offshore energy resources, encompassing both traditional oil and gas and the rapidly growing renewable energy sector. Government commitment to developing sustainable energy infrastructure, particularly through significant investments in offshore wind farms, acts as a powerful accelerant. Furthermore, continuous innovation in vessel design, operational efficiency, and the adoption of digital technologies are leading to enhanced productivity, cost optimization, and improved safety standards. The prevailing positive economic outlook across many key APAC economies, characterized by increasing industrial activity and infrastructure spending, further underpins and amplifies market expansion.
Challenges in the APAC Offshore Support Market Sector
The APAC offshore support market faces challenges like fluctuating oil prices that impact investment decisions in the oil and gas sector, leading to market volatility. Furthermore, supply chain disruptions and the increasing cost of skilled labor present operational obstacles. Competition from established international players and local companies also requires continuous innovation and efficiency improvements.
Emerging Opportunities in APAC Offshore Support Market
Emerging opportunities arise from the rapid expansion of renewable energy projects, creating significant demand for specialized support vessels. Technological advancements, particularly in automation and remote operations, open new avenues for efficiency gains and cost reductions. Additionally, the growth of offshore aquaculture and other specialized maritime sectors presents niche opportunities for innovative offshore support services.
Leading Players in the APAC Offshore Support Market Market
- Tidewater Inc
- PACC Offshore Services Holdings Ltd
- Kawasaki Kisen Kaisha Ltd
- Solstad Offshore ASA
- MMA Offshore Limited
- Seacor Marine Holdings Inc
- Nam Cheong Offshore Pte Ltd
- Maersk Supply Services AS
Key Developments in APAC Offshore Support Market Industry
- January 2022: TSS Pioneer, an offshore support vessel, completed sea trials and will be delivered to Ta Shang Marine.
- October 2021: Dong Fang Offshore launched the first Taiwan-flagged walk-to-work vessel, showcasing growth in the renewable energy sector.
Future Outlook for APAC Offshore Support Market Market
The APAC offshore support market exhibits substantial growth potential driven by the continuous expansion of the offshore energy sector and the growing emphasis on renewable energy sources. Strategic partnerships, technological advancements, and robust government support are expected to accelerate market growth further, generating significant opportunities for both established and emerging players in the years to come.
APAC Offshore Support Market Segmentation
- 1. Production Analysis
- 2. Consumption Analysis
- 3. Import Market Analysis (Value & Volume)
- 4. Export Market Analysis (Value & Volume)
- 5. Price Trend Analysis
APAC Offshore Support Market Segmentation By Geography
- 1. China
- 2. India
- 3. Japan
- 4. South Korea
- 5. Australia
- 6. Singapore
- 7. Indonesia
- 8. Rest of Asia Pacific
APAC Offshore Support Market Regional Market Share
Geographic Coverage of APAC Offshore Support Market
APAC Offshore Support Market REPORT HIGHLIGHTS
| Aspects | Details |
|---|---|
| Study Period | 2020-2034 |
| Base Year | 2025 |
| Estimated Year | 2026 |
| Forecast Period | 2026-2034 |
| Historical Period | 2020-2025 |
| Growth Rate | CAGR of 4.2% from 2020-2034 |
| Segmentation |
|
Table of Contents
- 1. Introduction
- 1.1. Research Scope
- 1.2. Market Segmentation
- 1.3. Research Objective
- 1.4. Definitions and Assumptions
- 2. Executive Summary
- 2.1. Market Snapshot
- 3. Market Dynamics
- 3.1. Market Drivers
- 3.2. Market Restrains
- 3.3. Market Trends
- 3.4. Market Opportunities
- 4. Market Factor Analysis
- 4.1. Porters Five Forces
- 4.1.1. Bargaining Power of Suppliers
- 4.1.2. Bargaining Power of Buyers
- 4.1.3. Threat of New Entrants
- 4.1.4. Threat of Substitutes
- 4.1.5. Competitive Rivalry
- 4.2. PESTEL analysis
- 4.3. BCG Analysis
- 4.3.1. Stars (High Growth, High Market Share)
- 4.3.2. Cash Cows (Low Growth, High Market Share)
- 4.3.3. Question Mark (High Growth, Low Market Share)
- 4.3.4. Dogs (Low Growth, Low Market Share)
- 4.4. Ansoff Matrix Analysis
- 4.5. Supply Chain Analysis
- 4.6. Regulatory Landscape
- 4.7. Current Market Potential and Opportunity Assessment (TAM–SAM–SOM Framework)
- 4.8. PRI Analyst Note
- 4.1. Porters Five Forces
- 5. Market Analysis, Insights and Forecast 2021-2033
- 5.1. Market Analysis, Insights and Forecast - by Production Analysis
- 5.2. Market Analysis, Insights and Forecast - by Consumption Analysis
- 5.3. Market Analysis, Insights and Forecast - by Import Market Analysis (Value & Volume)
- 5.4. Market Analysis, Insights and Forecast - by Export Market Analysis (Value & Volume)
- 5.5. Market Analysis, Insights and Forecast - by Price Trend Analysis
- 5.6. Market Analysis, Insights and Forecast - by Region
- 5.6.1. China
- 5.6.2. India
- 5.6.3. Japan
- 5.6.4. South Korea
- 5.6.5. Australia
- 5.6.6. Singapore
- 5.6.7. Indonesia
- 5.6.8. Rest of Asia Pacific
- 6. Global APAC Offshore Support Market Analysis, Insights and Forecast, 2021-2033
- 6.1. Market Analysis, Insights and Forecast - by Production Analysis
- 6.2. Market Analysis, Insights and Forecast - by Consumption Analysis
- 6.3. Market Analysis, Insights and Forecast - by Import Market Analysis (Value & Volume)
- 6.4. Market Analysis, Insights and Forecast - by Export Market Analysis (Value & Volume)
- 6.5. Market Analysis, Insights and Forecast - by Price Trend Analysis
- 7. China APAC Offshore Support Market Analysis, Insights and Forecast, 2020-2032
- 7.1. Market Analysis, Insights and Forecast - by Production Analysis
- 7.2. Market Analysis, Insights and Forecast - by Consumption Analysis
- 7.3. Market Analysis, Insights and Forecast - by Import Market Analysis (Value & Volume)
- 7.4. Market Analysis, Insights and Forecast - by Export Market Analysis (Value & Volume)
- 7.5. Market Analysis, Insights and Forecast - by Price Trend Analysis
- 8. India APAC Offshore Support Market Analysis, Insights and Forecast, 2020-2032
- 8.1. Market Analysis, Insights and Forecast - by Production Analysis
- 8.2. Market Analysis, Insights and Forecast - by Consumption Analysis
- 8.3. Market Analysis, Insights and Forecast - by Import Market Analysis (Value & Volume)
- 8.4. Market Analysis, Insights and Forecast - by Export Market Analysis (Value & Volume)
- 8.5. Market Analysis, Insights and Forecast - by Price Trend Analysis
- 9. Japan APAC Offshore Support Market Analysis, Insights and Forecast, 2020-2032
- 9.1. Market Analysis, Insights and Forecast - by Production Analysis
- 9.2. Market Analysis, Insights and Forecast - by Consumption Analysis
- 9.3. Market Analysis, Insights and Forecast - by Import Market Analysis (Value & Volume)
- 9.4. Market Analysis, Insights and Forecast - by Export Market Analysis (Value & Volume)
- 9.5. Market Analysis, Insights and Forecast - by Price Trend Analysis
- 10. South Korea APAC Offshore Support Market Analysis, Insights and Forecast, 2020-2032
- 10.1. Market Analysis, Insights and Forecast - by Production Analysis
- 10.2. Market Analysis, Insights and Forecast - by Consumption Analysis
- 10.3. Market Analysis, Insights and Forecast - by Import Market Analysis (Value & Volume)
- 10.4. Market Analysis, Insights and Forecast - by Export Market Analysis (Value & Volume)
- 10.5. Market Analysis, Insights and Forecast - by Price Trend Analysis
- 11. Australia APAC Offshore Support Market Analysis, Insights and Forecast, 2020-2032
- 11.1. Market Analysis, Insights and Forecast - by Production Analysis
- 11.2. Market Analysis, Insights and Forecast - by Consumption Analysis
- 11.3. Market Analysis, Insights and Forecast - by Import Market Analysis (Value & Volume)
- 11.4. Market Analysis, Insights and Forecast - by Export Market Analysis (Value & Volume)
- 11.5. Market Analysis, Insights and Forecast - by Price Trend Analysis
- 12. Singapore APAC Offshore Support Market Analysis, Insights and Forecast, 2020-2032
- 12.1. Market Analysis, Insights and Forecast - by Production Analysis
- 12.2. Market Analysis, Insights and Forecast - by Consumption Analysis
- 12.3. Market Analysis, Insights and Forecast - by Import Market Analysis (Value & Volume)
- 12.4. Market Analysis, Insights and Forecast - by Export Market Analysis (Value & Volume)
- 12.5. Market Analysis, Insights and Forecast - by Price Trend Analysis
- 13. Indonesia APAC Offshore Support Market Analysis, Insights and Forecast, 2020-2032
- 13.1. Market Analysis, Insights and Forecast - by Production Analysis
- 13.2. Market Analysis, Insights and Forecast - by Consumption Analysis
- 13.3. Market Analysis, Insights and Forecast - by Import Market Analysis (Value & Volume)
- 13.4. Market Analysis, Insights and Forecast - by Export Market Analysis (Value & Volume)
- 13.5. Market Analysis, Insights and Forecast - by Price Trend Analysis
- 14. Rest of Asia Pacific APAC Offshore Support Market Analysis, Insights and Forecast, 2020-2032
- 14.1. Market Analysis, Insights and Forecast - by Production Analysis
- 14.2. Market Analysis, Insights and Forecast - by Consumption Analysis
- 14.3. Market Analysis, Insights and Forecast - by Import Market Analysis (Value & Volume)
- 14.4. Market Analysis, Insights and Forecast - by Export Market Analysis (Value & Volume)
- 14.5. Market Analysis, Insights and Forecast - by Price Trend Analysis
- 15. Competitive Analysis
- 15.1. Company Profiles
- 15.1.1 Tidewater Inc
- 15.1.1.1. Company Overview
- 15.1.1.2. Products
- 15.1.1.3. Company Financials
- 15.1.1.4. SWOT Analysis
- 15.1.2 PACC Offshore Services Holdings Ltd
- 15.1.2.1. Company Overview
- 15.1.2.2. Products
- 15.1.2.3. Company Financials
- 15.1.2.4. SWOT Analysis
- 15.1.3 Kawasaki Kisen Kaisha Ltd*List Not Exhaustive
- 15.1.3.1. Company Overview
- 15.1.3.2. Products
- 15.1.3.3. Company Financials
- 15.1.3.4. SWOT Analysis
- 15.1.4 Solstad Offshore ASA
- 15.1.4.1. Company Overview
- 15.1.4.2. Products
- 15.1.4.3. Company Financials
- 15.1.4.4. SWOT Analysis
- 15.1.5 MMA Offshore Limited
- 15.1.5.1. Company Overview
- 15.1.5.2. Products
- 15.1.5.3. Company Financials
- 15.1.5.4. SWOT Analysis
- 15.1.6 Seacor Marine Holdings Inc
- 15.1.6.1. Company Overview
- 15.1.6.2. Products
- 15.1.6.3. Company Financials
- 15.1.6.4. SWOT Analysis
- 15.1.7 Nam Cheong Offshore Pte Ltd
- 15.1.7.1. Company Overview
- 15.1.7.2. Products
- 15.1.7.3. Company Financials
- 15.1.7.4. SWOT Analysis
- 15.1.8 Maersk Supply Services AS
- 15.1.8.1. Company Overview
- 15.1.8.2. Products
- 15.1.8.3. Company Financials
- 15.1.8.4. SWOT Analysis
- 15.1.1 Tidewater Inc
- 15.2. Market Entropy
- 15.2.1 Company's Key Areas Served
- 15.2.2 Recent Developments
- 15.3. Company Market Share Analysis 2025
- 15.3.1 Top 5 Companies Market Share Analysis
- 15.3.2 Top 3 Companies Market Share Analysis
- 15.4. List of Potential Customers
- 16. Research Methodology
List of Figures
- Figure 1: Global APAC Offshore Support Market Revenue Breakdown (billion, %) by Region 2025 & 2033
- Figure 2: China APAC Offshore Support Market Revenue (billion), by Production Analysis 2025 & 2033
- Figure 3: China APAC Offshore Support Market Revenue Share (%), by Production Analysis 2025 & 2033
- Figure 4: China APAC Offshore Support Market Revenue (billion), by Consumption Analysis 2025 & 2033
- Figure 5: China APAC Offshore Support Market Revenue Share (%), by Consumption Analysis 2025 & 2033
- Figure 6: China APAC Offshore Support Market Revenue (billion), by Import Market Analysis (Value & Volume) 2025 & 2033
- Figure 7: China APAC Offshore Support Market Revenue Share (%), by Import Market Analysis (Value & Volume) 2025 & 2033
- Figure 8: China APAC Offshore Support Market Revenue (billion), by Export Market Analysis (Value & Volume) 2025 & 2033
- Figure 9: China APAC Offshore Support Market Revenue Share (%), by Export Market Analysis (Value & Volume) 2025 & 2033
- Figure 10: China APAC Offshore Support Market Revenue (billion), by Price Trend Analysis 2025 & 2033
- Figure 11: China APAC Offshore Support Market Revenue Share (%), by Price Trend Analysis 2025 & 2033
- Figure 12: China APAC Offshore Support Market Revenue (billion), by Country 2025 & 2033
- Figure 13: China APAC Offshore Support Market Revenue Share (%), by Country 2025 & 2033
- Figure 14: India APAC Offshore Support Market Revenue (billion), by Production Analysis 2025 & 2033
- Figure 15: India APAC Offshore Support Market Revenue Share (%), by Production Analysis 2025 & 2033
- Figure 16: India APAC Offshore Support Market Revenue (billion), by Consumption Analysis 2025 & 2033
- Figure 17: India APAC Offshore Support Market Revenue Share (%), by Consumption Analysis 2025 & 2033
- Figure 18: India APAC Offshore Support Market Revenue (billion), by Import Market Analysis (Value & Volume) 2025 & 2033
- Figure 19: India APAC Offshore Support Market Revenue Share (%), by Import Market Analysis (Value & Volume) 2025 & 2033
- Figure 20: India APAC Offshore Support Market Revenue (billion), by Export Market Analysis (Value & Volume) 2025 & 2033
- Figure 21: India APAC Offshore Support Market Revenue Share (%), by Export Market Analysis (Value & Volume) 2025 & 2033
- Figure 22: India APAC Offshore Support Market Revenue (billion), by Price Trend Analysis 2025 & 2033
- Figure 23: India APAC Offshore Support Market Revenue Share (%), by Price Trend Analysis 2025 & 2033
- Figure 24: India APAC Offshore Support Market Revenue (billion), by Country 2025 & 2033
- Figure 25: India APAC Offshore Support Market Revenue Share (%), by Country 2025 & 2033
- Figure 26: Japan APAC Offshore Support Market Revenue (billion), by Production Analysis 2025 & 2033
- Figure 27: Japan APAC Offshore Support Market Revenue Share (%), by Production Analysis 2025 & 2033
- Figure 28: Japan APAC Offshore Support Market Revenue (billion), by Consumption Analysis 2025 & 2033
- Figure 29: Japan APAC Offshore Support Market Revenue Share (%), by Consumption Analysis 2025 & 2033
- Figure 30: Japan APAC Offshore Support Market Revenue (billion), by Import Market Analysis (Value & Volume) 2025 & 2033
- Figure 31: Japan APAC Offshore Support Market Revenue Share (%), by Import Market Analysis (Value & Volume) 2025 & 2033
- Figure 32: Japan APAC Offshore Support Market Revenue (billion), by Export Market Analysis (Value & Volume) 2025 & 2033
- Figure 33: Japan APAC Offshore Support Market Revenue Share (%), by Export Market Analysis (Value & Volume) 2025 & 2033
- Figure 34: Japan APAC Offshore Support Market Revenue (billion), by Price Trend Analysis 2025 & 2033
- Figure 35: Japan APAC Offshore Support Market Revenue Share (%), by Price Trend Analysis 2025 & 2033
- Figure 36: Japan APAC Offshore Support Market Revenue (billion), by Country 2025 & 2033
- Figure 37: Japan APAC Offshore Support Market Revenue Share (%), by Country 2025 & 2033
- Figure 38: South Korea APAC Offshore Support Market Revenue (billion), by Production Analysis 2025 & 2033
- Figure 39: South Korea APAC Offshore Support Market Revenue Share (%), by Production Analysis 2025 & 2033
- Figure 40: South Korea APAC Offshore Support Market Revenue (billion), by Consumption Analysis 2025 & 2033
- Figure 41: South Korea APAC Offshore Support Market Revenue Share (%), by Consumption Analysis 2025 & 2033
- Figure 42: South Korea APAC Offshore Support Market Revenue (billion), by Import Market Analysis (Value & Volume) 2025 & 2033
- Figure 43: South Korea APAC Offshore Support Market Revenue Share (%), by Import Market Analysis (Value & Volume) 2025 & 2033
- Figure 44: South Korea APAC Offshore Support Market Revenue (billion), by Export Market Analysis (Value & Volume) 2025 & 2033
- Figure 45: South Korea APAC Offshore Support Market Revenue Share (%), by Export Market Analysis (Value & Volume) 2025 & 2033
- Figure 46: South Korea APAC Offshore Support Market Revenue (billion), by Price Trend Analysis 2025 & 2033
- Figure 47: South Korea APAC Offshore Support Market Revenue Share (%), by Price Trend Analysis 2025 & 2033
- Figure 48: South Korea APAC Offshore Support Market Revenue (billion), by Country 2025 & 2033
- Figure 49: South Korea APAC Offshore Support Market Revenue Share (%), by Country 2025 & 2033
- Figure 50: Australia APAC Offshore Support Market Revenue (billion), by Production Analysis 2025 & 2033
- Figure 51: Australia APAC Offshore Support Market Revenue Share (%), by Production Analysis 2025 & 2033
- Figure 52: Australia APAC Offshore Support Market Revenue (billion), by Consumption Analysis 2025 & 2033
- Figure 53: Australia APAC Offshore Support Market Revenue Share (%), by Consumption Analysis 2025 & 2033
- Figure 54: Australia APAC Offshore Support Market Revenue (billion), by Import Market Analysis (Value & Volume) 2025 & 2033
- Figure 55: Australia APAC Offshore Support Market Revenue Share (%), by Import Market Analysis (Value & Volume) 2025 & 2033
- Figure 56: Australia APAC Offshore Support Market Revenue (billion), by Export Market Analysis (Value & Volume) 2025 & 2033
- Figure 57: Australia APAC Offshore Support Market Revenue Share (%), by Export Market Analysis (Value & Volume) 2025 & 2033
- Figure 58: Australia APAC Offshore Support Market Revenue (billion), by Price Trend Analysis 2025 & 2033
- Figure 59: Australia APAC Offshore Support Market Revenue Share (%), by Price Trend Analysis 2025 & 2033
- Figure 60: Australia APAC Offshore Support Market Revenue (billion), by Country 2025 & 2033
- Figure 61: Australia APAC Offshore Support Market Revenue Share (%), by Country 2025 & 2033
- Figure 62: Singapore APAC Offshore Support Market Revenue (billion), by Production Analysis 2025 & 2033
- Figure 63: Singapore APAC Offshore Support Market Revenue Share (%), by Production Analysis 2025 & 2033
- Figure 64: Singapore APAC Offshore Support Market Revenue (billion), by Consumption Analysis 2025 & 2033
- Figure 65: Singapore APAC Offshore Support Market Revenue Share (%), by Consumption Analysis 2025 & 2033
- Figure 66: Singapore APAC Offshore Support Market Revenue (billion), by Import Market Analysis (Value & Volume) 2025 & 2033
- Figure 67: Singapore APAC Offshore Support Market Revenue Share (%), by Import Market Analysis (Value & Volume) 2025 & 2033
- Figure 68: Singapore APAC Offshore Support Market Revenue (billion), by Export Market Analysis (Value & Volume) 2025 & 2033
- Figure 69: Singapore APAC Offshore Support Market Revenue Share (%), by Export Market Analysis (Value & Volume) 2025 & 2033
- Figure 70: Singapore APAC Offshore Support Market Revenue (billion), by Price Trend Analysis 2025 & 2033
- Figure 71: Singapore APAC Offshore Support Market Revenue Share (%), by Price Trend Analysis 2025 & 2033
- Figure 72: Singapore APAC Offshore Support Market Revenue (billion), by Country 2025 & 2033
- Figure 73: Singapore APAC Offshore Support Market Revenue Share (%), by Country 2025 & 2033
- Figure 74: Indonesia APAC Offshore Support Market Revenue (billion), by Production Analysis 2025 & 2033
- Figure 75: Indonesia APAC Offshore Support Market Revenue Share (%), by Production Analysis 2025 & 2033
- Figure 76: Indonesia APAC Offshore Support Market Revenue (billion), by Consumption Analysis 2025 & 2033
- Figure 77: Indonesia APAC Offshore Support Market Revenue Share (%), by Consumption Analysis 2025 & 2033
- Figure 78: Indonesia APAC Offshore Support Market Revenue (billion), by Import Market Analysis (Value & Volume) 2025 & 2033
- Figure 79: Indonesia APAC Offshore Support Market Revenue Share (%), by Import Market Analysis (Value & Volume) 2025 & 2033
- Figure 80: Indonesia APAC Offshore Support Market Revenue (billion), by Export Market Analysis (Value & Volume) 2025 & 2033
- Figure 81: Indonesia APAC Offshore Support Market Revenue Share (%), by Export Market Analysis (Value & Volume) 2025 & 2033
- Figure 82: Indonesia APAC Offshore Support Market Revenue (billion), by Price Trend Analysis 2025 & 2033
- Figure 83: Indonesia APAC Offshore Support Market Revenue Share (%), by Price Trend Analysis 2025 & 2033
- Figure 84: Indonesia APAC Offshore Support Market Revenue (billion), by Country 2025 & 2033
- Figure 85: Indonesia APAC Offshore Support Market Revenue Share (%), by Country 2025 & 2033
- Figure 86: Rest of Asia Pacific APAC Offshore Support Market Revenue (billion), by Production Analysis 2025 & 2033
- Figure 87: Rest of Asia Pacific APAC Offshore Support Market Revenue Share (%), by Production Analysis 2025 & 2033
- Figure 88: Rest of Asia Pacific APAC Offshore Support Market Revenue (billion), by Consumption Analysis 2025 & 2033
- Figure 89: Rest of Asia Pacific APAC Offshore Support Market Revenue Share (%), by Consumption Analysis 2025 & 2033
- Figure 90: Rest of Asia Pacific APAC Offshore Support Market Revenue (billion), by Import Market Analysis (Value & Volume) 2025 & 2033
- Figure 91: Rest of Asia Pacific APAC Offshore Support Market Revenue Share (%), by Import Market Analysis (Value & Volume) 2025 & 2033
- Figure 92: Rest of Asia Pacific APAC Offshore Support Market Revenue (billion), by Export Market Analysis (Value & Volume) 2025 & 2033
- Figure 93: Rest of Asia Pacific APAC Offshore Support Market Revenue Share (%), by Export Market Analysis (Value & Volume) 2025 & 2033
- Figure 94: Rest of Asia Pacific APAC Offshore Support Market Revenue (billion), by Price Trend Analysis 2025 & 2033
- Figure 95: Rest of Asia Pacific APAC Offshore Support Market Revenue Share (%), by Price Trend Analysis 2025 & 2033
- Figure 96: Rest of Asia Pacific APAC Offshore Support Market Revenue (billion), by Country 2025 & 2033
- Figure 97: Rest of Asia Pacific APAC Offshore Support Market Revenue Share (%), by Country 2025 & 2033
List of Tables
- Table 1: Global APAC Offshore Support Market Revenue billion Forecast, by Production Analysis 2020 & 2033
- Table 2: Global APAC Offshore Support Market Revenue billion Forecast, by Consumption Analysis 2020 & 2033
- Table 3: Global APAC Offshore Support Market Revenue billion Forecast, by Import Market Analysis (Value & Volume) 2020 & 2033
- Table 4: Global APAC Offshore Support Market Revenue billion Forecast, by Export Market Analysis (Value & Volume) 2020 & 2033
- Table 5: Global APAC Offshore Support Market Revenue billion Forecast, by Price Trend Analysis 2020 & 2033
- Table 6: Global APAC Offshore Support Market Revenue billion Forecast, by Region 2020 & 2033
- Table 7: Global APAC Offshore Support Market Revenue billion Forecast, by Production Analysis 2020 & 2033
- Table 8: Global APAC Offshore Support Market Revenue billion Forecast, by Consumption Analysis 2020 & 2033
- Table 9: Global APAC Offshore Support Market Revenue billion Forecast, by Import Market Analysis (Value & Volume) 2020 & 2033
- Table 10: Global APAC Offshore Support Market Revenue billion Forecast, by Export Market Analysis (Value & Volume) 2020 & 2033
- Table 11: Global APAC Offshore Support Market Revenue billion Forecast, by Price Trend Analysis 2020 & 2033
- Table 12: Global APAC Offshore Support Market Revenue billion Forecast, by Country 2020 & 2033
- Table 13: Global APAC Offshore Support Market Revenue billion Forecast, by Production Analysis 2020 & 2033
- Table 14: Global APAC Offshore Support Market Revenue billion Forecast, by Consumption Analysis 2020 & 2033
- Table 15: Global APAC Offshore Support Market Revenue billion Forecast, by Import Market Analysis (Value & Volume) 2020 & 2033
- Table 16: Global APAC Offshore Support Market Revenue billion Forecast, by Export Market Analysis (Value & Volume) 2020 & 2033
- Table 17: Global APAC Offshore Support Market Revenue billion Forecast, by Price Trend Analysis 2020 & 2033
- Table 18: Global APAC Offshore Support Market Revenue billion Forecast, by Country 2020 & 2033
- Table 19: Global APAC Offshore Support Market Revenue billion Forecast, by Production Analysis 2020 & 2033
- Table 20: Global APAC Offshore Support Market Revenue billion Forecast, by Consumption Analysis 2020 & 2033
- Table 21: Global APAC Offshore Support Market Revenue billion Forecast, by Import Market Analysis (Value & Volume) 2020 & 2033
- Table 22: Global APAC Offshore Support Market Revenue billion Forecast, by Export Market Analysis (Value & Volume) 2020 & 2033
- Table 23: Global APAC Offshore Support Market Revenue billion Forecast, by Price Trend Analysis 2020 & 2033
- Table 24: Global APAC Offshore Support Market Revenue billion Forecast, by Country 2020 & 2033
- Table 25: Global APAC Offshore Support Market Revenue billion Forecast, by Production Analysis 2020 & 2033
- Table 26: Global APAC Offshore Support Market Revenue billion Forecast, by Consumption Analysis 2020 & 2033
- Table 27: Global APAC Offshore Support Market Revenue billion Forecast, by Import Market Analysis (Value & Volume) 2020 & 2033
- Table 28: Global APAC Offshore Support Market Revenue billion Forecast, by Export Market Analysis (Value & Volume) 2020 & 2033
- Table 29: Global APAC Offshore Support Market Revenue billion Forecast, by Price Trend Analysis 2020 & 2033
- Table 30: Global APAC Offshore Support Market Revenue billion Forecast, by Country 2020 & 2033
- Table 31: Global APAC Offshore Support Market Revenue billion Forecast, by Production Analysis 2020 & 2033
- Table 32: Global APAC Offshore Support Market Revenue billion Forecast, by Consumption Analysis 2020 & 2033
- Table 33: Global APAC Offshore Support Market Revenue billion Forecast, by Import Market Analysis (Value & Volume) 2020 & 2033
- Table 34: Global APAC Offshore Support Market Revenue billion Forecast, by Export Market Analysis (Value & Volume) 2020 & 2033
- Table 35: Global APAC Offshore Support Market Revenue billion Forecast, by Price Trend Analysis 2020 & 2033
- Table 36: Global APAC Offshore Support Market Revenue billion Forecast, by Country 2020 & 2033
- Table 37: Global APAC Offshore Support Market Revenue billion Forecast, by Production Analysis 2020 & 2033
- Table 38: Global APAC Offshore Support Market Revenue billion Forecast, by Consumption Analysis 2020 & 2033
- Table 39: Global APAC Offshore Support Market Revenue billion Forecast, by Import Market Analysis (Value & Volume) 2020 & 2033
- Table 40: Global APAC Offshore Support Market Revenue billion Forecast, by Export Market Analysis (Value & Volume) 2020 & 2033
- Table 41: Global APAC Offshore Support Market Revenue billion Forecast, by Price Trend Analysis 2020 & 2033
- Table 42: Global APAC Offshore Support Market Revenue billion Forecast, by Country 2020 & 2033
- Table 43: Global APAC Offshore Support Market Revenue billion Forecast, by Production Analysis 2020 & 2033
- Table 44: Global APAC Offshore Support Market Revenue billion Forecast, by Consumption Analysis 2020 & 2033
- Table 45: Global APAC Offshore Support Market Revenue billion Forecast, by Import Market Analysis (Value & Volume) 2020 & 2033
- Table 46: Global APAC Offshore Support Market Revenue billion Forecast, by Export Market Analysis (Value & Volume) 2020 & 2033
- Table 47: Global APAC Offshore Support Market Revenue billion Forecast, by Price Trend Analysis 2020 & 2033
- Table 48: Global APAC Offshore Support Market Revenue billion Forecast, by Country 2020 & 2033
- Table 49: Global APAC Offshore Support Market Revenue billion Forecast, by Production Analysis 2020 & 2033
- Table 50: Global APAC Offshore Support Market Revenue billion Forecast, by Consumption Analysis 2020 & 2033
- Table 51: Global APAC Offshore Support Market Revenue billion Forecast, by Import Market Analysis (Value & Volume) 2020 & 2033
- Table 52: Global APAC Offshore Support Market Revenue billion Forecast, by Export Market Analysis (Value & Volume) 2020 & 2033
- Table 53: Global APAC Offshore Support Market Revenue billion Forecast, by Price Trend Analysis 2020 & 2033
- Table 54: Global APAC Offshore Support Market Revenue billion Forecast, by Country 2020 & 2033
Frequently Asked Questions
1. What is the projected Compound Annual Growth Rate (CAGR) of the APAC Offshore Support Market?
The projected CAGR is approximately 4.2%.
2. Which companies are prominent players in the APAC Offshore Support Market?
Key companies in the market include Tidewater Inc, PACC Offshore Services Holdings Ltd, Kawasaki Kisen Kaisha Ltd*List Not Exhaustive, Solstad Offshore ASA, MMA Offshore Limited, Seacor Marine Holdings Inc, Nam Cheong Offshore Pte Ltd, Maersk Supply Services AS.
3. What are the main segments of the APAC Offshore Support Market?
The market segments include Production Analysis, Consumption Analysis, Import Market Analysis (Value & Volume), Export Market Analysis (Value & Volume), Price Trend Analysis.
4. Can you provide details about the market size?
The market size is estimated to be USD 25.5 billion as of 2022.
5. What are some drivers contributing to market growth?
4.; Increasing Offshore Exploration and Production Activities4.; Development of Offshore Wind Energy.
6. What are the notable trends driving market growth?
Anchor Handling Tug/Anchor Handling Towing Supply (AHT/AHTS) Vessels to Dominate the Market.
7. Are there any restraints impacting market growth?
4.; Rising Demand for Dynamic Positioning (DP) Drilling Rigs.
8. Can you provide examples of recent developments in the market?
In January 2022, TSS Pioneer, an offshore support vessel built by Vard at the Vung Tau shipyard in Vietnam, completed sea trials offshore Vietnam. The vessel will be delivered to Ta Shang Marine, a joint company owned by Mitsui O.S.K. Lines and Ta Tong Marine.
9. What pricing options are available for accessing the report?
Pricing options include single-user, multi-user, and enterprise licenses priced at USD 4750, USD 5250, and USD 8750 respectively.
10. Is the market size provided in terms of value or volume?
The market size is provided in terms of value, measured in billion.
11. Are there any specific market keywords associated with the report?
Yes, the market keyword associated with the report is "APAC Offshore Support Market," which aids in identifying and referencing the specific market segment covered.
12. How do I determine which pricing option suits my needs best?
The pricing options vary based on user requirements and access needs. Individual users may opt for single-user licenses, while businesses requiring broader access may choose multi-user or enterprise licenses for cost-effective access to the report.
13. Are there any additional resources or data provided in the APAC Offshore Support Market report?
While the report offers comprehensive insights, it's advisable to review the specific contents or supplementary materials provided to ascertain if additional resources or data are available.
14. How can I stay updated on further developments or reports in the APAC Offshore Support Market?
To stay informed about further developments, trends, and reports in the APAC Offshore Support Market, consider subscribing to industry newsletters, following relevant companies and organizations, or regularly checking reputable industry news sources and publications.
Methodology
Step 1 - Identification of Relevant Samples Size from Population Database


Step 2 - Approaches for Defining Global Market Size (Value, Volume* & Price*)

Note*: In applicable scenarios
Step 3 - Data Sources
Primary Research
- Web Analytics
- Survey Reports
- Research Institute
- Latest Research Reports
- Opinion Leaders
Secondary Research
- Annual Reports
- White Paper
- Latest Press Release
- Industry Association
- Paid Database
- Investor Presentations

Step 4 - Data Triangulation
Involves using different sources of information in order to increase the validity of a study
These sources are likely to be stakeholders in a program - participants, other researchers, program staff, other community members, and so on.
Then we put all data in single framework & apply various statistical tools to find out the dynamic on the market.
During the analysis stage, feedback from the stakeholder groups would be compared to determine areas of agreement as well as areas of divergence